适用于MetaTrader 4的新技术指标

SMC 时段指标 是一种精确工具,专为依赖 ICT 概念、流动性搜寻 和 基于时段的策略 的 智能货币交易者 而设计。它使用机构级交易者使用的最成熟和最流行的概念,无缝地绘制出关键的基于时段的交易区域。这种一体化时段指标将最有效和高概率的区间策略叠加到您的图表上,包括: ICT 亚洲区间、伦敦突破、纽约区间、ICT 伦敦开盘杀戮区、ICT 纽约开盘杀戮区、开盘区间突破 (ORB) (涵盖 伦敦、纽约、东京 )和强大的 午夜开盘区间 。它还突出显示 主要的外汇交易时段, 包括 悉尼、东京、伦敦 和 纽约 。每个区间都使用 TimeBox 方法以最高精度绘制, 有助于识别关键的 FVG(公允价值差距)、区间扫描、时段高点/低点 和潜在的 做市商操纵区域 。该指标专为严肃的 SMC 交易者设计,高度可定制,以与任何经纪商的服务器时间保持一致,从而能够在任何图表或时间范围内精确执行。
ICT 亚洲区间策略: ICT 亚洲区间 策略是智能货币和 ICT 框架下的基础策略。它识别 格林威治标准时间 23:00 至 04:00 之间的累积和盘整区域,这些区域通常会设置流动性陷阱,并使交
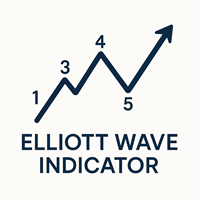
Meta Trader 4的艾略特波浪理论指标 艾略特波浪理论指标基于外汇市场中的专业概念开发,可以绘制市场结构为波浪形态,并标注1至5的上升和下降波浪,让用户能够清晰看到艾略特波浪,并在新波浪出现时收到提醒。此指标包含主波浪和子波浪,可用两种不同颜色区分大波浪和小波浪,用户还可以启用或禁用任一波浪。 额外资源 对于希望进一步提升市场分析能力的交易者,推荐探索我们的高级工具: 市场结构突破 (MSB)。 此指标通过识别市场结构中的关键突破点,完美补充艾略特波浪理论指标。 https://www.mql5.com/en/market/product/109958 主要特点 双波浪识别 : 同时识别主波浪和子波浪,全面展现市场走势。 自动波浪计数 : 根据高点和低点自动标注1至5波,简化分析过程。 可自定义参数 : 可分别为主波浪和子波浪设置深度、偏差和回撤参数,适应不同交易策略。 提醒系统 : 在特定波浪计数时接收提醒,及时把握交易机会。 ️ 指标设置 历史限制 : 最大处理柱数 : 设置处理的最大K线数量(默认:1000)。 标签偏移 : 波浪标签的水平
FREE

Hello fellow trader, I have built this indicator by combining trend and entry mechanisms i have used for years. This is one of my high probability strategies. All calculations are done based on pure price action-based market structure.
Multiple confluences are used to validate and filter entries. All calculations are done behind the scenes, and you are given only buy sell signals. Accuracy becomes higher and higher as you trade higher timeframes, also based on my experience with the technique,

伦敦交易时段突破策略指标 专为遵循 ICT(内部交易者) 和 智能货币概念(SMC)的 交易者设计,专注于伦敦交易时段内基于交易时段的 流动性追逐、杀伤区 和 做市商行为 。该工具捕捉格林威治标准 时间00:00 至 07:00 之间的最高价位和最低价位,这通常被称为 伦敦杀伤区 或 做市商区间 。它可以帮助交易者识别机构活动和波动性激增最常出现的潜在突破区域。
该指标以清晰的图形直观地突出显示 交易时段、价格区间、公允价值缺口 (FVG) 和 突破水平 。它支持分析 流动性波动、区间盘整 和 价格突然上涨等 伦敦交易时段的核心行为。通过与流动性区域和市场结构变化保持一致,交易者可以更好地了解价格可能上涨或反转的位置。
时段高/低线和突破信号提供了一个清晰的框架,用于识别基于市场结构、突破阻力、流动性空缺和不平衡区域的设置。此策略对于那些在亚洲时段寻找区间形成并等待价格在伦敦开盘时突破或扫荡区间的交易者尤其有用。交易者可以通过观察流动性的看涨或看跌波动以及对关键机构价格水平的反应来预测市场走势。
此工具非常适合:
使用智能货币概念(SMC)的交易者 ICT战略追随者 伦敦交易时
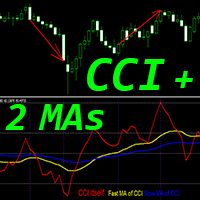
适用于 MT4 的 Crypto_Forex 指标“CCI 和 2 条移动平均线”,无需重绘。
- 商品通道指数 (CCI) 非常适合顺势交易,顺势而为。 - “CCI 和 2 条移动平均线”指标可让您查看 CCI 指标的快速和慢速移动平均线。 - 上升趋势 - 快速移动平均线位于慢速移动平均线上方;下降趋势 - 快速移动平均线位于慢速移动平均线下方。 - CCI 是最常用的交易震荡指标之一 - 它衡量当前价格与历史平均价格之间的差异。 - 选项 1 - 从 50 到 -50 之间的中心区域顺势建仓,当指标分别到达 200/-200 区域时平仓。 - 重要水平:+/-200,选项 2 - 从 +200 以上区域买入,从 -200 以下区域买入,顺势而为。 - 指标让您有机会尽早发现趋势变化。
// 优秀的交易机器人和指标可在此处获取: https://www.mql5.com/en/users/def1380/seller 这是仅在 MQL5 网站上提供的原创产品。
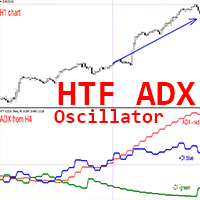
适用于 MT4 的 Crypto_Forex 指标 HTF ADX。
- 使用专业的 MT4 HTF ADX 指标升级您的交易方法。HTF 代表“更高时间框架”。 - ADX(红线)用于衡量趋势强度 - 如果 ADX 值高于 20 且呈上行趋势 - 趋势强劲。 - 如果 +DMI(蓝线)高于 -DMI(绿线):价格上涨,ADX 衡量上涨趋势的强度。 - 如果 -DMI(绿线)高于 +DMI(蓝线):价格下跌,ADX 衡量下跌趋势的强度。 - 此指标非常适合多时间框架趋势交易 - 您可以将更高时间框架的 ADX 附加到您当前的图表中。
// 优秀的交易机器人和指标可在此处获取: https://www.mql5.com/en/users/def1380/seller 这是仅在 MQL5 网站上提供的原创产品。

Crypto_Forex MT4 指标 Heiken Ashi Histo Filter - 是一款出色高效的辅助交易工具!无需重绘!
- 采用先进的新型计算方法 - “计算价格”参数提供 10 个选项。 - 非常适合与价格行为模式结合使用: - 绿色直方图 - 寻找看涨形态。 - 洋红色直方图 - 寻找看跌形态。 - 使用此指标,即使是标准策略也能获得充足的升级机会。 - 指标内置移动端、PC 端和电子邮件提醒。 ................................................................................................................. // 优秀的交易机器人和指标可在此处获取: https://www.mql5.com/en/users/def1380/seller 这是仅在 MQL5 网站上提供的原创产品。
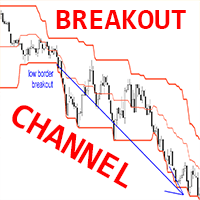
Crypto_Forex MT4 突破通道指标,无需重绘。
- 该指标可作为基于高/低突破的完整交易系统使用。 - 它只有一个参数 - HYSTORY DEPTH,它反映了指标考虑的 K 线数量。 - HYSTORY DEPTH 参数的推荐值:时间范围:D1 - 20(一个月)、H4 - 30(一周)、H1 - 24(一天)。 - 突破通道由三条线组成:高边界 - 最近 N 个(HYSTORY DEPTH 参数)K 线的最高价格,低边界 - 最近 N 个(HYSTORY DEPTH 参数)K 线的最低价格,以及中线。 - 指标可与其他指标/价格行为模式结合使用。 - 突破通道指标的使用示例请参见图片。
// 优秀的交易机器人和指标可在此处获取: https://www.mql5.com/en/users/def1380/seller 这是仅在 MQL5 网站上提供的原创产品。
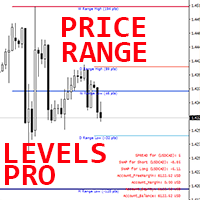
适用于 MT4 的外汇指标“价格区间水平专业版”。
- “价格区间水平专业版”指标是一款非常实用的专业辅助交易工具。 - 它显示价格可能达到的每日、每周和每月最可能水平(价格区间水平)。 - 每日区间适合日内交易者。 - 每周和每月区间适合波段交易者和长线交易者。 - 指标非常适合规划您的止盈目标或设置止损。 - 它具有信息价差掉期显示功能 - 显示与其关联的外汇对的当前价差和掉期。 - 显示屏还显示账户余额、净值和保证金。 - 您可以在图表的任何角落找到信息价差掉期显示: 0 - 左上角,1 - 右上角,2 - 左下角,3 - 右下角。
// 优秀的交易机器人和指标可在此处获取: https://www.mql5.com/en/users/def1380/seller 这是仅在 MQL5 网站上提供的原创产品。

Crypto_Forex MT4 指标“ RSI SPEED ”——卓越的预测工具,无需重绘。
- 该指标基于物理方程计算。RSI SPEED 是 RSI 本身的一阶导数。 - RSI SPEED 非常适合顺着主趋势方向进行剥头皮交易。 - 建议结合合适的趋势指标使用,例如 HTF MA(如图所示)。 - RSI SPEED 指标显示 RSI 本身方向变化的速度——它非常敏感。 - 建议将 RSI SPEED 指标用于动量交易策略:如果 RSI SPEED 指标的值小于 0:价格动量下降;如果 RSI SPEED 指标的值大于 0:价格动量上升。 - 指标内置移动端和 PC 端警报。
// 优秀的交易机器人和指标可在此处获取: https://www.mql5.com/en/users/def1380/seller 这是仅在 MQL5 网站上提供的原创产品。
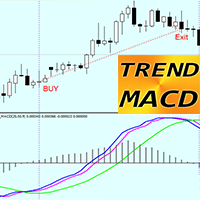
适用于 MT4 的 TREND MACD 指标 - 是一款出色高效的交易工具!
- 该指标非常适合专注于捕捉大幅价格波动的趋势交易者。 - TREND MACD 由三条线组成:绿线 - 显示主要趋势方向,蓝线和洋红色线用于进场和出场。 - 指标可实现利润最大化 - 避免过早退出盈利交易。 - 指标内置移动端和 PC 端警报。
如何使用指标进行买入交易(见图): 1) 检查蓝线和洋红色线是否均高于绿线。 2) 当蓝线高于洋红色线时,买入。 3) 当蓝线低于洋红色线时,退出交易。 4) 卖出交易时,反之亦然。
// 优秀的交易机器人和指标可在此处获取: https://www.mql5.com/en/users/def1380/seller 这是仅在 MQL5 网站上提供的原创产品。
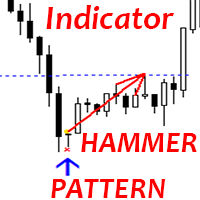
适用于 MT4 的 Crypto_Forex 指标“锤子形态”。
- “锤子形态”指标是一款非常强大的价格行为交易指标:无需重绘,无延迟。 - 指标可检测图表上的看涨锤子形态:图表上显示蓝色箭头信号(见图)。 - 支持 PC、移动设备和电子邮件提醒。 - “锤子形态”指标非常适合与支撑/阻力位结合使用。 ................................................................................................................. // 优秀的交易机器人和指标可在此处获取: https://www.mql5.com/en/users/def1380/seller 这是仅在 MQL5 网站上提供的原创产品。
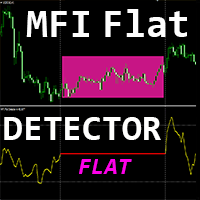
Crypto_Forex 指标“MFI 平移检测器”是一款高效的交易辅助工具!无需重绘。 我推荐您使用这款适用于 MT4 的出色指标来升级您的交易方法。
- 指标在图表上显示价格平移区域。它具有“平移敏感度”参数,用于平移检测。 - “MFI 平移检测器”对于背离检测非常有用,并且非常适合与价格行为结合使用。 - 您可以将其用于趋势跟踪系统,以检测平移区域并避免在该区域交易。 - 您可以将其用于反转剥头皮交易 - 从平边进行反转交易。 - 有很多机会可以使用“MFI 平移检测器”替代标准的 MFI 振荡指标。 - 资金流量指数 (MFI) 本身是一个技术振荡指标,它使用价格和成交量数据来识别超卖和超买区域。 - 当 MFI 高于 80 时,建议在超买时卖出;当 MFI 低于 20 时,建议在超卖时买入。
// 优秀的交易机器人和指标可在此处获取: https://www.mql5.com/en/users/def1380/seller 这是仅在 MQL5 网站上提供的原创产品。

纽约区间指标 是一款基于交易时段的分析工具,专为运用 ICT(内部交易者) 概念、智能货币交易 和 机构价格行为方法的 交易者而开发。该指标专为纽约交易时段设计,捕捉格林威治标准时间(GMT) 12:00 至 14:00 之间的价格区间,这一关键时段与 伦敦收盘价 和 纽约开盘价 重叠。它能够识别 交易时段的最高价和最低价 ,检测 公允价值缺口(FVG) ,并突出显示潜在的 流动性扫荡区域 ,帮助交易者精准分析 做市商行为、交易时段区间突破 和 回撤机会 。
该策略专注于理解 纽约杀戮区 与 伦敦纽约交易时段 重叠 期间发生的 市场结构转变 以及 累积或分布模式 。该指标提供了一个结构化的可视化框架,用于使用 智能货币概念 解读图表,例如 结构突破(BOS)、市场结构转变(MSS)、位移蜡烛图、不平衡区域 和 流动性空缺 。该工具允许交易者分析 交易区间、 等待 流动性抢占 并监控 FVG的填充反应 ,使其非常适合 回撤入场、后期突破 和 反转设置 。
该指标适合那些希望利用 纽约交易时段 常见的高波动性和机构交易量的交易者。它支持分析 外汇交易周期 内的 价格走势 ,尤其
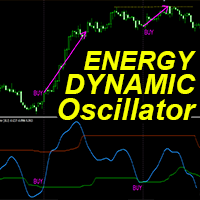
“动态能量震荡指标”是一款高级自定义加密货币外汇指标,适用于 MT4 平台,效率极高!
- 新一代震荡指标 - 参见图片了解如何使用。 - 动态能量震荡指标具有自适应超卖/超买区域。 - 这是一个技术动量指标,在趋势市场中非常有用。 - 震荡指标是一种辅助工具,可帮助您在超卖/超买区域找到准确的入场点。 - 超卖值:低于绿线,超买值:高于橙线。 - 它比标准震荡指标更精准。适用时间范围:30 分钟、1 小时、4 小时、1 天、1 周。 - 提供 PC 和移动端警报。 ................................................................................................................. // 优秀的交易机器人和指标可在此处获取: https://www.mql5.com/en/users/def1380/seller 本产品为独家产品,仅在 MQL5 网站提供。
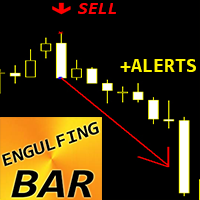
Crypto_Forex 指标 ENGULFING Bar Pattern 适用于 MT4。
- “ENGULFING Bar” 指标是一款非常强大的价格行为交易指标:无需重绘,无延迟。 - 指标可检测图表上的吞噬条形: - 看涨吞噬条形 - 图表上显示蓝色箭头信号(见图)。 - 看跌吞噬条形 - 图表上显示红色箭头信号(见图)。 - 提供 PC、手机和电子邮件提醒。 - “ENGULFING Bar Pattern” 指标非常适合与支撑/阻力位结合使用。 ................................................................................................................. // 优秀的交易机器人和指标可在此处获取: https://www.mql5.com/en/users/def1380/seller 本产品为独家产品,仅在本 MQL5 网站上提供。

ICT伦敦开盘杀戮区指标 是一款基于 “智能货币” 的交易工具,专为遵循 ICT、SMC (智能货币概念) 等机构概念以及 基于流动性的市场结构策略的 外汇交易者设计。该指标重点关注伦敦开盘杀戮区,具体为格林威治标准 时间06:00 至 08:00 。由于亚洲交易时段和伦敦市场开盘之间的流动性重叠,该时段以波动性和价格错位而闻名。
此时间窗口通常充当高概率设置的 触发区 ,做市商在此触发流动性追寻。该指标会自动 标记“杀伤区”范围 ,并 识别前一交易日高点和低点的震荡 ,尤其是 亚洲交易日的震荡范围 。这些流动性震荡是许多ICT入场模型的关键组成部分。该工具可帮助用户分析价格在震荡后是否达到了 溢价 区或 折价区 ,从而更容易与 MSS(市场结构转变)、 结构突破 和 FVG(公允价值缺口) 等入场模式进行匹配。
该工具使用清晰定义的 时间框、区间高/低水平 以及 符号标记 来可视化交易时段,这些标记指示价格是否将流动性推高至区间上方或下方。这在根据 交易时段时间、流动性突袭 和 价格拒绝 识别交易机会时提供了高度的清晰度。FVG 区域检测 功能的加入进一步支持了那些在关
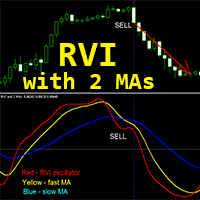
Crypto_Forex 指标“RVI 和 2 条移动平均线”适用于 MT4,无需重绘。
- Relative_Vigor_Index (RVI) 本身是一个技术动量指标,在趋势市场中非常有用。 - “RVI 和 2 条移动平均线”指标允许您查看 RVI 振荡指标的快速和慢速移动平均线。 - 指标非常适合动量交易,尤其是在大时间框架下:日线、4 小时线、1 小时线、30 分钟线。 - 该指标可通过参数轻松设置,适用于任何时间框架。 - 您可以在图片上看到买入和卖出的入场条件。 - 买入入场条件: (1)- 快速黄色移动平均线高于慢速蓝色移动平均线;(2)- 红色 RVI 线高于快速黄色移动平均线;(3)- 红色 RVI 线从快速黄色移动平均线向上反弹。 - 卖出入场条件: (1)- 快速黄色移动平均线低于慢速蓝色移动平均线;(2)- 红色 RVI 线低于快速黄色移动平均线;(3)- 红色 RVI 线从快速黄色移动平均线向下反弹。
// 优秀的交易机器人和指标可在此处获取: https://www.mql5.com/en/users/def1380/seller 本产品为独家产品,

IMPULSE HUNTER Impulse Hunter 是一款专业的动态交易指标,专为捕捉全球三大活跃交易时段 —— 亚洲 、 伦敦 和 纽约 的关键价格突破而设计。它为交易者提供了清晰可视的结构,包括 基于交易时段的突破区域 、 分阶段的止盈目标 以及 可自适应的止损设置 ,帮助交易者精准把握进出场机会。 欢迎加入我们的频道: 获取最新功能、版本更新与独家内容: https://www.mql5.com/en/channels/forexnewadvisor
如需快速回复,请通过 Tel 联系我。用户: forexnewadvisor
功能说明 每个交易时段开始时: 指标会绘制一个参考框,标记当前时段初始的最高价和最低价。 突破逻辑: 当价格向上或向下突破该框体时,视为潜在交易信号。 进出场区域: Impulse Hunter 会在图表上清晰标出建议的买入/卖出区域,并显示 TP1、TP2、TP3 和 SL 的参考水平。 视觉适配: 可根据图表背景颜色自动调整显示效果,即便在深色主题下也保持清晰可读。 自动止损逻辑: 启用后,将根据不同货币对自动设定

Happy Scalping Indicator Watch the live trading: https://youtu.be/QR5F_9uIb6k Join the Happy Scalping channel: https://www.mql5.com/en/channels/forexnewadvisor For an immediate response, message me at Tel. User: forexnewadvisor
This indicator was designed for aggressive scalping and quick entries in binary options , generating signals on every candle , so you can know exactly what’s happening at all times.
No repainting : the signal of the current candle is generated in REAL TIM
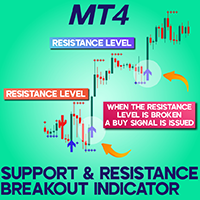
Support Resistance Breakout Indicator (SRBAI) download for MetaTrader 4
The Support Resistance Breakout Indicator (SRBAI) available for MetaTrader 4 (MT4) is designed to highlight significant pivot zones by mapping support and resistance levels on the price chart. Blue dashed lines represent support zones, while red dashed lines indicate resistance levels. Once the price breaks through a support area, the indicator generates a sell alert with a red downward-pointing arrow. Conversely, a resista
FREE
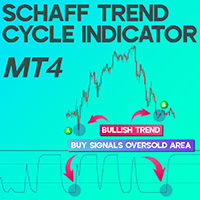
Schaff Trend Cycle Indicator for MetaTrader4 The Schaff Trend Cycle Indicator for MetaTrader4 merges the core functionalities of two widely used indicators—MACD (Moving Average Convergence Divergence) and the Stochastic Oscillator. This tool is engineered to identify trend reversals and momentum extremes with enhanced sensitivity. Readings below 25 often signal an oversold market, while values above 75 highlight overbought conditions. This makes the STC highly reliable for early trend recognitio
FREE

Average Daily Range (ADR) Indicator for MetaTrader 4 The Average Daily Range (ADR) Indicator for MetaTrader 4 is a vital technical analysis tool used to assess the typical price movement range an asset experience during a trading day.
By analyzing the average distance between daily highs and lows over a specified number of days, this indicator defines the ADR High (upper boundary) and ADR Low (lower boundary), helping traders identify possible support and resistance zones. «Indicator Installatio
FREE
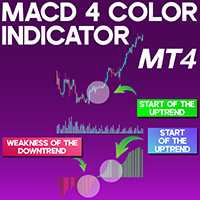
MACD 4 Color Indicator for MetaTrader 4
The MACD 4 Color Indicator for MetaTrader 4 (MACD 4C) is a refined upgrade of the traditional MACD, designed to not only indicate trend direction but also visualize the strength of the trend using four distinct color codes. These color variations are derived from the gradient of the moving average lines. It is particularly effective for identifying when a trend begins or starts to fade. The tool also incorporates divergence and convergence principles, mak
FREE
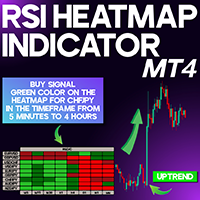
RSI Heatmap Indicator for MetaTrader4 The RSI Heatmap Indicator is a powerful technical tool in MetaTrader 4 that allows traders to assess the relative strength conditions of different currency pairs via a color-coded heatmap. By merging the Relative Strength Index (RSI) with a visual heatmap approach, this indicator simplifies market analysis by displaying strength and directional bias of multiple instruments at a glance. This indicator produces a heatmap based on calculated RSI levels across v
FREE
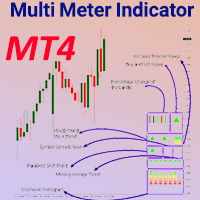
Multi Meter Indicator (MMI) for MetaTrader 4
The Multi Meter Indicator (MMI) on the MetaTrader 4 (MT4) platform is an advanced visual tool that integrates nine technical indicators into one compact panel, including a 14-period Moving Average displayed in the upper right corner. With MMI, traders can evaluate market momentum and buyer-seller dynamics with a consolidated data view on their charts. «Indicator Installation & User Guide»
MT4 Indicator Installation | Multi Meter Indicator MMI MT5
FREE
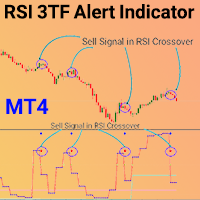
RSI 3TF Alert Indicator for MetaTrader 4 The RSI 3TF Alert Indicator for MetaTrader 4 (MT4) is designed around the RSI indicator utilizing a 2-period configuration. The RSI 3TFA integrates 3 distinct RSI indicators into a single chart view, making market analysis more streamlined for traders. When all 3 RSI indicators move above the 50 threshold, the RSI 3TFA generates a buy signal, and conversely, when they cross below the 50 level, it issues a sell signal. The yellow dots (blue in default conf
FREE

Indicator defines the buy and sell arrows with high performance and consistent results . Automatic analysis of market opportunities ; Identifies a direction of a trend; Suitable for trend trading or following the trend;
This is FREE demo version of the indicator and works only on "EURUSD M5".
Forex Trend Commander full version: All details about the indicator here : Works in all symbols + free Multi Currency Scanner + free SPECIAL BONUS .
FREE
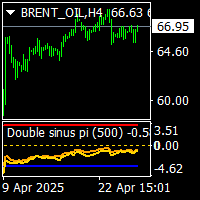
on back test use date.and not set too much back date. double sinus waves pi indicator is no repaint moving average and levels indicator. it works all timeframes and all pairs. it is combined with sinus wave and smoothed sinus wave indicator. and indexed to pi number over bought and oversell levels. it is easy to to use and suitable for experienced traders and beginners. cnt value has been set to 1000 bars.it can be increased acording to charts bar numbers. minimum cnt value mast be higher than
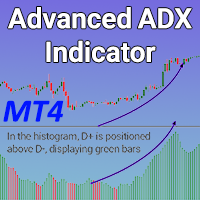
Advanced ADX Indicator for MetaTrader 4 The Advanced ADX Indicator for MetaTrader 4 (MT4) is designed to gauge the intensity of prevailing price movements in the market. This tool visualizes the strength of the trend using a histogram that spans from 0 to 100, using green bars to indicate bullish strength and red bars for bearish momentum. A taller histogram bar reflects a more dominant trend. The oscillator typically uses a 13-period setting as its default configuration. «Indicator Installation
FREE
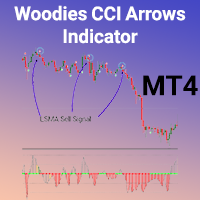
Woodies CCI Arrows Indicator for MetaTrader 4
The Woodies CCI Arrows Indicator for MetaTrader 4 (WCA) is a momentum-based tool that relies on a 14-period Commodity Channel Index (CCI) within the MT4 platform. This custom indicator blends multiple components, including the standard CCI and the Least Squares Moving Average (LSMA). When the CCI maintains an upward slope for six consecutive candles, the indicator highlights this in green. Conversely, a sustained downtrend for six bars is marked in
FREE
Trend detection is one of the basic challenges of every trader. Finding a way to tell when to enter a trade is very important, timing is a game changer, not too early and not too late. Sometimes, due to not knowing the market conditions, the trader closes his positions with a small profit or allows the losses to grow, these are the mistakes that novice traders make. Indicator Trend Whipper is a complete trading strategy and can improve the trader's trading process. The trend detection algorithm

Rocket pro is a powerful indicator for MetaTrader 4, designed to identify the most relevant trends in the financial market. If you are looking for a tool that accurately predicts movements, Rocket pro is your ally.
Live signal: https://www.mql5.com/en/signals/2303662 How it works: This indicator combines three different methods - volume analysis, candlestick closing and symmetrical trend - to detect and signal buying and selling opportunities. Rocket pro is like a "rocket" when it detects a bu

Divergence Divergence refers to when the price of a currency pair moves in one direction while the trend indicator is moving in the opposite direction. With divergence, there can be positive and negative signals. Divergences in Forex trading are quite common signals of technical analysis. These are basic early Forex signals indicating the trend reversal and filter false signals. Application of this indicator It is usually not easy to detect divergences by the trader and it may be time-consuming
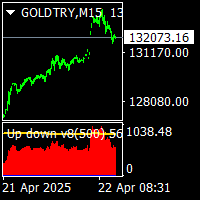
Up down v8 indicator is no repaint counter trend indicator . it try to find market up down points. it works all timeframes and all pairs. suitable for beginner and experienced trader. there is wave and c values to set defaults. minimum processed value cnt can be equal to wave value. traders can change them suitable up down points on different time frames. indicator use moving averages histograms and volatilty trigger. when red histogram is over volatility level that is tops. . when blue histogr
Indicator "Time to Bar End" (TimeToBarEnd)
This technical indicator is designed to accurately track the time remaining until the current candle closes on the chart. It displays a countdown in minutes:seconds format, which is particularly useful for intraday traders and scalpers who need to know the exact closing time of the current candle. The indicator updates in real-time and offers flexible customization of its appearance. The settings include: choice of position from four chart corners, adj
FREE

Индикатор нейтральной свечи — это инструмент технического анализа, который автоматически определяет зоны нейтральных свечей (neutral candlestick), появляющихся на ценовом графике. Эти зоны, как правило, указывают на неопределённость среди участников рынка и помогают заранее определить возможное направление дальнейшего движения цены. Основные функции: Определяет зоны, где появляются нейтральные свечи. Показывает вероятность движения цены вверх или вниз от этих зон. Помогает трейдеру более точн

Convenient Dashboard for Moving Average Crossover Trading Strategy . On the panel, numbers display how many candles ago a signal occurred. The number 0 means the signal is on the current candle (it may disappear if the crossover does not hold). The number 1 means the signal was on the previous candle (arrows remain, as moving averages have confirmed the crossover). Moving averages can optionally be added, but the indicator works without them. Advantages of the indicator : Automa

Price Change Indicator Introduction The Price Change Indicator is a powerful tool designed to help traders identify significant price movements over a specified period. By calculating and visualizing percentage changes between current and historical prices, it allows traders to quickly spot potential trading opportunities when markets show unusual volatility or momentum. Features Real-time monitoring of price changes Visual histogram display when changes exceed threshold Text display showing cur
FREE

Candle Pattern Finder
Candle Pattern Finder is a powerful MT4 indicator designed to help traders easily detect key candlestick patterns in real-time. Whether you're trading trends, reversals, or consolidations, this tool highlights important price action signals directly on the chart — helping you make faster and more confident trading decisions. Detects popular candlestick patterns: Bullish/Bearish Engulfing Hammer & Inverted Hammer Shooting Star & Hanging Man Three White Soldiers Three Black
FREE
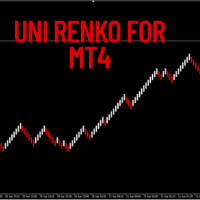
This versatile tool lets you create various Renko-style charts, including Median Renko, Mean Renko, and Traditional Renko with wicks . It offers a wide range of chart options to suit the needs of day traders, scalpers, and long-term investors.
Indicator Settings Starting Price. Box Size (in pips). Shift Percent. Timeframe Name. Show Wicks (On or Off). Amount of Bars.
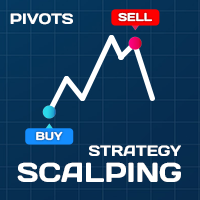
Scalping Strategy BUY SELL
Having a strategy in the market is one of the main conditions for trading. The presence of various and complicated indicators and tools sometimes makes trading difficult, and the user gets confused after trying various methods and gets stuck in a loss cycle, the result of which is usually clear. This indicator is a simple strategy based on the detection of pivots and short-term trends, which helps you to easily trade in trends. Sometimes a simple but efficient st

MACD Indicator The Moving Average Convergence and Divergence (MACD) is a trend following momentum indicator which shows the relationship between two moving averages that we chose and configure them on the indicator. The MACD is calculated by subtracting the 26-period exponential moving average and the 12 period D.A.M. These are the default parameters when you put the MACD indicator on the charts, and the period is usually 9 which means the last 9 candles. DT-Oscillator This is Robert C. Miner's
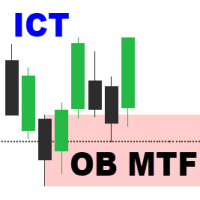
Order Block Multi Timeframe The Order Block Multi Timeframe is a powerful tool for Smart Money Concept (SMC) traders, combining high-accuracy Order Block detection with real-time Break of Structure (BOS) and Change of Character (CHoCH) analysis across multiple timeframes. Smart Money Insight, Multi-Timeframe Precision This indicator automatically identifies institutional Order Blocks —key price zones where large players have entered the market—and plots them directly on your ch

CHoCH & EQH/EQL:市场结构和流动性区域指标 概述: 这款多功能指标旨在帮助交易者识别市场结构的潜在变化,并直接在 MetaTrader 5 图表上精准定位关键流动性区域。它能够自动检测并可视化两个关键的价格行为概念:特征变化 (CHoCH) 指标用于预测潜在反转,以及等高/等低 (EQH/EQL) 指标用于预测重要的支撑/阻力位。 主要特点: 字符变化 (CHoCH) 检测: 尽早发现潜在的趋势逆转或市场势头的转变。 看涨 CHoCH: 当价格突破最近一个重要低点之前形成的最后一个重要高点时发出的信号 。 以 蓝色 向上 箭头 、 蓝色“O”符号 以及 突破高点处的 蓝色虚线标记。 看跌 CHoCH: 当价格跌破最近一个重要高点之前形成的最后一个重要低点时发出的信号 。 标志 为 紫色 向下箭头 、 紫色“O”符号 ,以及 跌破低点处的 紫色虚线。 使用分形来确定显著的高点和低点(周期可配置)。 等高 (EQH) 和等低 (EQL) 检测: 突出显示潜在的强劲支撑/阻力位以及价格先前在几乎相同水平
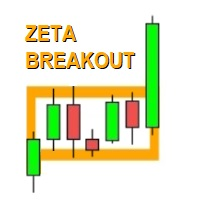
The Zeta Breakout Indicator MT4 is a powerful trading breakout strategy custom indicator. It can help traders determine the level of breakout (support and resistance levels) simple, easily and accurately. Zeta Breakout Indicator MT4 is a custom indicator that created by MQL4 programming language that based on the results of our breakout trading strategy research. It uses a proven strategy with excellent result, good win rate, good risk to reward ratio and few false break out. You can proof how

H4 scalper
The H4 scalper indicator is built specifically for the H4 timeframe and works on all currency pairs.
The H4 scalper indicator is very good for scalping.
BUY and SELL signals are given by the white and yellow circles, respectively.
Take Profit can start from a minimum of 5, 10 pips.
For this indicator to work, you need to download two indicators, Trend envelopes v2 and DSS of momentum + arrows + alerts _ mtf nmc, which you can find in the first comment.
These two indicators are

The Neural Adaptive MACD is a customized MACD indicator for MT4 that visually represents momentum strength using four color-coded histogram bars: strong bullish, bullish, strong bearish, and bearish.
It features neural adaptive signal smoothing and integrates optional real-time alerts, notifying traders of new momentum shifts along with the symbol and timeframe.
This tool enhances decision-making by highlighting trend strength and change dynamics.
Can be used any forex, crypto....
Any timefr

Simple. Informative. Instantly Visible on Your Chart. Alwinson Active Trades Info (MT4 Version) is a lightweight custom indicator that displays a real-time summary of your currently open trades —right on your chart. No more switching tabs just to see what pairs are active and how much lot size is in play.
Alwinson Active Trades Info is also available for the MetaTrader 5 (MT5) version .
Key Features: Displays a list of all symbols with open positions in your trading account. Shows th

GoldStrike Momentum Trend Indicator - The Ultimate Forex Trading Tool Description: Introducing the GoldStrike Momentum Trend Indicator , a powerful and intuitive tool designed for traders seeking precision in their Forex strategies. Using a combination of momentum analysis and the RSI (Relative Strength Index) , this indicator provides buy and sell signals that help you identify optimal entry and exit points, improving your trading decisions. Perfect For: Day traders who need quick, precise sign

The indicator defines the buy and sell arrows with high performance and consistent results. Automatic analysis of market opportunities ; Help traders earn more from their investments;
Never repaints, recalculates or backpaints signals; This is FREE demo version of the indicator and works only on "EUR USD M5". ProTrading Arrow - All details about the indicator here : Works in all symbols and TF + free EA and Multi Currency Scanner + SPECIAL BONUS .
FREE
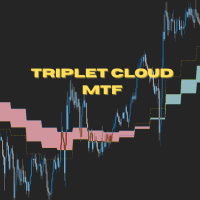
Triplet Cloud MTF is an indicator for trend-following strategy. It presents the trend in HTF from the LTF Chart that allows traders focus on looking for trade entry in the right direction and increase striking rate. It comes with simple input setup. You will only need to choose HTF you want to follow its trend and set the alert setup, then all is set. Here are the mostly selected HTF setup for each of entry timeframe: M1 Entry : M15 Trend M5 Entry : H1 Trend M15 Entry : H4 Trend H1 Entry : D1 Tr
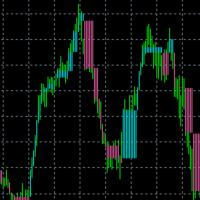
When there is no position, when changing the color, you can consider opening an order. With the fluctuation of the market, when the current color changes again, you need to close the position and leave. Suitable for different cycles, the trading rules are simple and require friends to explore on their own.
I hope friends who use this indicator can make a lot of money, rolling bigger and bigger like a snowball. thank you!
One of the advantages of the Arrow Tracker indicator is its vivid visual representation: Histogram Display: Situated beneath the main price chart, the indicator showcases a histogram. This allows for easy identification of market trends. Color-Coded Bars: Uptrends are demarcated with blue bars, whereas downtrends are depicted with pink bars. This differentiation assists traders in swiftly gauging the market’s directional momentum. Signalling Peaks and Bottoms: The histogram employs yellow
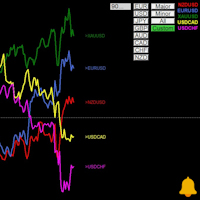
Multi Symbol RSI with alert indicator gives you overall overview of all symbols at once allowing you to compare, and contrast market for broader and simultaneous analysis of various assets at once. You can select categorized pairs from Major, Minors, All or from specific currency like all EUR pairs, USD pairs etc, You can even add your own custom list of symbols is case you want to monitor specific symbols . All of this can be done from the user friendly chart buttons.
Indicator helps in vari
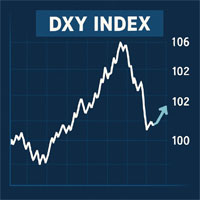
DXY Index indicator to help predict USD effect to your trade. DXY Index will help to see the power of USD.
For example if you trade XAUUSD and the DXY Index weaker, it could be the XAU will be bullish.
The same if DXY Index getting stronger, it could be that XAU will be bearish. I hope this indicator will help many trader to have better position to trade. Use this indicator wisely.

多时间框架 K 线 指标是一款强大的可视化工具,旨在帮助交易者将较低时间框架的分析与较高时间框架的结构相结合。该指标可直接在当前图表上绘制所选较高时间框架(1 小时、4 小时、1 天等)的 K 线图,让您无需切换图表即可更清晰地了解整体市场走势。
谁需要这个指标? 此工具非常适合: 智能货币概念 (SMC) / ICT 交易者依赖较高的时间框架偏差,同时在较低的时间框架上执行交易。 黄牛和日内交易者希望与每日或时段的动量保持同步。 想要快速浏览 HTF 结构同时在较小图表上细化条目的波段交易者。
无论您交易的是价格行为、供需还是趋势跟踪系统,该指标都能确保您的入场得到更高时间范围的强度支持。
策略改进 多时间框架蜡烛图有助于改善: 方向偏差确认——与主导趋势或市场结构保持一致。 精炼入场点——确定最佳入场区域(例如,5M 图上的看涨日线图内)。 假突破过滤——仅按照 HTF 蜡烛的方向进行交易,以避免陷阱。 HTF 流动性意识——从更高的时间范围内发现潜在的灯芯和反应区。
主要特点: 选择任意更高的时间范围进行覆盖。 自定义蜡烛颜色、边框和填充设置。 将 MTF 蜡烛显示在常
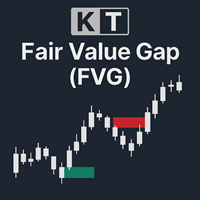
KT Fair Value Gap(FVG)用于识别并高亮显示市场中暂时性的价格不平衡区域。这些缺口通常作为价格延续的潜在区域,有时也可能成为价格反转的起点(也称为反向FVG)。 多头FVG: 以绿色方框显示,这些缺口通常是支撑区,价格可能从此恢复上涨。一旦被回补,也可能成为潜在的反转点。 空头FVG: 以红色方框显示,这些缺口是阻力区,价格可能从此继续下跌。与多头缺口类似,回补后也可能发生趋势反转。
功能特色 简洁清晰的设计: 该指标专为清楚显示FVG区域而设计,帮助交易者专注于关键信息,避免图表混乱。 可视化仪表盘: 屏幕上的小面板可快速显示已回补与未回补FVG的百分比,帮助您快速洞察市场结构。 高度可定制: 可自由调整FVG的阈值水平、已/未回补缺口的可见性,还可以根据个人风格自定义颜色与线条粗细。 即时提醒: 每当检测到新的FVG时,您将立刻收到通知,确保不错过任何潜在交易机会。
什么是已回补的FVG
当一根K线收盘价低于FVG区域下边界时,多头FVG被视为已回补。 当K线收盘价高于FVG区域上边界时,空头FVG被视为已回补。
什么是未回补的FVG
只要没有K线收盘在其下
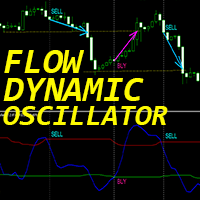
“动态流量振荡器”是一款高级自定义加密货币外汇指标,适用于 MT4 平台,效率极高!
- 新一代振荡器 - 参见图片了解如何使用。 - 动态流量振荡器具有自适应超卖/超买区域。 - 指标使用价格和交易量数据来识别超卖和超买区域。 - 振荡器是一款辅助工具,可帮助您从超卖/超买区域找到准确的入场点。 - 超卖值:低于绿线,超买值:高于红线。 - 它比标准振荡器更精确。适用时间范围:30 分钟、1 小时、4 小时、1 天、1 周。 - 提供 PC 和移动端警报。 ................................................................................................................. // 优秀的交易机器人和指标可在此处获取: https://www.mql5.com/en/users/def1380/seller 本产品为独家产品,仅在 MQL5 网站提供。
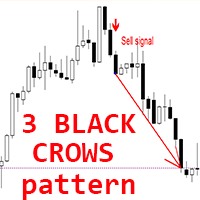
适用于 MT4 的 Crypto_Forex 指标“三只黑乌鸦形态”。
- “三只黑乌鸦形态”指标对于价格行为交易非常有效:无需重绘,无延迟。 - 指标可检测图表上看跌的“三只黑乌鸦”形态:图表上出现红色箭头信号(见图)。 - 支持 PC、手机和电子邮件提醒。 - 其兄弟——看涨的“三白兵形态”指标也已推出(点击下方链接)。 - “三只黑乌鸦形态”指标非常适合与支撑/阻力位结合使用。 ................................................................................................................. // 优秀的交易机器人和指标可在此处获取: https://www.mql5.com/en/users/def1380/seller 这是仅在 MQL5 网站上提供的原创产品。

适用于 MT4 的 Crypto_Forex 指标“HTF 布林带”。
- 使用适用于 MT4 的专业指标“HTF 布林带”升级您的交易方法。HTF 代表“更高时间框架”。 - 布林带是市场上最优秀的指标之一,是完美的交易工具。 - 大约 90% 的价格波动发生在两个布林带之间。 - HTF 布林带指标非常适合用于多时间框架交易系统,可设置价格波动入场点,或与其他指标结合使用。 - 此指标允许您将更高时间框架的布林带附加到您当前的图表中。 ................................................................................................................. // 优秀的交易机器人和指标可在此处获取: https://www.mql5.com/en/users/def1380/seller 这是仅在 MQL5 网站上提供的原创产品。
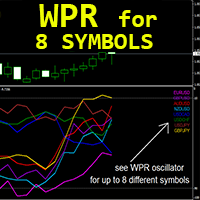
适用于 MT4 的“8 个交易品种 WPR”外汇指标,无需重绘。
- WPR 本身是最佳的剥头皮震荡指标之一。 - 它非常适合在强超买区域(高于 -10)进行卖出入场,并在强超卖区域(低于 -90)进行买入入场。 - “8 个交易品种 WPR” 让您能够在一张图表上控制多达 8 个不同交易品种的 WPR 值。 - 该指标也非常适合与超卖/超买区域的价格行动入场相结合。 ................................................................................................................. // 优秀的交易机器人和指标可在此处获取: https://www.mql5.com/en/users/def1380/seller 这是仅在 MQL5 网站上提供的原创产品。
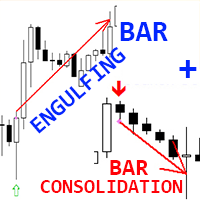
Crypto_Forex 指标“吞噬条和盘整条”形态适用于 MT4。
- “吞噬条和盘整条”形态对于价格行为交易非常有效。 - 指标可检测图表上的吞噬条和盘整条: - 看涨吞噬条形态 - 图表上显示绿色箭头信号。 - 看跌吞噬条形态 - 图表上显示橙色箭头信号。 - 看涨盘整条形态 - 图表上显示蓝色箭头信号。 - 看跌盘整条形态 - 图表上显示红色箭头信号。 - 无需重绘,无延迟,盘整条形态本身具有较高的 R/R 比率(回报/风险)。 - 提供 PC、移动端和电子邮件提醒。 - “吞噬条和盘整条”形态非常适合与支撑位/阻力位结合使用。
// 优秀的交易机器人和指标可在此处获取: https://www.mql5.com/en/users/def1380/seller 这是仅在 MQL5 网站上提供的原创产品。

FullScalping 是一个 不重绘、不回绘 的指标,专为在任何市场中生成 持续不断的剥头皮入场信号 而设计。非常适合喜欢高速交易、追求刺激的激进型交易者!
请查看指标频道,获取最新资讯和更新内容。: https://www.mql5.com/en/channels/forexnewadvisor 你会发现它 几乎每根K线 都会给出信号,不是确认趋势,就是标记关键的回调点。就像一个随时为你导航的雷达。
它是如何工作的?超级简单: 红色箭头 做 卖出交易 。 蓝色箭头 做 买入交易 。 你将始终顺应大趋势交易,激进捕捉每笔 15到20点 的利润,并在市场反转前迅速退出。
信号 持续稳定 ,让你永远不会等待太久。目标是利用以下条件执行 高效剥头皮操作 : 高手数下单 低点差(显示在左下角) 宽止损,设置在最近一次趋势变化的位置 你可以查看 实盘交易视频 了解它的实际表现,但说真的,它非常简单,你可以立刻上手使用。 FullScalping 不是用来看着的 —— 它是用来 实战 的。如果你是那种快进快出
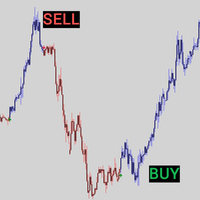
Special offer! https://www.mql5.com/ru/users/bossik2810 Arrow Candle - These are colored candles that show the trend based on volume and trend slope. This indicator will show you the color change on the next bar of the confirmation candle. Blue candles = possible buy (volume is increasing), Red candles = bullish weakness (volume is decreasing) possible sell. Arrow Candle is optimized for trading in any market and can be used in trending and non-trending markets. The Super Multiplier parameter
FREE

市场交易时段指标 全球市场交易时段可视化的必备工具 市场交易时段指标是一款强大的MT4工具,旨在帮助交易者在图表上直观显示主要外汇市场交易时段。通过清晰展示悉尼、东京、伦敦和纽约市场的活跃交易时间,这一指标帮助您识别最佳交易时段并了解市场波动模式。 主要特点: 清晰显示四个主要交易时段(悉尼、东京、伦敦、纽约) 用彩色垂直线标记时段的开始和结束时间 每个市场时段可自定义颜色 可调整的线条样式和宽度,提高可视性 时段标签位于图表底部,便于快速参考 自动或手动GMT时差计算 完全可自定义的时段时间 优势: 轻松识别时段重叠,通常在这些时段市场波动性增加 根据特定市场时间规划交易 了解哪些金融中心正在驱动当前价格走势 基于历史时段表现优化交易策略 适合初学者和经验丰富的交易者使用 该指标适用于任何时间框架和货币对,是每位希望将交易与全球市场时间保持一致的外汇交易者的必备工具。
FREE
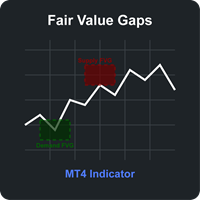
Fair Value Gaps (FVG) Indicator for MT4 The Fair Value Gaps (FVG) Indicator is a powerful technical analysis tool designed to identify and visualize significant price imbalances in the market. These gaps, created when price makes a strong directional move, represent areas where price has moved so quickly that no trading activity occurred, potentially indicating institutional interest and strong market momentum. Key Features: Dual Gap Detection : Automatically identifies both Supply FVGs (bearish
FREE
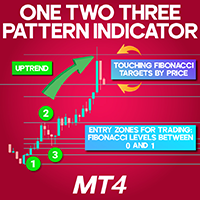
1-2-3 Pattern Indicator for MetaTrader 4
The 1-2-3 Pattern Indicator for MetaTrader 4 is a sophisticated technical tool designed to identify potential market reversals. It highlights three significant turning points, connecting them with a ZigZag pattern to visually map the price trajectory. Once the formation is complete, the indicator automatically generates Fibonacci retracement levels between the first two points to assist with trade planning. «Indicator Installation & User Guide»
MT4 Indi
FREE

iMRPHN: Supertrend & Swing Reversal Indicator A trading indicator that integrates Supertrend zone detection with swing-based entry logic. Designed for traders who apply both trend-following and counter-trend approaches. The indicator works across multiple timeframes and offers several helpful visual and alert-based features. Key Features: Automatic identification of swing high and swing low levels Automatic Fibonacci retracement Supertrend reversal zone visualization in real-time Highlights are
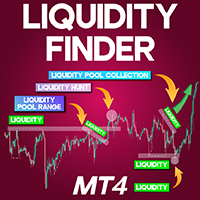
Liquidity Finder Indicator MT4
The Liquidity Finder Indicator MT4 is a powerful tool integrated into MetaTrader 4 (MT4) that assists traders in detecting zones of high liquidity concentration. This indicator automatically highlights both dynamic (angled) and static (horizontal, dotted) trend lines, offering insight into areas where price is likely to react. Static lines often align with significant chart patterns like Double Tops or Double Bottoms, acting as key markers for potential liquidity z
FREE
123456789101112131415161718192021222324252627282930313233343536373839404142434445464748495051525354555657585960616263646566676869707172737475767778798081828384858687888990919293949596979899100101102103104105106107108109110111112113114115116117118119120121122123124125126127128129130131132133134135136137138139140141142143144145146147148149
MetaTrader市场提供了一个方便,安全的购买MetaTrader平台应用程序的场所。直接从您的程序端免费下载EA交易和指标的试用版在测试策略中进行测试。
在不同模式下测试应用程序来监视性能和为您想要使用MQL5.community支付系统的产品进行付款。
您错过了交易机会:
- 免费交易应用程序
- 8,000+信号可供复制
- 探索金融市场的经济新闻
注册
登录