YouTubeにあるマーケットチュートリアルビデオをご覧ください
ロボットや指標を購入する
仮想ホスティングで
EAを実行
EAを実行
ロボットや指標を購入前にテストする
マーケットで収入を得る
販売のためにプロダクトをプレゼンテーションする方法
MetaTrader 4のための新しいテクニカル指標
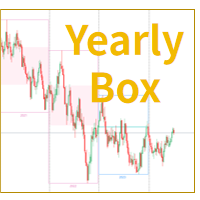
MT4の年次ローソク足ボックスインジケータ
MetaTrader 4プラットフォーム上の「年次ローソク足ボックス」インジケータは、1年間の価格動向を矩形ボックス内に直観的に表示するチャート分析ツールです。このインジケータは価格範囲を枠で囲み、背景を着色することで、年次の始値と終値を際立たせます。トレーダーは一目で年次の価格変動を識別し分析することができ、年次ローソク足ボックスインジケータを使用して市場の年次トレンドやパターンを明確に把握できます。このインジケータは年次データを簡潔かつ直感的に視覚化し、歴史的な価格動向に基づいて賢明な決定を支援します。裸のトレーダーであろうとトレンドトレーダーであろうと、「MT4の年次ローソク足ボックスインジケータ」は非常に有用なアシスタントです。
- 通貨ペア、暗号通貨、指数、金、原油など、さまざまな製品で表示できます。 - 異なる時間軸に対してカスタマイズ可能な表示が可能です。 - 年次ローソク足ボックス、陽線、陰線の色をカスタマイズできます。 - 各年の下に、対応する年の数字が表示されます。 - 年次のローソク足を比較することで、トレーダ
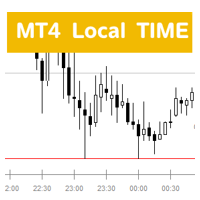
ローカルタイムインジケーターの説明 ( MT4 Local Time H4box )
概要 ローカルタイムインジケーターは、MetaTrader 4 (MT4) プラットフォーム用に設計されたカスタムインジケーターであり、ユーザーの地域の現在のローカルタイムを提供することを目的としています。このインジケーターは、世界中のトレーダーに適しており、外国為替取引を行う際にローカルタイムを迅速に確認できるようにし、市場の動向や取引機会をよりよく把握できるようにします。また、インジケーターには、4時間内のKラインの変動を簡単に確認できるオプションのH4ボックスが含まれています。
機能 - **リアルタイムのローカルタイム表示:** インジケーターはリアルタイムで更新され、ユーザーのコンピュータのローカルタイムを表示することができ、情報の正確性を保証します。 - **高い適応性:** ユーザーがどのタイムゾーンにいても、手動で調整して対応するローカルタイムを表示できるため、時差による誤解を避けることができます。 - **視覚的表示:** ローカルタイムは、グラフ上に明確で読みや
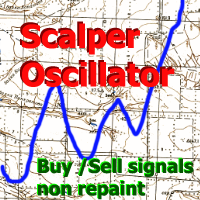
An analytical tool designed for carrying out trading transactions.
The indicator analyzes momentum volatility and volumes to identify potential signals.
Contains a trend detection system that filters out market noise.
The indicator algorithm generates signals when specified levels are crossed within trend frames.
Possibilities
Works on any time frames and trading instruments (forex, cryptocurrencies, metals, stocks, indices.) Simple visual reading of information without loading a chart T

-AUDUSD M15 - Every time there is any crossing of the RED lines , it means sell. - Every time there is any crossing of the GREEN lines , it indicates buy.
Discover the Future of Trading with Our Exclusive Indicator! In the dynamic world of financial markets, precision and the ability to anticipate movements are crucial for success. With this in mind, we have developed an exclusive indicator that combines cutting-edge technology with a sophisticated approach to offer you an indispensable to

Heiken Ashi Histo Filter は、優れた効率的な補助取引ツールです。
高度な新しい計算方法を使用 - パラメーター「計算価格」の 10 のオプション プライス アクション パターンと組み合わせるのに最適です 緑色のヒストグラム - 強気のエントリーを探します マゼンタ色のヒストグラム - 弱気のエントリーを探します このインジケーターを使用すると、標準戦略をアップグレードする機会が十分にあります インジケーターには、モバイル、PC、および電子メール アラートが組み込まれています
// より優れたエキスパート アドバイザーとインジケーターは、こちらで入手できます: https://www.mql5.com/en/users/def1380/seller // また、収益性が高く、安定していて信頼性の高いシグナルに参加することもできます https://www.mql5.com/en/signals/1887493 これは、この MQL5 Web サイトでのみ提供されるオリジナル製品です

MT4 用 Forex インジケーター INSIDE バー パターン
インジケーター「INSIDE バー」は、プライス アクション トレーディングに非常に強力なインジケーターです インジケーターはチャート上の INSIDE バー パターンを検出します: 強気 INSIDE バー - チャート上の青い矢印シグナル (画像を参照) 弱気 INSIDE バー - チャート上の赤い矢印シグナル (画像を参照) 再描画なし、遅延なし。高い R/R 比率 (報酬/リスク) PC、モバイル、メールアラートが含まれています インジケーター「INSIDE Bar Pattern」は、サポート/レジスタンスレベルと組み合わせるのに最適です: https://www.mql5.com/en/market/product/100903
// より優れたエキスパートアドバイザーとインジケーターは、こちらで入手できます: https://www.mql5.com/en/users/def1380/seller // また、収益性が高く、安定していて信頼性の高いシグナルに参加することもできます https
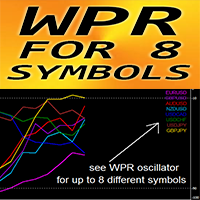
MT4 用 Forex インジケーター「WPR for 8 Symbols」、リペイントなし
WPR 自体はスキャルピングに最適なオシレーターの 1 つです 強い OverBought ゾーン (-10 以上) から売りエントリーを取り、強い OverSold ゾーン (-90 以下) から買いエントリーを取るのに最適です 「WPR for 8 Symbols」を使用すると、1 つのチャートで最大 8 つの異なるシンボルの WPR 値を制御できます このインジケーターは、OverSold/Bought 領域からの価格アクション エントリーと組み合わせるのにも最適です。
// より優れたエキスパート アドバイザーとインジケーターは、こちらで入手できます: https://www.mql5.com/en/users/def1380/seller // また、収益性が高く、安定していて信頼性の高いシグナルに参加することもできます https://www.mql5.com/en/signals/1887493 これは、この MQL5 Web サイトでのみ提供されるオリジナル製品です。

Our new indicator is an important part of the Smart Money Concepts (SMC) system
It uses a modern market vision and fast calculation methods. As a result, the trader has a complete picture of the trade at every moment in time, which makes the process of obtaining results easier and faster.
Our new indicator displays the following important patterns:
Order Blocks. Imbalance – Fair Value Gap (FVG). Break Of Structures (BoS). Change of character (CHoCH). Equal highs & lows. Premium , Equili
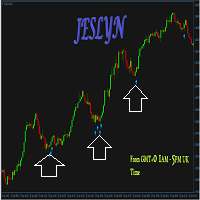
This indicator is the MT4 version based on the MT5 indicator of JES-USDJPY which is used and optimized for USDJPY currency pair. Other currency pairs have similarly optimized software for each currency pair, since they all behave differently even though some pairs share a bit of correlation.
Extensive tests, settings, and videos are available on the MT5 version thread: https://www.mql5.com/en/forum/470202 No MT4 version of JesVersal EA for now.
https://youtu.be/V2KhpUFq8MY Forex profit te

The Accumulation/Distribution (AD) Technical Indicator is a tool used in technical analysis to determine whether an asset is being accumulated (bought) or distributed (sold) in the market. Key Characteristics of the AD Indicator: Purpose: The AD indicator is used to assess the balance between buying (accumulation) and selling (distribution) of an asset. This helps traders and investors evaluate the strength of the current trend and potential reversals. Interpretation: Rising Indicator: When the

The principle of this indicator is very simple: detecting the candlestick pattern in H1 timeframe, then monitoring the return point of graph by using the pullback of High-Low of H1 Candlestick and finally predicting BUY and SELL signal with arrows, alerts and notifications. The parameters are fixed and automatically calculated on each time frame. Example:
If you install indicator on XAUUSD, timeframe H1: the indicator will detect the reversal, pullback, price action on this timeframe (for exa
FREE

Săgețile giganților
Bun venit.
Indicatorul Arrows of Giants funcționează foarte bine pe M15, M30, H1 și H4.
Poate fi experimentat și pe M5.
Succes!
Notă Dacă indicatorul nu este afișat, adăugați indicatorul TMA+CG mladen NRP în folderul Indicatori.
Îl puteți descărca de pe linkul https://forex-station.com/app.php/attach/file/3311524
Dar lăsați-l să fie la prima descărcare.
Apoi atașați indicatorul Săgețile giganților la diagramă.
IMPORTANT! Verificați mai întâi indicatorul s
Semnale precise
Bun venit!
Indicatorul de semnale precise declanșează semnale perfecte pe intervalele de timp M15 și M30. Pe H1 la fel, dar semnalele sunt mai rare.
De asemenea, funcționează foarte bine pe M5 și chiar pe M1.
Noroc!
Notă Dacă indicatorul nu este afișat, adăugați indicatorii TMA+CG mladen NRP și TDI Red Green (mtf + alerte + săgeți) în folderul Indicatori.
Le puteți descărca de pe linkurile https://forex-station.com/app.php/attach/file/3311524 și TDI Red Green (mtf +

Predator Indicator - M5
Bun venit.
Predator Indicator - M5 este creat pentru intervalul de timp M5, după cum sugerează și numele.
Este un indicator scalping.
Videoclipul arată că a funcționat foarte bine pe EURUSD M5 și nu revopsește.
Succes!
Notă Dacă indicatorul nu este afișat, adăugați indicatorul TMA+CG mladen NRP în folderul Indicatori.
Îl puteți descărca de pe linkul https://forex-station.com/app.php/attach/file/3311524
Dar lăsați-l să fie la prima descărcare.
Apoi atașa

Features:
Get OB/OS Levels from Golden MA Levels Wait for Buy/Sell Start Level Cross Optional: Should price cross Mid Level in earlier bars Optional: Crossing bar High/Medium Volume Optional: MA Stacked to check up/down trend for current TF Optional: NRTR higher timeframes aligned Check
Detailed blog post explained: https://www.mql5.com/en/blogs/post/758457
Levels with Buffers available here: Golden MA Levels Indicator: https://www.mql5.com/en/market/product/119515 Note: Arrows/Scanner do
FREE

Determining the current trend is one of the most important tasks of a trader, regardless of the trading style. The Creative Trend indicator will help you do this with a fairly high probability. Creative Trend is a trend recognition indicator that uses the author's calculation algorithm. The indicator readings do not change under any conditions. The indicator is suitable for any currency pair, any timeframe, as long as there is enough historical data for calculations. Indicator Parameters
Main S
Semnal SOS
Indicatorul de semnal SOS funcționează foarte bine pe intervalele de timp H1, M30, M15. Poate fi încercat și pe intervalele M5, M1.
Studiu!
Succes!
Notă Dacă indicatorul nu este afișat, adăugați indicatorii TMA+CG mladen NRP și TDI Red Green (mtf + alerte + săgeți) în folderul Indicatori.
Le puteți descărca de pe linkurile https://forex-station.com/app.php/attach/file/3311524 și TDI Red Green (mtf + alerte + săgeți).mq4 (forex-station.com) .
Dar lăsați-le să fie la prima

M5 Omicron
Bună ziua!
Indicatorul M5 Omicron este creat special pentru M5. Este un indicator complex. Poate fi încercat și pe M1.
Noroc!
Notă Dacă indicatorul nu este afișat, adăugați indicatorii TMA+CG mladen NRP și TDI Red Green (mtf + alerte + săgeți) în folderul Indicatori.
Le puteți descărca de pe linkurile https://forex-station.com/app.php/attach/file/3311524 și TDI Red Green (mtf + alerte + săgeți).mq4 (forex-station.com) .
Dar lăsați-le să fie la prima descărcare.
Apoi ata
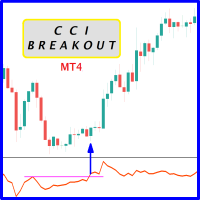
Probability emerges to record higher prices when CCi oscillator breaks out oscillator historical resistance level when exhibit overbought values. Since, oscillator breakout of support and resistance have similar effect as price breaks support and resistance levels, therefore, its highly advised to confirm price breakout with oscillator breakout; certainly, will have the same output in short trades. Concept is based on find swing levels which based on number of bars by each side of peak or trough
FREE
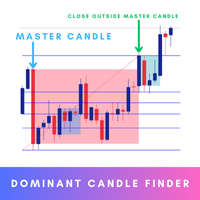
Dominant Candle Finder is a significant candlestick on a price chart that stands out due to its size, volume, or price movement compared to surrounding candles. It often indicates strong buying or selling pressure and can be used to identify potential reversal points, breakouts, or continuations in the market. Dominant candles can serve as key indicators for traders to make informed decisions, providing insights into market sentiment and potential future price movements. MT5 Version - https:

I made this RSI Indicator into multi time frame monitoring to monitor the occurrence of OverBuy and OverSell in real time on one monitor screen. My hope is that this indicator can help friends in the analysis process and also take trading moments with the system that friends have If this indicator is useful, friends can help me by giving likes to my channel and 5 stars on this indicator
Indicator RSI ini saya buat menjadi multi time frame monitoring untuk memantau terjadi nya OverBuy dan
FREE

Scalping M5
Indicatorul M5 Scalping este creat pentru intervalul de timp M5. Poate fi încercat și pe alte intervale de timp.
Este un indicator scalping.
Markerul nu revopsește și dă rezultate bune. Semnalele sunt rare, dar pot fi utilizate pe mai multe perechi.
Succes!
Notă Dacă indicatorul nu este afișat, adăugați indicatorul TMA+CG mladen NRP în folderul Indicatori.
Îl puteți descărca de pe linkul https://forex-station.com/app.php/attach/file/3311524
Dar lăsați-l să fie la prima
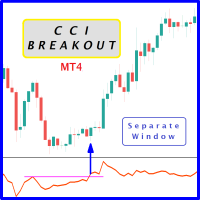
Probability emerges to record higher prices when Commodity Channel Index breaks out oscillator historical resistance level when exhibit overbought values. Since, oscillator breakout of support and resistance have similar effect as price breaks support and resistance levels, therefore, its highly advised to confirm price breakout with oscillator breakout; certainly, will have the same output in short trades. Concept is based on find swing levels which based on number of bars by each side of peak
FREE
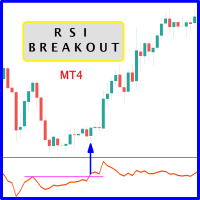
When prices breakout resistance levels are combined with Relative Strength Index "RSI" oscillator breaks out its historical resistance levels then probability emerges to record farther prices. It's strongly encouraged to confirm price breakout with oscillator breakout since they have comparable effects to price breaking support and resistance levels; surely, short trades will have the same perception. Concept is based on find swing levels which based on number of bars by each side to confi
FREE

When prices breakout resistance levels are combined with Larry Williams' Percentage Range "WPR" oscillator breaks out its historical resistance levels then probability emerges to record farther prices. It's strongly encouraged to confirm price breakout with oscillator breakout since they have comparable effects to price breaking support and resistance levels; surely, short trades will have the same perception. Concept is based on find swing levels which based on number of bars by each side
FREE
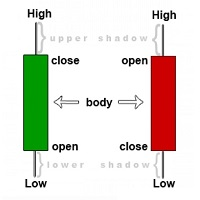
The indicator searches for candles on the price chart that are larger than those specified in the settings and marks them on the chart.
You can choose two types of candle size measurement (Units of Calculation): Points and Percentages. Points - size calculation will be in points. (for a five-digit quote point = 0.00001 and similarly for others)
Percentages - the candle size will be calculated as a percentage. You can also choose between which values to measure (Between Levels):
High/L

This indicator is based on the Cboe EuroCurrency Volatility Index, also known as Euro VIX and has a ticker symbol of EVZ . It basically measures volatility in the Eur/USD exchange rate but it can be used to track overall volitility in the Forex market. It's best usage is to add it to your system as a mandatory tool, when the value is above 7, you can expect some movement in the market, so you can trade at full risk, when the value is below 7, you trade with less risk or don't trade at all.

Moving Pivot Average The pivot indicator compares the selected period with its counterpart from the previous period. The indicator uses very flexible algorithm for pivot value calculating. It allows you to allocate in days a certain time intervals (custom bars) and calculate the average pivot value based on High, Low and Close prices of these bars. How many custom bars will be taken into account is determined by the "Days" setting. The pivot line can be considered an average trend line and us
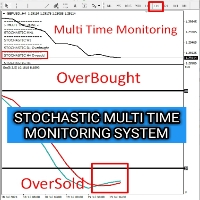
I made this Stochastic Indicator into multi time frame monitoring to monitor the occurrence of OverBuy and OverSell in real time on one monitor screen. My hope is that this indicator can help friends in the analysis process and also take trading moments with the system that friends have If this indicator is useful, friends can help me by giving likes to my channel and 5 stars on this indicator
Indicator Stochastic ini saya buat menjadi multi time frame monitoring untuk memantau terjadi nya
FREE

When prices breakout resistance levels are combined with Larry Williams' Percent Range oscillator "WPR" breaks out its historical resistance levels then higher chances emerges to record farther prices. It's strongly encouraged to confirm price breakout with oscillator breakout since they have comparable effects to price breaking support and resistance levels; certainly short trades will have the same perception. Concept is based on find swing levels which based on number of bars by each side to
FREE
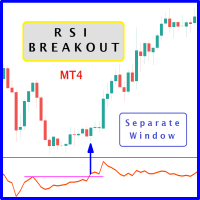
When prices breakout resistance levels are combined with Relative Strength Index oscillator "RSI" breaks out its historical resistance levels then higher chances emerges to record farther prices. It's strongly encouraged to confirm price breakout with oscillator breakout since they have comparable effects to price breaking support and resistance levels; certainly short trades will have the same perception. Concept is based on find swing levels which based on number of bars by each side to confir
FREE

Pipwise Indicators Multiple MAs Intro Please Note, this is a simpler version of the much more powerful version which you can find here: https://www.mql5.com/en/market/product/119947?source=Unknown The Pipwise Indicators Moving Averages indicator is a powerful tool for technical analysis in MetaTrader 4 (MT4). It allows traders to visualize and analyze moving averages from multiple periods on a single chart. Here are the key features:
Customizable Moving Averages: Traders can choose the numbe
FREE
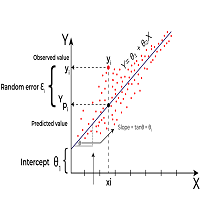
Linear Regression is a statistical method used to model the relationship between two or more variables. The primary goal of Linear Regression is to predict the value of one variable (called the dependent variable or outcome variable) based on the value of one or more other variables (called independent variables or explanatory variables) Linear Regression can be applied to technical analysis, and it is indeed one of the tools used by traders and analysts to make predictions and identify trends i
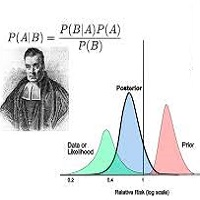
Bayesian methods can be effectively applied to predict price trends in financial markets, including Forex, stocks, and commodities. Here’s how Bayesian techniques can be used for trend prediction: 1. Bayesian Linear Regression Bayesian linear regression can be used to model the relationship between time and price. This method allows for the incorporation of prior beliefs about the trend and updates the trend as new data comes in. Example: Suppose you want to predict the price trend of a curren

Advance Currency Meter is a currency meter that detects strong market trends. This indicator is good for scalping, intraday trading and swing trading. The indicator will detect short term to long term market trends. This will give you good insight which currencies are best to trade as of the moment.
Note : Kindly contact me before you make any purchases. Works well with my MACD Currency Strength Meter
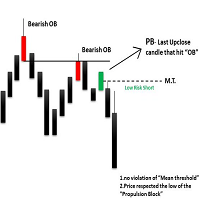
The ICT Propulsion Block indicator is meant to detect and highlight propulsion blocks, which are specific price structures introduced by the Inner Circle Trader (ICT).
Propulsion Blocks are essentially blocks located where prices interact with preceding order blocks. Traders often utilize them when analyzing price movements to identify potential turning points and market behavior or areas of interest in the market.
USAGE (fingure 1) An order block is a significant area on a pric

It is an indicator which notifies via push notification when an order is closed by Take Profit/Stop Loss It indicates via pc alert and or mobile alert Psychologically you can hold order for long time If stop loss hunting happens you can re-enter with same direction If real break out happens you can reverse the position Overall it Alerts when position reach stop - loss or take-profit level
FREE
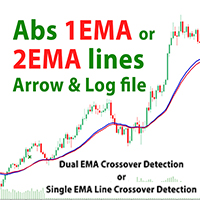
Product: 1 or 2 EMA Lines Crossover Indicator The 2 EMA Lines Crossover Indicator is a powerful and versatile tool designed for MetaTrader 4 (MT4) that helps traders identify potential buy and sell signals based on the crossover of two Exponential Moving Averages (EMAs). This indicator provides visual arrows on the chart to highlight trading opportunities, and it can also log these signals for further analysis. Whether you're a beginner or an experienced trader, this indicator can enhance your t

- Real price is 60$ - 50% Discount ( It is 30$ now )
Contact me for instruction, any questions! Introduction Triangle chart patterns are used in technical analysis , which is a trading strategy that involves charts and patterns that help traders identify trends in the market to make predictions about future performance.
Triangle Pattern Scanner Indicator It is usually difficult for a trader to recognize classic patterns on a chart, as well as searching for dozens of charts and tim

Contact me for instruction, any questions! Introduction Chart patterns are an essential tool traders and investors use to analyze the future price movements of securities. One such pattern is the triple bottom or the triple top pattern, which can provide valuable insights into potential price reversals. This pattern forms when a security reaches a low price level three times before reversing upward or reaches a high price level three times before reversing downward.
Triple Top Bottom
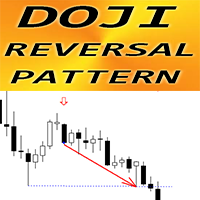
MT4 用 Forex インジケーター「Doji Reversal pattern」
インジケーター「Doji Reversal pattern」は純粋なプライスアクション取引です。再描画や遅延はありません。 インジケーターは、チャート上で同点反転パターンを検出します。同点ローソク足はパターンの中央にあり、最後のローソク足はブレイクアウトです。 強気同点反転パターン - チャート上の青い矢印シグナル (画像を参照) 弱気同点反転パターン - チャート上の赤い矢印シグナル (画像を参照) PC、モバイル、および電子メールアラートが含まれています インジケーター「同点反転パターン」は、サポート/レジスタンスレベルと組み合わせるのに適しています: https://www.mql5.com/en/market/product/100903
// より優れたエキスパートアドバイザーとインジケーターは、こちらで入手できます: https://www.mql5.com/en/users/def1380/seller // また、収益性が高く、安定的で信頼性の高いシグナルに参加することもでき
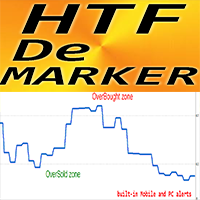
MT4 用 Forex インジケーター HTF DeMarker
このインジケーターは、テクニカル トレーダーがエントリー ポイントとエグジット ポイントを見つけるために使用する便利なツールです。HTF は、Higher Time Frame を意味します。 DeMarker オシレーター ラインは、以前の高値と安値に対する現在の価格位置を示します。 DeMarker は、他のオシレーターの中で最も効率的な定期的なダイバージェンス シグナルを提供します。 買われすぎゾーンは DeMarker が 0.7 を超える場合、売られすぎゾーンは 0.3 を下回る場合です。 インジケーターにはモバイルおよび PC アラートが組み込まれています。 このインジケーターは、プライス アクション エントリーを使用するマルチタイム フレーム トレーディング システム、または他のインジケーターとの組み合わせに最適です。 HTF DeMarker インジケーターを使用すると、より高い時間枠の DeMarker を現在のチャートに添付できます --> これはプロフェッショナルな取引アプローチです
//
The CandlestickPatterns indicator for MetaTrader 4 (MT4) is a comprehensive tool designed to identify and highlight key candlestick patterns on trading charts. This highly customizable indicator allows traders to choose which patterns to display and how to present them, enhancing their ability to make informed trading decisions based on technical analysis. Features Customizable Candlestick Patterns The indicator identifies 12 major candlestick patterns, both bullish and bearish. Users can enable

Vega indicator
The indicator is created for M1.
Rare and safe signals.
Success!
Notă Dacă indicatorul nu este afișat, adăugați indicatorul TMA+CG mladen NRP în folderul Indicatori.
Îl puteți descărca de pe linkul https://forex-station.com/app.php/attach/file/3311524
Dar lăsați-l să fie la prima descărcare.
Apoi atașați indicatorul Vega la diagramă.
IMPORTANT! Verificați mai întâi indicatorul sau expertul pe un cont DEMO, înainte de a-l cumpăra! Analizați-l bine!
Închiriați-l

HURRY! The offer price of $75 is ACTIVE ONLY for the FIRST 5 PURCHASES, after which the price will increase to $129. William Delbert Gann, commonly known as W.D. Gann, was an exceptional market analyst renowned for his unique trading style in the early 20th century. His trading techniques were based on a blend of mathematics, geometry, astrology, and ancient mathematics. Gann believed that stock market movements followed specific patterns and cycles, rather than being random. His methodologies

SMT (Smart Money Technique) Divergence refers to the price divergence between correlated assets or their relationship to inversely correlated assets. By analyzing SMT Divergence, traders can gain insights into the market's institutional structure and identify whether smart money is accumulating or distributing assets. Every price fluctuation should be confirmed by market symmetry, and any price asymmetry indicates an SMT Divergence, suggesting a potential trend reversal. MT5 Version - https:/

GoTrend Multi-Timeframe インディケーター "GoTrend Multi-Timeframe" インディケーターは、異なる時間枠で通貨ペアの全体的および特定のトレンドを迅速かつ効率的に評価するためのトレーダーにとって必須のツールです。 このインディケーターは、トレーダーが市場の方向性を一目で明確かつ包括的に把握し、意思決定を最適化し、取引戦略の効果を高めることを可能にします。 主な特徴: マルチタイムフレーム分析: このインディケーターは、M5、M15、M30、H1、H4、D1の6つの異なる時間枠の詳細な分析を提供し、トレーダーが各期間のトレンドを理解できるようにします。 統合されたテクニカル指標: インディケーターは、RSI、SAR、MA、MACD、およびADXの5つの強力なテクニカル指標を使用して、各時間枠でのトレンド方向を決定します。 明確で直感的な視覚化: 信号は、直感的なシンボルと色でメインチャートの選択したコーナーに表示されます。これにより、トレーダーは一目で市場の状況を評価できます。 組み合わせ信号: 各指標の個別の信号に加えて、"GoTrend M

MT4 用 Forex インジケーター HTF 一目均衡表
一目均衡表は、最も強力なトレンド インジケーターの 1 つです。HTF は、Higher Time Frame を意味します。このインジケーターは、トレンド トレーダーや、プライス アクション エントリとの組み合わせに最適です。 HTF 一目均衡表を使用すると、Higher Time Frame の 一目均衡表を現在のチャートに添付できます。 上昇トレンド - 赤い線が青い線より上(両方の線が雲より上)/ 下降トレンド - 赤い線が青い線より下(両方の線が雲より下) 価格が一目均衡表の雲の上限を突破した場合にのみ買い注文をオープンします 価格が一目均衡表の雲の下限を突破した場合にのみ売り注文をオープンします HTF 一目均衡表インジケーターは大きなトレンドを捉える機会を提供します
// より優れたエキスパートアドバイザーとインジケーターは、こちらで入手できます: https://www.mql5.com/en/users/def1380/seller // また、収益性が高く、安定的で信頼性の高いシグナルへの参加も歓
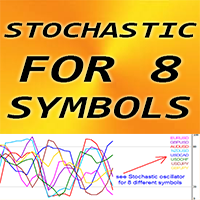
MT4 用 Forex インジケーター「8 シンボルのストキャスティクス」
ストキャスティクス オシレーターは市場で最も優れたインジケーターの 1 つであり、多くのトレーダーにとって最適なツールです。
買われすぎゾーン - 80 以上、売られすぎゾーン - 20 以下 80 以上のゾーンから売りエントリーを取り、20 以下から買いエントリーを取るのに最適です
「8 シンボルのストキャスティクス」を使用すると、1 つのチャートで最大 8 つの異なるシンボルのストキャスティクス値を制御できます このインジケーターは、プライス アクション エントリーと組み合わせるのにも最適です。
// より優れたエキスパート アドバイザーとインジケーターは、こちらで入手できます: https://www.mql5.com/en/users/def1380/seller // また、収益性が高く、安定していて信頼性の高いシグナルに参加することもできます https://www.mql5.com/en/signals/1887493 これは、この MQL5 Web サイトでのみ提供されるオリジ
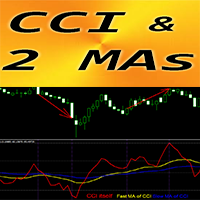
MT4 用 Forex インジケーター「CCI と 2 つの移動平均」
コモディティ チャネル インデックス (CCI) は、トレンド方向へのモメンタム トレーディングに最適です。 「CCI と 2 つの移動平均」インジケーターを使用すると、CCI インジケーターの高速移動平均と低速移動平均を確認できます 上昇トレンド - 高速 MA が低速 MA を上回ります。下降トレンド - 高速 MA が低速 MA を下回っています CCI は、取引で最も人気のあるオシレーターの 1 つです - 現在の価格と過去の平均価格の差を測定します オプション 1 - 50 から -50 の値の中心領域からトレンド方向にトレードを開始し、インジケーターがそれぞれ 200/-200 の領域に到達したら終了します 重要なレベル: +/-200、オプション 2 - +200 ゾーンより上から売りエントリーを取り、-200 より下からトレンド方向に買いエントリーを取ります インジケーターにより、トレンドの変化を非常に早い段階で確認する機会が得られます // より優れたエキスパート アドバイザーとインジケータ

Tired of navigating the sea of uncertainties in the financial market? Imagine having an experienced guide by your side, helping you decipher the mysteries of charts and leading you confidently toward financial success. With StakBank, you'll have more than just a simple indicator in your hands. You'll have a complete arsenal of tools to make assertive and profitable decisions. But what makes StakBank so special? Volume: Understand the driving force behind market movements, accurately identifying

The principle of this indicator is very simple: detecting the candlestick pattern in M30 timeframe, then monitoring the return point of graph by using the pullback of High-Low of M5 Candlestick and finally predicting BUY and SELL signal with arrows, alerts and notifications. The parameters are fixed and automatically calculated on each time frame. Example:
If you install indicator on XAUUSD, timeframe M5: the indicator will detect the reversal, pullback, price action on this timeframe (for ex
FREE

Volume Profile Indicator for MT4 Gain a trading edge with the "Volume Profile" indicator for MetaTrader 4 (MT4). This advanced technical analysis tool allows you to precisely identify key support and resistance levels based on transaction volume. Easily visualize market areas of high interest, where trading volumes are highest, and use this information to make more informed trading decisions. Key Features: Clear and detailed visualization : The indicator displays volume histograms directly on th
Presentation of the "Color Range Indicator" The "Color Range Indicator" is a powerful technical analysis tool designed for the MT4 platform, perfect for traders who want a clear and immediate view of market trends. This indicator draws a colored line based on the current trend, making it easier to interpret price movements. Indicator Description: Green line : Indicates an uptrend. Use this signal to consider buying opportunities. Red line : Indicates a downtrend. Use this signal to consider sell

The Accelerator Oscillator (AC) technical indicator measures the acceleration or deceleration of the current market strength. It is designed to identify potential trend reversal points and is used to determine the moment of buying or selling assets. The indicator helps traders make decisions based on changes in market dynamics. This implementation of the indicator is its creative version. Since the standard version is very limited by its built-in settings, this implementation has significantly
Semnal M1 fără pierderi A
Indicatorul este creat pentru M1.
Semnalele sunt relativ rare, dar de bună calitate.
Succes!
Notă Dacă indicatorul nu este afișat, adăugați indicatorul TMA+CG mladen NRP în folderul Indicatori.
Îl puteți descărca de pe linkul https://forex-station.com/app.php/attach/file/3311524
Dar lăsați-l să fie la prima descărcare.
Apoi atașați semnalul M1 fără pierderi la diagramă.
Mi-am creat indicatorul folosind indicatorul TMA+CG mladen NRP, creat de domnul Mlad
This indicator is a classic indicator of technical analysis - MACD. Unlike the classic MACD indicator, the presented indicator is calculated as follows: - the first smoothing signal is one of the standard methods used to create moving averages. - secondary smoothing method used in MAMA/FAMA indicators. - calculation of the difference between MAMA/FAMA values.
The indicator gives signals about a change in trend direction, as well as signals about weakening or strengthening of the trend. The ind
FREE
Darvas Flow is a revolutionary trading indicator that combines the classic Darvas Box method with modern market flow analysis. Developed for serious traders, Darvas Flow offers a powerful and intuitive tool for identifying trading opportunities. Key Features: Darvas Box Method Implementation : Darvas Flow automatically identifies Darvas boxes, allowing you to see crucial support and resistance levels. This helps in pinpointing optimal entry and exit points in your trades. Dynamic Flow Analysis :
FREE

Trend oscillator indicator for tracking microtrends and pullbacks. Determines even a minor change in trend . Allows you to open positions in a timely manner in accordance with market changes. Works on all timeframes, all currency pairs, metals, indices and cryptocurrencies. Can be used when working with binary options. Distinctive features Does not redraw after the candle closes; Accurately detects trend changes; Simple and clear setup; Works on all timeframes and all trading instruments; Suit

Similar to logic used in: Golden MA MTF TT Overview
"Golden MA" indicator for OB/OS levels. It's based on High/Lows of higher timeframe (HTF) previous bar. Only useful in swing trading or scalping. Best for at least M15+. For lower timeframes you'll need to change StartPips to lower value to get consistent lines. Because lower timeframes will have smaller pip distances. Features - Define Higher Timeframes for Current Timeframe: Use a comma-separated list to define the higher timeframe for t
FREE

The principle of this indicator is very simple: detecting the candlestick pattern in D1 timeframe, then monitoring the return point of graph by using the pullback of High-Low of D1 Candlestick and finally predicting BUY and SELL signal with arrows, alerts and notifications. The parameters are fixed and automatically calculated on each time frame. Example:
If you install indicator on XAUUSD, timeframe D1: the indicator will detect the reversal, pullback, price action on this timeframe (for exa
FREE

The author's indicator is based on automatically adjusted horizontal and inclined lines from significant market points. In the settings you can specify the period, color and thickness of the lines, disable or enable slanted lines and several other graphic settings.
Recommended rules for entering the market:
Using SELL as an example:
I place a pending order for a breakout - sell stop below the horizontal line of the indicator, then I monitor the work-out, stop loss and take profit are dete
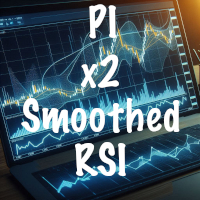
The x2 Smoothed RSI is an advanced modification of the classic Relative Strength Index (RSI) indicator. It aims to provide more reliable signals for identifying overbought and oversold market conditions. Here are the key features: Calculation : The x2 Smoothed RSI is derived from the standard RSI. It applies smoothing to the RSI oscillator, enhancing its accuracy. Smoothing Methods : The indicator uses a moving average of the RSI values. Traders can choose from various smoothing strengths C
FREE

Insight Pro is a comprehensive tool for market analysis. It offers various features such as trend analysis, resistance and support levels, and distribution analysis, suitable for both novice and experienced traders. Features Trend Analysis Detects and visualizes market trends. Suggests potential entry and exit points based on trends. Customizable trend lines for clear market direction. Displays extreme levels based on standard deviation. Positive slope indicates buy orders; negative slope indic

Pipwise Indicators Multiple MAs The Pipwise Indicators Moving Averages indicator is a powerful tool for technical analysis in MetaTrader 4 (MT4). It allows traders to visualize and analyze moving averages from multiple periods on a single chart. Here are the key features:
Customizable Moving Averages: Traders can choose the number of moving averages to plot (up to 9 MAs). Each Moving Average is customiseable.
Method Selection: The indicator supports various moving average methods, includin

Installation MetaTrader 4 Download: Download the provided file PrecisionStopDemo.ex4. Copy the File: Open MetaTrader 4. From the top menu, click on File > Open Data Folder. Navigate to MQL4 > Indicators. Copy the file PrecisionStopDemo.ex4 into this folder. Restart MetaTrader: Close and reopen MetaTrader 4. Add Indicator to Chart: In the Navigator (Ctrl+N), expand the Indicators folder. Find the indicator PrecisionStopDemo and drag it onto the desired chart.
Configuration After adding the i

Key Features: Pattern Recognition : Identifies Fair Value Gaps (FVGs) Spots Break of Structure (BOS) points Detects Change of Character (CHoCH) patterns Versatile Application : Optimized for candlestick charts Compatible with any chart type and financial instrument Real-Time and Historical Analysis : Works seamlessly with both real-time and historical data Allows for backtesting strategies and live market analysis Visual Representation : Draws rectangles to highlight significant areas on the cha
Trend Analyser Pro is a versatile trend analysis tool designed for traders who want to capitalize on market trends across multiple timeframes. This indicator combines advanced trend detection, dynamic signals, and higher timeframe analysis to provide you with a comprehensive view of market movements, empowering you to make well-informed trading decisions. 50% DISCOUNT - ENDING SOON ! BONUS - Trend Analyser Pro TradingView Indicator - After you purchase or rent this product, please send m

The AT Forex Indicator MT4 is a sophisticated trading tool designed to provide traders with a comprehensive analysis of multiple currency pairs. This powerful indicator simplifies the complex nature of the forex market, making it accessible for both novice and experienced traders. AT Forex Indicator uses advanced algorithms to detect trends, patterns and is an essential tool for traders aiming to enhance their forex trading performance. With its robust features, ease of use, and reliabl
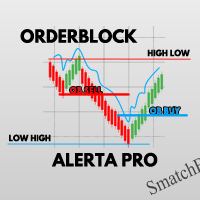
オーダーブロックプロアラート
OrderBlock ALERTA PRO は、金融市場への最適なエントリー ポイントを特定するための決定的なツールです。これを使用すると、強気または弱気の構造を打破するときに流動性が増加し始める時期を検出し、注文の理想的なバランスポイントを見つけることができます。メタトレーダーで直接プッシュ通知を受信し、常に最新情報を入手できます。
さらに、OrderBlock ALERTA PRO は、HIGH LOW (HL) および LOW HIGH (LH) ゾーンを識別し、市場がいつトレンド反転するかを知るための正確な価格を提供します。自信を持って市場に出入りするために必要な精度を手に入れましょう。
OrderBlock ALERTA PRO は、ゾーンが赤または青で塗りつぶされる飲み込みマーキングも実行し、下降トレンドまたは上昇トレンドが継続するための大きな流動性の機会を示します。
このインジケーターは、すべての外国為替金融市場ペアへのエントリーポイントを特定し、トレーディング戦略を新たなレベルに引き上げるのに不可欠です。
ご質問がござ
123456789101112131415161718192021222324252627282930313233343536373839404142434445464748495051525354555657585960616263646566676869707172737475767778798081828384858687888990919293949596979899100101102103104105106107108109110111112113114115116117118119120121122123124125126127128129130131132133134135136137138139140
MetaTraderマーケットは、開発者がトレーディングアプリを販売するシンプルで便利なサイトです。
プロダクトを投稿するのをお手伝いし、マーケットのためにプロダクト記載を準備する方法を説明します。マーケットのすべてのアプリは暗号化によって守られ、購入者のコンピュータでしか動作しません。違法なコピーは不可能です。
取引の機会を逃しています。
- 無料取引アプリ
- 8千を超えるシグナルをコピー
- 金融ニュースで金融マーケットを探索
新規登録
ログイン