适用于MetaTrader 4的新技术指标

SENSE 是一个自动系统,它将选定的 GANN 方法与分形计算相结合。系统会告诉我们在哪里开仓,在哪里平仓。无需再将时间浪费在复杂的计算上 - SENSE 会为您完成一切。只需安装指标即可。
基本原则:
当价格高于白线时,市场看涨
在白线上方买入,在白线下方止损 绿线为上涨目标 当价格低于白线时,市场看跌。
在白线下方卖出,在白线上方止损 红线为下行目标 双绿线或红线表示较强的区域。
为什么是 SENSE?
获利目标: SENSE 自动设置获利目标,帮助您最大限度地提高交易成功率。 自动适应: 该指标可自动重新计算任何时间框架,提供准确可靠的信号,无需手动调整。
非常适合剥头皮交易。
查看演示版!
SENSE 是一个自动系统,它将选定的 GANN 方法与分形计算相结合。系统会告诉我们在哪里开仓,在哪里平仓。无需再将时间浪费在复杂的计算上 - SENSE 会为您完成一切。只需安装指标即可。
基本原则:
当价格高于白线时,市场看涨
在白线上方买入,在白线下方止损 绿线为上涨目标 当价格低于白线时,市场看跌。
在白线下方卖出

轻松掌握趋势交易的力量
这个指标专为各个水平的交易者设计——无论您是新手、中级交易者,还是专业人士。它通过精准识别任意货币对的真实趋势,简化了交易过程。
为什么选择这个指标?
- 轻松交易:不再需要复杂的分析。只需将指标加载到图表上,等待买入或卖出的信号,无需整天盯盘。 - 清晰的进场信号:指标提供明确的进场点,蓝色箭头表示买入,红橙色箭头表示卖出。此外,趋势线的颜色可视化确认当前市场趋势。 - 理想的时间框架:为了获得最佳效果,建议使用5分钟时间框架。通过在H1时间框架上再次应用指标来确认您的信号,您将获得更精准的数据。 - 配备扫描仪更强大:使用我们内置的扫描仪,轻松识别所有货币对的趋势。只需留下评论,我们会免费将其发送给您。
开始更智能地交易,而不是更辛苦。让这个指标成为您在市场中的向导,帮助您轻松做出自信和及时的决策。

This indicator is not a guarantee of profitability but is designed to provide valuable insights and reduce the time spent analyzing charts, allowing you to focus on what matters most—your time.
The "Candle Info" indicator is designed to analyze and display specific candle formations directly on the chart within MetaTrader 4 (MT4). The indicator provides traders with visual cues about market sentiment by identifying various candle formations, such as Higher Highs, Lower Lows, Higher Lows, and
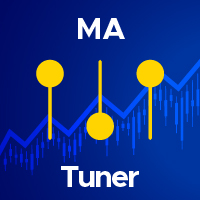
精细调整移动平均线的终极工具 这款先进的工具旨在彻底简化并优化您的移动平均线设置。借助 MA Tuner,您可以通过一个用户友好的面板轻松调整关键参数,包括周期、偏移量、计算方法和价格类型。通过这种方式,您可以即时获取详细的统计数据,了解蜡烛图与移动平均线的交互情况,包括蜡烛图穿越 MA 线的频率,以及它们相对于 MA 线的开盘价和收盘价的位置。 与标准的移动平均线指标相比,MA Tuner 提供了显著的优势。虽然它绘制的 MA 线与标准移动平均线指标相同,但 MA Tuner 让您无需每次调整周期或偏移量时都打开指标窗口。这种设计极大地提高了操作的便捷性和效率,使得您可以更加专注于交易策略的优化,而不必浪费时间在繁琐的设置调整上。MA Tuner 的功能不仅能够帮助您更好地分析市场趋势,还能在实时交易中提供及时的反馈,从而助力您的交易决策。
FREE
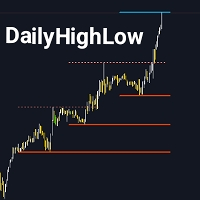
DailyHighLow 指标是专为 MetaTrader 4 (MT4) 平台设计的强大工具,旨在帮助交易者跟踪每日的价格波动。该指标可以自动绘制趋势线,基于自定义时间段内的最高价和最低价,为需要准确市场信息的交易者提供清晰的视觉辅助。 主要特点: 趋势线个性化设置: 根据您的交易偏好,调整趋势线的颜色、样式和宽度,包括破位线和未破位线。 动态更新: 自动根据最新的市场数据调整趋势线,并使用明显的视觉标记来显示破位情况。 灵活参数设置: 选择显示趋势线的天数,设置破位后趋势线的结束时间,并为最高价和最低价自定义趋势线的外观。 清晰的视觉效果: 通过不同的颜色和线条样式轻松区分破位和未破位的趋势线,使您可以一目了然地识别市场的关键水平。 此指标非常适合希望通过清晰且可自定义的趋势线来增强技术分析的交易者,无论是分析短期趋势还是长期市场动向,DailyHighLow 指标都能为您的交易策略提供宝贵的信息支持。
FREE
什么是"实时多指标"? "实时多指标" 是一款先进的交易工具,旨在简化和优化您的技术分析。这款革命性指标收集多个时间框架和技术指标的信号,并将它们显示在一个清晰易读的表格中。如果您希望在不必不断切换图表或手动分析每个指标的情况下获得完整和详细的市场视图,"实时多指标" 是您的理想解决方案。 为什么选择"实时多指标"? 多时间框架分析: "实时多指标" 允许您同时监控多个时间框架的市场。从M15到H4,这个指标清楚地显示了每个时间框架的趋势是上升还是下降,帮助您根据市场的整体视图做出明智的决策。 多个指标的集成: 该工具结合了多个关键技术指标的信号,如Parabolic SAR, MACD, SMA, ADX 和 CCI。无需分别分析每个指标,"实时多指标" 为您提供了全面而详细的概览,清晰地显示了多个时间框架中的趋势和买卖信号。 清晰的汇总表: "实时多指标" 的一个突出特点是其汇总表。此表清晰显示了每个时间框架中每个指标的买入或卖出信号,使市场状况一目了然,并使您能够迅速应对机会。 易于使用: 无论您的交易经验水平如何,"实时多指标" 都被设计为用户友好型。直观的界面和信息的有序呈现
从77.90美元降至37.90美元的折扣,优惠截止至9月1日星期日 什么是“Forex Scanner”? “Forex Scanner”是一个强大的交易工具,旨在为您提供实时的外汇市场全面概览。这个先进的指标从多个技术指标和时间框架中收集关键数据,让您能够快速识别交易机会。如果您希望在不切换图表的情况下监控众多资产和参数,“Forex Scanner”是您的完美解决方案。 为什么选择“Forex Scanner”? 多时间框架扫描: “Forex Scanner”允许您在不同的时间框架内监控市场,从分钟到小时不等。这个工具帮助您在多个时间层次上立即识别趋势和交易信号,让您基于完整和详细的市场视图采取行动。 **集成多个指标:**该指标集成了多种技术工具,如ATR、RSI、随机指标、ADX、枢轴点和移动平均线,为您提供每个资产的市场条件清晰而准确的视图。通过这种集成,“Forex Scanner”让您能够以更大的信心和精确度进行交易。 清晰而有信息量的显示: “Forex Scanner”的一大特色是其能够在一个有组织的屏幕上显示所有相关信息。无论您是在寻找支撑和阻力位信息,还是想评估
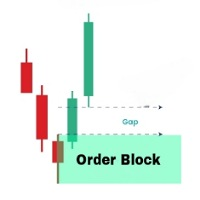
OrderBlock Analyzer 是一个定制的MetaTrader 4 (MT4) 指标,用于在价格图表上检测并标记订单块(Order Blocks)。此工具帮助交易者识别关键的市场结构,显示可能的反转或延续区域。OrderBlock Analyzer 基于市场行为自动绘制订单块,并通过颜色区分看涨和看跌块。 主要功能: 检测和绘制看涨和看跌订单块。 实时更新图表上的订单块,以便快速识别潜在的交易机会。 自定义订单块的颜色、填充线和线条样式。 灵活设置填充线的显示和厚度。 此指标适用于各类交易者,尤其适合趋势交易和反转交易策略。
............................................
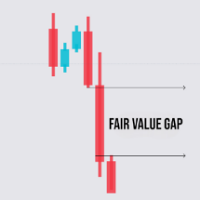
FVG Analyzer 是一款专为 MetaTrader 4 设计的自定义指标,用于识别和突出价格图表上的公允价值缺口(Fair Value Gaps, FVG)。该工具帮助交易者轻松识别出发生价格缺口的区域,为基于这些缺口的潜在交易机会提供支持。 主要特点: FVG 检测 : 看涨 FVG :识别出下一根蜡烛的最高价低于前一根蜡烛的最低价的看涨缺口。 看跌 FVG :识别出下一根蜡烛的最低价高于前一根蜡烛的最高价的看跌缺口。 高亮显示 : 在图表上绘制彩色矩形以表示 FVG。 提供了在 FVG 部分填充时改变矩形颜色的选项,基于预设的颜色设置。 在 FVG 内部包含填充线,可以根据颜色、厚度和样式进行调整。 设置参数 : 蜡烛数量 :定义用于检测 FVG 的蜡烛数量。 最小 FVG 宽度 :设置检测 FVG 所需的最小缺口宽度(以点为单位)。 颜色和样式 :设置看涨和看跌 FVG 的颜色,以及填充线的属性。 颜色变化 :启用或禁用在 FVG 部分填充时改变颜色的选项。 填充百分比 :定义 FVG 内部的可见填充百分比。 对象管理 : 在新蜡烛形成时自动删除过时的 FVG 对象,以保
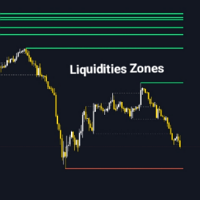
Liquidity Zone Detector 是一款高级技术指标,旨在通过使用 ZigZag 指标来识别和标注市场中的关键流动性区域。该工具通过在 ZigZag 检测到的高点和低点绘制趋势线来定位可能存在显著流动性的价格水平。Liquidity Zone Detector 帮助交易者根据流动性的累积或释放发现潜在的反转或趋势延续区域。 主要特点: 自动识别流动性区域 :在 ZigZag 指标识别的高点和低点绘制趋势线。 高级定制 :可配置流动性线的颜色、厚度和样式。 动态颜色变化 :当流动性水平被突破时,可选择更改线条颜色。 可调 ZigZag 参数 :调整 ZigZag 的深度、偏差和回溯步长以获得更精确的检测。 Liquidity Zone Detector 是分析市场结构并识别可能发生显著价格变动的关键区域的交易者的必备工具。
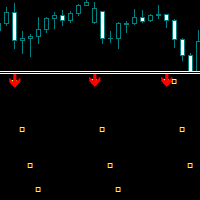
A technical indicator designed specifically for scalping, which can determine volatility impulses and show their duration.
It has flexible parameters for manual adjustment, allowing you to apply the indicator functionality to any trading instrument.
Recommended time frames for use are M5, M15, M30, H1 and H4.
There are several types of alerts.
All signals never change or repaint at the close of the candle.
The indicator is configured by parameters from top to bottom.
Trend Length - Spec
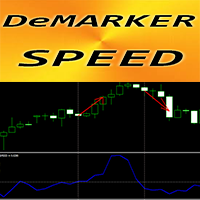
MT4 外汇指标“DeMarker Speed”
该指标的计算基于物理方程。DeMarker Speed 是 DeMarker 本身的一阶导数 DeMarker 振荡器曲线表示指标计算期间当前价格相对于先前高点和低点的位置 当标准 DeMarker 振荡器处于超卖/超买区域时(如图所示),DeMarker Speed 适合进行剥头皮交易 DeMarker Speed 指标显示 DeMarker 本身改变方向的速度 - 它非常敏感 如果 DeMarker Speed 指标的值 < 0:速度为负;如果 DeMarker Speed 指标的值 > 0:速度为正 指标具有内置移动和 PC 警报
// 更多出色的专家顾问和指标可在此处获得: https://www.mql5.com/en/users/def1380/seller 这是仅在此 MQL5 网站上提供的原创产品。
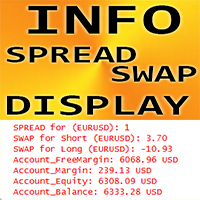
外汇指标“INFO 价差掉期显示”适用于 MT4,交易支持工具。
INFO 价差掉期显示指标显示其所附外汇对的当前价差和掉期。 它还显示账户余额、净值和保证金 可以在图表的任何角落找到指标值: 0 - 左上角,1 - 右上角,2 - 左下角,3 - 右下角 也可以设置颜色和字体大小 ................................................................................................................... // 更多优秀的专家顾问和指标可在此处获得: https://www.mql5.com/en/users/def1380/seller 这是仅在此 MQL5 网站上提供的原创产品。
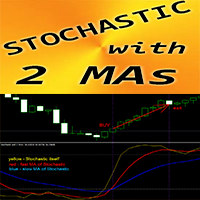
MT4 外汇指标“随机和 2 条移动平均线”
随机振荡指标是市场上最好的指标之一 - 对于许多交易者来说是完美的工具。 “随机和 2 条移动平均线”指标可让您查看随机震荡指标的快速和慢速移动平均线 超买区 - 80 以上;超卖 1 - 低于 20 从 80 以上区域获取卖出条目并从 20 以下区域获取买入条目非常有用 您可以在图片上看到买入和卖出的入场条件 考虑买入(卖出)信号条件: (1)-快速MA与慢速MA向上(向下)交叉于超卖(overBought):开启买入(卖出)交易 (2) -随机值处于超买区向下穿越快速 MA(在超卖区向上穿越快速 MA):退出买入(卖出)交易
// 这里提供更多优秀的 EA 交易和指标: https://www.mql5.com/en/users/def1380/seller 它是仅在该 MQL5 网站上提供的原创产品。

MT4 外汇指标“支撑阻力位”
“支撑阻力位”指标是非常有用的交易辅助指标 “支撑”和“阻力”是图表上受价格影响的重要区域 支撑位是价格经常停止下跌并反弹的地方 阻力位是价格通常停止上涨并回落的位置 “支撑阻力位”指标显示最近的水平: 阻力位 - 红线。 支撑位 - 蓝线 用于计算的条数、线型和颜色可以在设置中调整 “支撑阻力位”指标非常适合通过价格行为模式来规划您的止盈目标、价格反转和重新测试。 ............................................................................................................. // 这里提供更多优秀的 EA 交易和指标: https://www.mql5.com/en/users/def1380/seller 它是仅在该 MQL5 网站上提供的原创产品。
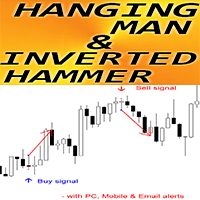
MT4 外汇指标“上吊线和倒锤线形态”
指标“上吊线和倒锤线形态”是价格行为交易的非常强大的指标:无需重绘,无延迟; 指标可检测图表上的看涨倒锤线和看跌上吊线形态: 看涨倒锤线 - 图表上的蓝色箭头信号(见图片) 看跌上吊线 - 图表上的红色箭头信号(见图片) 包括 PC、移动和电子邮件警报 指标“上吊线和倒锤线形态”非常适合与支撑/阻力位结合使用 .................................................................................................................... // 更多出色的专家顾问和指标可在此处获得: https://www.mql5.com/en/users/def1380/seller 这是仅在此 MQL5 网站上提供的原创产品
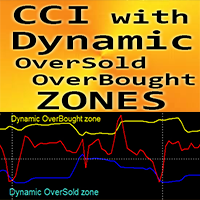
MT4 外汇指标“带动态超卖/超买区域的 CCI”。
商品通道指数 (CCI) 非常适合将动量交易纳入趋势方向。 非常适合从动态超买区域采取卖出入场,从动态超卖区域采取买入入场,进入主要趋势方向 此指标也非常适合与价格行动入场相结合。 动态超买区域 - 黄线上方 动态超卖区域 - 蓝线下方 CCI 振荡器测量当前价格与历史平均价格之间的差异。 ................................................................................................................... // 更多出色的专家顾问和指标可在此处获得: https://www.mql5.com/en/users/def1380/seller 这是仅在此 MQL5 网站上提供的原创产品。
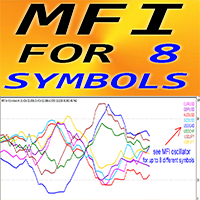
MT4 外汇指标“8 个符号的 MFI”。
资金流量指数 (MFI) 是一种技术震荡指标,它使用价格和交易量数据来识别超卖和超买区域 当 MFI 高于 80 时,从超买状态进入卖出状态,当 MFI 低于 20 时,从超卖状态进入买入状态 MFI 对于背离检测非常有用,并且与价格行动结合使用也非常有用 “8 个符号的 MFI”提供了在 1 张图表上控制最多 8 个不同符号的 MFI 值的机会 MFI 震荡指标提供有关看涨和看跌价格动量的信息 ................................................................................................................... // 更多出色的专家顾问和指标可在此处获得: https://www.mql5.com/en/users/def1380/seller 这是仅在此 MQL5 网站上提供的原创产品。

YOU CAN NOW DOWNLOAD FREE VERSIONS OF OUR PAID INDICATORS . IT'S OUR WAY OF GIVING BACK TO THE COMMUNITY ! >>> GO HERE TO DOWNLOAD
V1 Scalper is an easy to use tool designed for trend scalping. It tries to spot good entry points in a major trend by using swing high and lows formed along the trend . This tool can be used on Fx Pairs , Indices , Commodities and stocks. Not often but in some signals , the arrow might repaint on the current candle so extra confirmation tools are advised for t
FREE
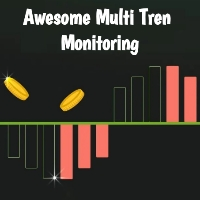
This indicator was created based on a multi-time trend monitoring system by combining several trend signals into 1 signal in the panel. This indicator is also equipped with an alert feature. Try to master how to reveal Fibo Weasel Candle Break Reetes to make it easier to use this indicator. for entry we only monitor the signal in the top left corner for the ongoing trend as a trading reference For the risk reward reference, we use the Fibo Weasel withdrawal reference which is in the same direct
FREE
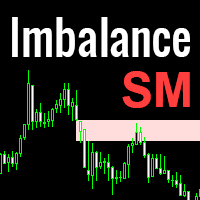
Imbalance is one of the important zones on the chart, to which the price will always strive to cover it. It is from the imbalance zone that the market most often makes significant reversals, rollbacks and gives entry points that you can successfully trade. In the Smart Money concept, the imbalance zone is used to find an entry point, as well as a place for take profit at the level of imbalance overlap by the price. Until the imbalance is overlapped, it is the closest target for the price. Ho
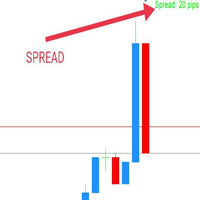
WaSpread MT4 Indicator shows the current spread in pips with color.
* Set the Spread Threshold and the color to identify when the current spread is below or above the Spread Threshold.
* Set X axis and Y axis and chose the Corner and the Anchor to position the Spread Label on the chart.
* Write the font and the font size for more confort.
* Activate alert if the current spread is above the spread threshold.
* For more precision, the user can choose to show the decimal numbers.
* The
FREE

Platone Breakout SMC - Advanced Trading Indicator Overview The Platone Breakout SMC is an innovative and powerful MetaTrader 4 (MT4) indicator designed for traders who seek to capitalize on smart money concepts (SMC) and breakout trading strategies. This indicator provides precision in identifying breakout levels, session times, and profit targets, ensuring that traders can execute well-informed trades with confidence. Trading Logic The core of the Platone Breakout SMC is its ability to identif
FREE
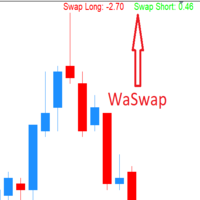
WaSwap MT4 Indicator shows the current Swap Long and current Swap Short with color.
* Set the Swap Threshold and the color to identify when the current swap is below or above the Spread Threshold.
* Set X axis and Y axis and chose the Corner and the Anchor to position the Swap Label on the chart.
* Write the font and the font size for more confort.
* Activate alert if the current Swap Long or the current Swap Short is below the swap threshold.
* The user will never swing with a negati
FREE
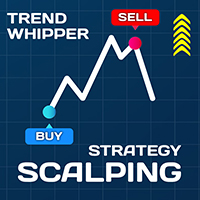
A Full Concept of BUY/SELL Scalping Strategy Trend detection is one of the basic challenges of every trader. Finding a way to tell when to enter a trade is very important, timing is a game changer, not too early and not too late. Sometimes, due to not knowing the market conditions, the trader closes his positions with a small profit or allows the losses to grow, these are the mistakes that novice traders make. Indicator Trend Whipper is a complete trading strategy and can improve the trader's tr

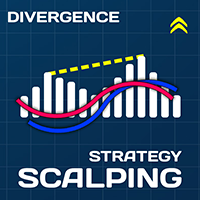
Divergence Divergence refers to when the price of a currency pair moves in one direction while the trend indicator is moving in the opposite direction. With divergence, there can be positive and negative signals. Divergences in Forex trading are quite common signals of technical analysis. These are basic early Forex signals indicating the trend reversal and filter false signals. Application of this indicator It is usually not easy to detect divergences by the trader and it may be time-consuming

he "Super Trampoline" is an innovative trading indicator designed to simplify decision-making in financial markets. It analyzes chart data and provides clear and timely signals on when to buy or sell an asset, based on a proven strategy of candlestick pattern analysis. Product Advantages: Intuitive Interface : "Super Trampoline" integrates directly into your trading terminal, displaying signals as simple arrows on the chart. This means you don't need deep technical analysis knowledge to start us

Introducing "Super Transplant with Filter" — a game-changing tool for traders who value precision, reliability, and simplicity. This indicator combines advanced trend analysis techniques with intelligent signal filtering, allowing you to make decisions based on the most relevant data. Benefits of "Super Transplant with Filter": Accuracy in Every Trade : The indicator meticulously analyzes market data, identifying key trends while filtering out false signals. This enables you to make more informe
MACD Indicator The Moving Average Convergence and Divergence (MACD) is a trend following momentum indicator which shows the relationship between two moving averages that we chose and configure them on the indicator. The MACD is calculated by subtracting the 26-period exponential moving average and the 12 period D.A.M. These are the default parameters when you put the MACD indicator on the charts, and the period is usually 9 which means the last 9 candles. DT-Oscillator This is Robert C. Miner's

The indicator defines the buy and sell arrows with high performance and consistent results. Suitable for trend trading or following the trend. Automatic analysis of market opportunities ; Help traders earn more from their investments;
Never repaints, recalculates or backpaints signals; This is FREE demo version of the indicator and works only on "EUR USD M5" . The demo version does not work on SUFFIX OR PREFIX brokers ! Forex Trend Commander All details about the indicator here :
FREE
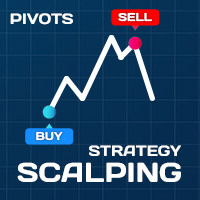
Scalping Strategy BUY SELL
Having a strategy in the market is one of the main conditions for trading. The presence of various and complicated indicators and tools sometimes makes trading difficult, and the user gets confused after trying various methods and gets stuck in a loss cycle, the result of which is usually clear. This indicator is a simple strategy based on the detection of pivots and short-term trends, which helps you to easily trade in trends. Sometimes a simple but efficient st

Adjustable Consecutive Fractals looks for 2 or more fractals in one direction and sends out a on screen alert, sound alert and push notification, for strong reversal points .
Adjustable Consecutive Fractals, shows the fractals on chart along with a color changing text for buy and sell signals when one or more fractals appear on one side of price.
Adjustable Consecutive Fractals is based Bill Williams Fractals . The standard Bill Williams fractals are set at a non adjustable 5 bars, BUT withe

The Binary Profit Maker,
This indicator works on MT4 and is very easy to use. When you receive a signal from it, you wait for that candle with the signal to close and you enter your trade at the beginning of the next new candle . A Up Purple arrow means Buy and a Down Purple arrow means Sell. All arrows comes with Alert like for easy identification of trade signal. Are you okay with that?
How To Enter Trade?
1 minute candle
1 minute expire

This indicator/dashboard , is place on a single symbol. It shows the percentage of movement withing all time frames from M1 to W1.The text will change green if all % are in the positive for a buy signal.The text will change red if all % are below zero and in negative for a sell signal. There are audible notifications, as well as on screen notifications along with push notifications that can be turned on and ON/OFF in the settings.
This is a sure way to Find trends quickly and efficiently, with

成交量突破震荡指标是一种以震荡指标的形式将价格变动与成交量趋势相匹配的指标。
我想将成交量分析整合到我的策略中,但大多数成交量指标都令我失望, 例如 OBV、资金流量指数、A/D,还有成交量加权 Macd 和许多其他指标。 因此,我为自己编写了这个指标,我对它的实用性感到满意,因此我决定将其发布到市场上。
主要特点:
它突出显示了价格在成交量增加(突破)支持下朝某个方向移动的阶段。 它突出显示了成交量增加停止并因此市场收缩的阶段。 它突出显示了价格和成交量均未移动的阶段,尤其是在时间范围(<=15 分钟)的日内交易中,因此市场已为未来的运行做好准备。 当其他 EA 交易程序发出的虚假信号不受交易量增加的支持时,可过滤掉这些信号。 它使趋势和范围阶段可视化变得非常容易 输入参数:
计算设置:
计算类型:快速、正常、慢速,用于监控短期、中期和长期,保持在同一时间范围内。 计算周期:计算周期 交易量设置: 交易量类型:TickVolume(主要用于外汇)和RealVolume(用于股票市场) 信号设置: 信号周期:信号线周期 突破水平:突破信号的阈值水平 警报设置 警报
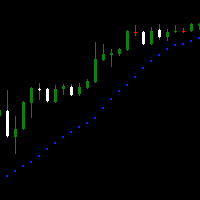
Доброго времени суток.
Вашему вниманию простой, но крайне удобный продукт для любителей индикатора Parabolic SAR . Он представляет собой окно осциллятора, на который выводится несколько тайм-фреймов в режими реального времени вместе с индикатором.
Настройки интуитивно понятные, что бы включать и отключать количество выбранных таймов - необходимо применять PERIOD_CURRENT, в таком случае дополнительный тайм не откроется.
Пишите в комментариях к продукту, что бы вы хотели увидеть в новых вер
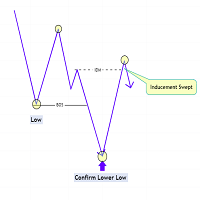
The Market Structure with Inducements & Sweeps indicator is a unique take on Smart Money Concepts related market structure labels that aims to give traders a more precise interpretation considering various factors.
Compared to traditional market structure scripts that include Change of Character (CHoCH) & Break of Structures (BOS) -- this script also includes the detection of Inducements (IDM) & Sweeps which are major components of determining other structures labeled on the chart.
SMC &

Session Average Date Range: Analyze and average the low - high of specific trading sessions within custom date ranges, offering insights into price movements and market behavior over selected periods. The "Session Average Date Range" tool is an advanced analytical utility designed to empower traders and analysts by allowing them to dissect and evaluate the volatility of specific trading sessions within a user-defined date range. This tool provides a flexible and precise approach to analyzing pri
FREE

The indicator monitors price movements in relation to a dynamic trailing stop line derived from the Average True Range (ATR). The trailing stop line adjusts based on market volatility, with the ATR determining the distance of the stop from the current price. This allows the stop to widen during periods of high volatility and tighten during calmer market conditions. The indicator tracks how the price interacts with this trailing stop line, marking potential reversal points when the price crosses
FREE
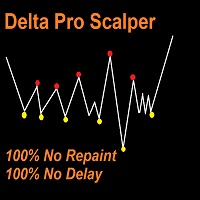
Delta Pro Scalper - Your Ultimate Trend Trading Solution, Delta Pro Scalper is a TREND indicator that automatically analyzes the market and provides information about the trend without redrawing or delay.
The indicator uses candlestick OHLC data and analyzing them to determine up trend or down trend, You MUST wait till closing candle, once the dot appear the next open candle you can open buy or sell position. Red Dot = Bearish Trend (Open SELL)
Yellow Dot = Bullish Trend (Open BUY) Here's th
Follow Line 指标是交易者用于准确识别和跟随市场趋势的重要工具。该指标动态适应价格变化,绘制一条平滑、连续的线来跟踪价格走势。凭借其视觉上的简洁性和有效性,能够提示趋势变化,Follow Line 是任何交易者策略中的绝佳补充。 主要特点: 趋势跟踪: Follow Line 紧随价格变化,使交易者能够轻松识别当前的市场趋势。 视觉简洁: 通过清晰明确的线条,即使是经验不足的交易者也能快速理解市场方向。 适应性强: 适用于各种时间框架和工具,适合从日内交易到波段交易的多种交易策略。 如何使用: 安装: 将 Follow Line 指标添加到您希望分析的金融工具的图表上。 设置: 根据您的交易策略调整指标参数。 趋势分析: 观察 Follow Line 线条以确定当前趋势方向。 交易机会: Follow Line 在趋势市场中特别有用。例如,在突破情境中,当价格超过重要的阻力或支撑位时,Follow Line 可以确认走势的有效性。这使交易者能够更加自信地把握价格波动的机会。
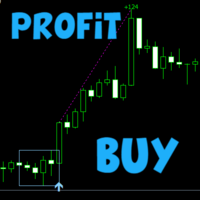
Scalper Box MT4
Fully ready strategy for trading on all markets (Stocks, Futures, Forex and Cryptocurrencies).
Indicator signals are not repaint!!!
Discounted price - 50$ (2 copies only) The next price is 99$
How to trade?
Wait for a signal from the indicator Scalper Box MT4 (blue arrow - buy, red arrow - sell).
After the signal we immediately enter the market, SL set behind the formed box.
Using trend filter indicator and template
Recommended timeframe:
M5 - Ideal for Sca
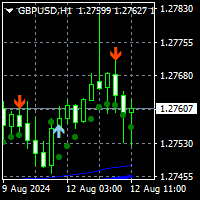
To get access to MT5 version please click here . This is the exact conversion from TradingView: " SSL Hybrid" by Mihkel00.
This is a light-load processing and non-repaint indicator. All input options are available. Buffers are available for processing in EAs. You can message in private chat for further information/changes you need. Thanks for downloading

炸彈銀行訊號:您對 MetaTrader 4 的信心指標
Bomb Bank Signal 是 MetaTrader 4 的一個強大指標,旨在識別金融市場中最相關的趨勢。如果您正在尋找一種能夠準確預測運動的工具,那麼炸彈庫就是您需要的盟友。
運作原理:
該指標結合了三種不同的方法——成交量分析、蠟燭收盤價和對稱趨勢——來偵測和發出買賣機會訊號。當炸彈銀行識別出買入機會時,它就像一顆「炸彈」;當它偵測到賣出訊號時,它就像一個「頭骨」。
為什麼炸彈銀行不一樣?
完全可靠性:炸彈庫訊號不會刪除訊號。訊號一旦發出,就會一直存在,確保您不會錯過任何機會。 極為準確:炸彈庫不會發出錯誤訊號。它會即時更新您的訊息,隨著市場的變化進行調整,但保持先前訊號的透明度。 即時更新:訊號被即時識別並在必要時更新,使您能夠快速響應市場變化。 最大化您的結果:
炸彈銀行訊號是識別趨勢持續走勢的理想選擇。例如,如果您已經做空並且指標在 M15 發出買入訊號,那麼現在就是平倉或部分下單的最佳時機,反之亦然。
此外,經過仔細分析,我們建議您遵循M30、H1和H4上的訊號,停損僅50點。這使

“主要貨幣對的 ADX”指標是一種技術工具,用於衡量外匯市場中主要貨幣對的強度。它基於方向運動指數 (ADX),它使您可以確定趨勢的強度及其方向。 該指標説明交易者瞭解給定時間市場中價格變動的活躍程度。此外,「主要貨幣對的 ADX」提供了有關主要貨幣中領導者變化的信號,這可以成為做出交易決策的有用資訊。 交易者可以使用此指標來確定交叉匯率的進入和退出交易的時刻。 例如,您收到了有關NZDUSD(增長)領導地位的信號。這意味著需要買入NzdChf,而AudNzd需要賣出。 祝您交易愉快! ,..................................................... ......................................................
FREE
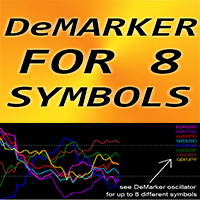
适用于 MT4 的外汇指标“DeMarker for 8 Symbols”,无需重绘
DeMarker 振荡器曲线指示指标计算期间当前价格相对于先前高点和低点的位置 DeMarker 提供其他振荡器中最有效的常规背离信号 非常适合在超买区域(高于 0.7)中以常规背离进行卖出入场,在超卖区域(低于 0.3)中以常规背离进行买入入场 “DeMarker for 8 Symbols”让您有机会在 1 张图表上控制多达 8 个不同符号的 DeMarker 值 该指标非常适合与超卖/买入区域的价格行动入场相结合。
// 更多出色的专家顾问和指标可在此处获得: https://www.mql5.com/en/users/def1380/seller 它是仅在此 MQL5 网站上提供的原创产品。
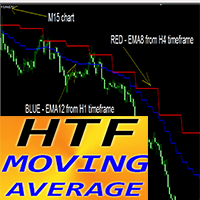
MT4 外汇指标 HTF 移动平均线
使用专业的 MT4 HTF MA 指标升级您的交易方法。 HTF 意味着 - 更高的时间范围 该指标对于具有价格行为条目的趋势交易者来说非常有用。 HTF MA 指标允许您将较高时间范围的移动平均线附加到当前图表。 指标显示较高时间范围内的趋势 --> 这始终是有利可图的方法。 HTF MA 指标提供了以低风险获得巨额利润的机会。
如何使用: 附上从 D1 到 H4 或 H1 图表的 MA 附上从 H4 到 H1、M30 或 M15 图表的 MA 等等(见图) ............................................................................................................. // 这里提供更多优秀的 EA 交易和指标: https://www.mql5.com/en/users/def1380/seller 这是仅在该 MQL5 网站上提供的原创产品
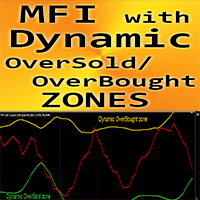
适用于 MT4 的外汇指标“具有动态超卖/超买区域的 MFI”。
资金流量指数 (MFI) 是一种技术震荡指标,它使用价格和交易量数据来识别超卖和超买区域 非常适合从动态超买区域获取卖出条目,从动态超卖区域获取买入条目 MFI 对于背离检测非常有用,并且非常适合与价格行为结合使用 动态超买区域 - 黄线上方 动态超卖区域 - 绿线下方 MFI 震荡指标提供有关看涨和看跌价格动量的信息 .................................................................................................................... // 更多出色的专家顾问和指标可在此处获得: https://www.mql5.com/en/users/def1380/seller 这是仅在此 MQL5 网站上提供的原创产品。
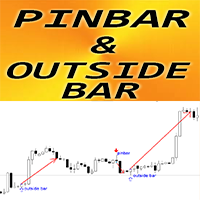
MT4 外汇指标“Pin Bar 和 Outside Bar 模式”
“Pin Bar & Outside Bar Patterns”指标对于价格行为交易非常强大 指标检测图表上的 Pin Bar 和 Outside Bar 形态: 看涨模式 - 图表上的蓝色箭头信号(参见图片) 看跌模式 - 图表上的红色箭头信号(见图) 无需重新喷漆; 没有延误; 带有 PC、手机和电子邮件警报 指标“Pin Bar & Outside Bar Patterns”非常适合与支撑/阻力位结合使用 ............................................................................................................. // 这里提供更多优秀的 EA 交易和指标: https://www.mql5.com/en/users/def1380/seller 它是仅在该 MQL5 网站上提供的原创产品。
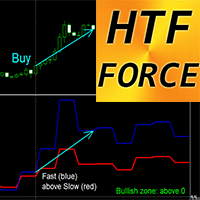
外汇指标 HTF 力量振荡器适用于 MT4
HTF 力量是多时间框架交易的强大指标。HTF 表示 - 更高时间框架 力量指数是将价格和成交量数据合并为单个值的顶级指标之一 高时间框架的值可以显示趋势方向(下降趋势 - 低于 0;上升趋势 - 高于 0) 快速力量 - 蓝线,慢速力量 - 红线 买入信号 - 快速线向上穿过慢线并且两者均高于 0(见图) 卖出信号 - 快速线向下穿过慢线并且两者均低于 0(见图) 指标具有内置移动和 PC 警报 ................................................................................................................... // 更多出色的专家顾问和指标可在此处获得: https://www.mql5.com/en/users/def1380/seller 它是仅在此 MQL5 网站上提供的原创产品。

Features:
This is a slope indicator for TMA Bands indicator. It calculates slope of the center line. It supports 3 types of TMA Bands: TMA True (Non-repaint) Fast Line TMA (Repaints) TMA+CG (Repaints) It will help you determine whether price is Trending or Ranging based on the Threshold you set. Download extra TMA Indicators for strategy here: https://www.mql5.com/en/blogs/post/758718
How It Works: You can set the Slope Threshold for indicating Buy/Sell heightened levels. Suppose we set Thr
FREE

DTFX Algo Zones are auto-generated Fibonacci Retracements based on market structure shifts.
These retracement levels are intended to be used as support and resistance levels to look for price to bounce off of to confirm direction.
USAGE Figure 1 Due to the retracement levels only being generated from identified market structure shifts, the retracements are confined to only draw from areas considered more important due to the technical Break of Structure (BOS) or Change of Character

Aristotle Market Profile SMC Indicator: Overview: The Aristotle Market Profile SMC Indicator, is a comprehensive and highly customizable tool designed for traders seeking to integrate Market Profile analysis into their trading strategies. This advanced indicator is built to display the Market Profile across various trading sessions, including intraday, daily, weekly, and monthly periods, offering deep insights into market behavior and price levels over different timeframes. Key Features: Multip
FREE
This indicator is designed for effective short-term trading and the most aggressive reinvestment of potential profits into new positions. The philosophy of its use involves entering based on the indicator signal and fixing profit/loss as quickly as possible when receiving an opposite indicator signal on an even shorter time period of the chart.
Thus, the algorithm for effectively using the presented indicator is as follows: 1. Wait for a buy/sell signal to appear. The signal appears at the mom

This indicator works on MT4 and is very easy to use. When you receive a signal from it, you wait for that candle with the signal to close and you enter your trade at the beginning of the next new candle . A red arrow means sell and a green arrow means buy. All arrows comes with Alert like for easy identification of trade signal. Are you okay with that?
1 minute candle
1 minute expire

Average Session Range MT4: Calculate and Average the Sessions High-Low Range of Specific Time Sessions Over Multiple Days. The Session Average Range is a sophisticated and precise tool designed to calculate the volatility of specific time sessions within the trading day. By meticulously analyzing the range between the high and low prices of a defined trading session over multiple days, this tool provides traders with a clear and actionable average range. **Note:** When the trading platform is cl
FREE
FREE Spread indicator for MetaTrader 4 this indicator includes: -average spread -current spread -minimum spread -maximum spread
If you are interested in my products I recommend you visit my page where you can find: Experts Advisors: https://www.mql5.com/it/market/product/119456?source=Site+Profile indicators: https://www.mql5.com/it/market/product/120038?source=Site+Profile
I hope the spread indicator will be useful to you.
https://www.mql5.com/it/users/kappa05
FREE

Order block hunter indicator is the best indicator for hunt the order blocks that area where there has been a large concentration of limit orders waiting to be executed Order blocks are identified on a chart by observing previous price action and looking for areas where the price experienced significant movement or sudden changes in direction .This indicator does that for you by using very complicated codes and helps you to take the best areas To buy and sell because it make marks at the best a

Introducing the Volume Order Blocks indicator, a game-changing tool designed for traders who demand precision and clarity in their market analysis. This advanced indicator not only identifies order blocks but also integrates crucial volumetric data, allowing you to gauge the strength of these blocks with unparalleled accuracy. MT5 version - https://www.mql5.com/en/market/product/121238/ Key Features of the Volume Order Blocks: Bullish & Bearish Order Blocks: Easily visualize and dif

A complex of indicators of recognizing reversal moments. Detects the peaks and hollows according to the combinations of candles after they deduct from two MA. Applicable for trading systems when using early inputs. You can use a trend for scalping and intraday trade, and for detecting a trend in the early stages.
Possibilities
The parameters provide flexible settings for any time floms and trading tools. There are several types of warning for signals. Yellow arrow - Sell signal , pink arr

SpreadChartOscillator is an indicator that displays the spread line of a symbol in the subwindow of the oscillator. In the parameters it is possible to specify another symbol from which the spread line will be broadcast. If the "Symbol" parameter is left empty, the spread line will be displayed from the current symbol on which the indicator is set. This tool is ideal for traders who want to see the spread dynamics in the oscillator format and use it to protect themselves from entering the market
FREE
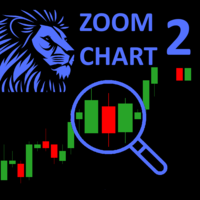
The ZoomChart indicator works with two charts - the current chart on which it is launched and the next one. The indicator translates the second chart to the time where the first one is now. Thus, the second chart depicts the same situation on the first chart (where the indicator is launched), but on a different time-frame. In other words, this indicator serves as a magnifying glass or, on the contrary, reduces the chart to display the situation on a larger time-frame.
The ZoomChar indicator a
FREE

TickChartOscillator is an indicator that displays a symbol's tick chart in an oscillator subwindow. It offers flexible customization options, including: · The ability to hide the price line in the oscillator. · The option to specify a different symbol for tick chart display. If the "Symbol" parameter is left blank, the tick chart will be shown for the current symbol where the indicator is applied. This tool is perfect for traders who want to view tick dynamics in an oscillator format and u
FREE

ARFX link: https://linktr.ee/ARFX_Auto_Trade I made this Alligator Indicator with the concept of multi time frame monitors where friends can directly use the signals that appear with reference If a Buy Signal appears from D1 to M1, then we just focus on buying using the Breakout Candle as a reference If a Sell Signal appears from D1 to M1, then we just focus on Sell using the Breakout Candle as a reference If you want to get this indicator for free then you have to join the ARFX IB line https:
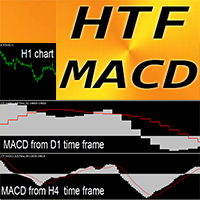
外汇指标 HTF MACD 振荡器适用于 MT4
HTF 表示 - 更高时间框架 MACD 指标本身是趋势交易最受欢迎的指标之一 该指标非常适合具有价格行为条目或与其他指标结合的多时间框架交易系统 HTF MACD 指标允许您将更高时间框架的 MACD 附加到当前图表 --> 这是专业的交易方法 指标具有内置的移动和 PC 警报 ................................................................................................................... // 更多出色的专家顾问和指标可在此处获得: https://www.mql5.com/en/users/def1380/seller 这是仅在此 MQL5 网站上提供的原创产品。

适用于 MT4 的外汇指标“MA Speed”,无需重绘。
移动平均线速度 - 独特的趋势指标
该指标的计算基于物理方程。 速度是移动平均线的一阶导数 MA 速度指标显示 MA 本身改变方向的速度 有很多机会使用 MA Speed 升级标准策略。适用于 SMA、EMA、SMMA 和 LWMA 建议在趋势策略中使用 MA Speed,如果指标值 < 0:趋势下降;如果指标值 > 0:趋势上升 时间范围 - 任意;交易对 - 任意 指标具有内置移动和 PC 警报。
参数(设置非常简单): 1) 速度周期。建议值为 3 到 7。当速度周期较低时,指标的灵敏度会增加,反之亦然。 2) MA 周期(将计算此 MA 的速度) 3) MA 方法:SMA、EMA、SMMA、LWMA 4) MA 应用价格(7 个选项)
// 更多出色的专家顾问和指标可在此处获得: https://www.mql5.com/en/users/def1380/seller 这是仅在此 MQL5 网站上提供的原创产品。
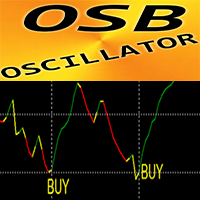
OSB 振荡器 - 是高级自定义指标,高效的价格行为辅助工具!
使用先进的新计算方法。 新一代振荡器 - 查看图片以了解如何使用它。 OSB 振荡器是辅助工具,用于查找价格行为、背离和超卖/超买信号的准确切入点 超卖值:低于 30 超买值:超过 70 使用此指标,有很多机会升级标准策略。 它比标准振荡器更快、更准确。 指标设置非常简单。它只有 1 个参数 - 灵敏度。 如何使用: 作为价格行为过滤器(见图片) 作为主要趋势方向的进入信号(见图片) 作为具有准确信号的背离指标(见图片)
// 更多出色的专家顾问和指标可在此处获得: https://www.mql5.com/en/users/def1380/seller 这是仅在此 MQL5 网站上提供的原创产品。
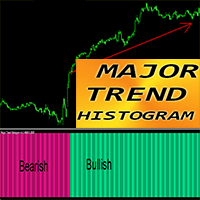
MT4 外汇指标“主要趋势直方图”
主要趋势直方图指标旨在捕捉真正巨大的趋势 指标有两种颜色:DeepPink 表示看跌趋势,SpringGreen 表示看涨趋势(颜色可以更改) 它可以在开始阶段检测趋势 - 比任何标准 MA 交叉更有效 主要趋势直方图可以与任何其他交易方法结合使用:价格行为、VSA、其他指标 指标具有内置移动和 PC 警报 ................................................................................................................... // 更多出色的专家顾问和指标可在此处获得: https://www.mql5.com/en/users/def1380/seller 它是仅在此 MQL5 网站上提供的原创产品。
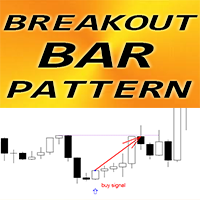
MT4 外汇指标“突破条形图”
指标“突破条形图”是价格行为交易的非常强大的指标:无需重绘,无延迟; 指标检测图表上的突破条形图: 看涨突破条形图 - 图表上的蓝色箭头信号(见图片) 看跌突破条形图 - 图表上的红色箭头信号(见图片) 带有 PC、手机和电子邮件警报 指标“突破条形图”非常适合与支撑/阻力位结合使用 ................................................................................................................... // 更多出色的专家顾问和指标可在此处获得: https://www.mql5.com/en/users/def1380/seller 这是仅在此 MQL5 网站上提供的原创产品
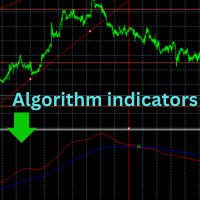
Welcome, thank you for choosing us Read carefully before starting When you turn on the indicator, leave it for about an hour or two. It will automatically collect the data, and then its shape will be complete and it will start balancing the new data. We offer you the latest indicators that will help you make decisions after creating your own technical analysis
You will see the entry point that you will use to get a good deal
At each intersection there is an opportunity for a deal that the i
123456789101112131415161718192021222324252627282930313233343536373839404142434445464748495051525354555657585960616263646566676869707172737475767778798081828384858687888990919293949596979899100101102103104105106107108109110111112113114115116117118119120121122123124125126127128129130131132133134135136137138139140
MetaTrader市场提供了一个方便,安全的购买MetaTrader平台应用程序的场所。直接从您的程序端免费下载EA交易和指标的试用版在测试策略中进行测试。
在不同模式下测试应用程序来监视性能和为您想要使用MQL5.community支付系统的产品进行付款。
您错过了交易机会:
- 免费交易应用程序
- 8,000+信号可供复制
- 探索金融市场的经济新闻
注册
登录