适用于MetaTrader 4的新技术指标 - 51

Hello. Another free indicator from Sepehr! ;) You can determine the trend with this tool. Using crosses of two Moving averages, you can say that the trend is going to be bullish or bearish; A fast-moving average and a slow one. When the fast-moving crosses up the slow-moving, it's going to be an uptrend and when it crosses down the slow-moving, it means that you are going to have a downtrend. That's easy ;) Hope to enjoy it Sepehr(Faran)
FREE

A useful scanner/dashboard that shows the RSI values for multiple symbols and time-frames.
It can be easily hidden/displayed with a simple click on the scanner man top left of the dashboard.
You can input upper and lower RSI values and the colours can be set to show when above/below these values. The default values are 70 and 30. There are also input colours for when the RSI is above or below 50 (but not exceeding the upper/lower levels
Symbols and time-frames are input separated by commas.
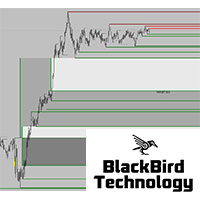
Dear Traders, check out my new multi level market liquidity indicator : https://www.mql5.com/en/market/product/73098
Many of you have been trading very good with this indicator, thanks for the support and positive feedbacks ! For more information about market liquidity, a manual on how to use this indicator please send me a message. A lot of information can be found on the net. (search liquidity trading/ inner circle trader)
https://www.youtube.com/watch?v=yUpDZCbNBRI
https://www.youtube.com/

Offer 249 down from 350 for the next 3 copies. then back to 350 $
Are you tired of using outdated indicators that leave you guessing where to set your profit targets? Look no further than the AK CAP Opening Range Breakout Indicator. This powerful tool is backed by a US patent and has already helped countless traders pass funded challenges like FTMO. We use it daily on our prop traders and internal funds, and now it's available to you as well. The calculation behind the indicator is incredibly a

This indicator is based on the Weis wave principle of wave volume. Below are few features of the indicator It draws the wave on the chart while the accumulated volume per wave in a different window at the bottom of the chart You can configure the turning point move It displays the accumulated volume (in thousands, eg for 15000 volume it will show 15) at the end of each wave You can also configure to show number of candles in the wave along with the wave volume The indicator calculates the distin

Displays multiple trend indicators on the main chart. Great for scalping. Settings: LWMA SMA SSMA EMA ADX (red and blue dots), and PSar Alerts for ADX crosses. How to use: Can be used on any time frame. Buy : - Blue dot first. - Then PSar and 3 MAs cross below price. **Best results when confirming the higher time frames too.
Sell : - Red dot first. - Then PSar and 3 MAs cross above price. **Best results when confirming the higher time frames too. Or backtest and use as you see fit for your stra

This indicator takes input from the RSI from multiple time frames (M/W/D/H4/H1/M30), and presents the output as lines above or below the price, on the main chart. Great for scalping. Features alerts for the current time frame's RSI (the Arrows). Settings: RSI period settings for M/W/D/H4/H1/M30/Current. (Set to your preference) PSar settings for trend determination; for current chart's time frame. How to use: Simply attach to M5 (Scalping - zoom chart out completely on M5) or use on higher time

This is the entry and settings for Pipsurfer EA Strategy 1 in an Indicator form. This was created to help users see the entries that Pipsurfer would take and for those who wish to manually trade the entries. Entry Strategies Strategy 1 - This strategy is a conservative strategy that incorporates trend market structure and momentum with each entry having to meet a large variety of market conditions. The goal of this entry is to buy at the lowest point of a trend pullback and sell at the highest

This indicator is Strategy 2 of the Pipsurfer EA so traders can see where the EA would enter trades at and manually trade with the EA A Smart Money trend continuation strategy that's more moderate but this strategy includes candlestick price action and smart money institutional concepts to find trend continuation moves and hopefully to catch the BIG move that the Banks enter at. There are a full clues that large institutions give before entering and Pipsurfer Strategy 2 is designed to look for

FX 箭头反转是一个简单的非复杂箭头指标,用于剥头皮趋势。 使用自由裁量的交易选择方法。 趋势线、震荡指标、移动平均线、通道或交易者希望的任何其他方法。 该指标适用于任何时间范围和任何资产。 使用止损来保本。
该指标的工作方式源自收敛和发散以及趋势动量。 使用 ATR,因此该指标可以适用于所有资产。 指示器有警报。
FX 箭头反转是一个简单的非复杂箭头指标,用于剥头皮趋势。 使用自由裁量的交易选择方法。 趋势线、震荡指标、移动平均线、通道或交易者希望的任何其他方法。 该指标适用于任何时间范围和任何资产。 使用止损来保本。
该指标的工作方式源自收敛和发散以及趋势动量。 使用 ATR,因此该指标可以适用于所有资产。 指示器有警报。 FX 箭头反转是一个简单的非复杂箭头指标,用于剥头皮趋势。 使用自由裁量的交易选择方法。 趋势线、震荡指标、移动平均线、通道或交易者希望的任何其他方法。 该指标适用于任何时间范围和任何资产。 使用止损来保本。
该指标的工作方式源自收敛和发散以及趋势动量。 使用 ATR,因此该指标可以适用于所有资产。 指示器有警报。

神经带是一个剥头皮指标。 超卖和超买水平有 2 个不同的偏差带。 彩色蜡烛用于确定趋势是否超过偏差并显示出强劲的趋势,或者彩色蜡烛是否在偏差处停止并恢复到平均值。 此 EA 是一种回归指标交易范围和价格突破。
Neural Bands 2.0 没有添加重绘箭头。 神经带是一个剥头皮指标。 超卖和超买水平有 2 个不同的偏差带。 彩色蜡烛用于确定趋势是否超过偏差并显示出强劲的趋势,或者彩色蜡烛是否在偏差处停止并恢复到平均值。 此 EA 是一种回归指标交易范围和价格突破。
Neural Bands 2.0 没有添加重绘箭头。 神经带是一个剥头皮指标。 超卖和超买水平有 2 个不同的偏差带。 彩色蜡烛用于确定趋势是否超过偏差并显示出强劲的趋势,或者彩色蜡烛是否在偏差处停止并恢复到平均值。 此 EA 是一种回归指标交易范围和价格突破。
Neural Bands 2.0 没有添加重绘箭头。

市场动态用于趋势剥头皮。 蓝色是买入,红色是卖出。 这些线是价格整合的区域,常规的蜡烛线是未确定的。 价格将在支撑线和阻力线之间盘整,然后价格走势突破该区域。 在上方或下方绘制头皮区域,并遵循头皮的主要趋势或日间交易。
市场动态用于趋势剥头皮。 蓝色是买入,红色是卖出。 这些线是价格整合的区域,常规的蜡烛线是未确定的。 价格将在支撑线和阻力线之间盘整,然后价格走势突破该区域。 在上方或下方绘制头皮区域,并遵循头皮的主要趋势或日间交易。
市场动态用于趋势剥头皮。 蓝色是买入,红色是卖出。 这些线是价格整合的区域,常规的蜡烛线是未确定的。 价格将在支撑线和阻力线之间盘整,然后价格走势突破该区域。 在上方或下方绘制头皮区域,并遵循头皮的主要趋势或日间交易。

YOU CAN NOW DOWNLOAD FREE VERSIONS OF OUR PAID INDICATORS . IT'S OUR WAY OF GIVING BACK TO THE COMMUNITY ! >>> GO HERE TO DOWNLOAD
This system is an Heiken Ashi system based on RSI calculations . The system is a free open source script originally published on TradingView by JayRogers . We have taken the liberty of converting the pine script to Mq4 indicator . We have also added a new feature which enables to filter signals and reduces noise on the arrow signals.
Background
HEIKEN ASHI
Th
FREE

Introducing the trend indicator! Ready trading system. The principle of the indicator is to automatically determine the current state of the market when placed on a chart. The indicator analyzes market dynamics for pivot points. Shows the favorable moments of entering the market with stripes. Can be used as a channel indicator or level indicator! This indicator allows you to analyze historical data, and on their basis display instructions to the trader on further actions. To find out how to dete
Promotion $66 lifetime for you.
The principle of this indicator is very simple: detecting the trend with Moving Average, then monitoring the return point of graph by using the crossing of Stochastic Oscillator and finally predicting BUY and SELL signal with arrows, alerts and notifications. The parameters are fixed and automatically calculated on each time frame. Example: If you install indicator on EURUSD, timeframe M5: the indicator will detect the main trend with the Moving Average on this
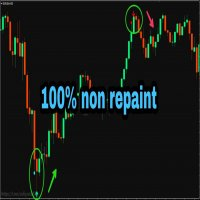
PLEASE NOTE You can customize the settings of K_period value, the oversold and the overbought value is customizable. You can change it as per your requirement. The accuracy will change as per your settings.
100% Non repaint indicator
Pre-alert (get ready) signals
Non-delay indications
24/7 signals
100% No lag
No recalculating The arrows wont repaint even if the signal fails, or you refresh or restart the mt4 Indicator is based on simple crossover strategy of main line and signal line of St
FREE

The Trend TRN trend indicator works using a special algorithm and a set of indicators. It finds the current trend based on many factors.
Trend TRN entry points should be used as potential market reversal points. The indicator works using the cyclic-wave dependence function. Thus, all entry points will be optimal points where the movement changes.
A simple and convenient indicator. The user can easily see the trends. You can use this indicator alone or in combination with other indicators acco

The Squeezer indicator simply draws ascending lines with Sell signal in the downtrend and descending lines with Buy signal in the uptrend to catch the pullbacks and sniper entries. This is a common successful trading strategy being used by many successful traders, and the good thing about this strategy is that it works with all time frames. The difference is in the take profit level between them. Buy / Sell signals are triggered at the close of the current candles above / below the ascending or

This tool draws all the pivot point lines on chart. It is important to remind/tell you that there are 5 pivot method according to BabyPips website. All these methods have their unique mathematical formula. 1. Floor Method. 2. Woodie Method. 3. Camarilla Method. 4. DeMark Method. 5. Fibonacci Method. What makes this pivot tool unique is that you can click the "Fibonacci" button to select the pivot method you want. You can click the "Monthly" button to select the Period you want to use for the piv

CUSTOM Currency strength indicator
-CHOOSE ANY CURENCIES that you want to calculate strength for, indicator will automatically compare all symbols /pairs from 8 selected currencies based on KU-chart calculations.
-8 major currencies are used by default
-add indicator to any chart
-made for 15min timeframe= last 1 day change calculated, 30min = last 2 days and so on
-clear currency distinguish by color and name on chart
-if you chose non-standard currency, make sure all of inputted values hav
FREE

The Bollinger Band is a strategy that has become one of the most useful tools for spotlighting extreme short-term price moves. Bollinger Bands consist of a centerline and two price channels or bands above and below it. The centerline is typically a simple moving average while the price channels are the standard deviations of the stock being studied. The bands expand and contract as the price action of an issue becomes volatile (expansion) or becomes bound into a tight trading pattern (c
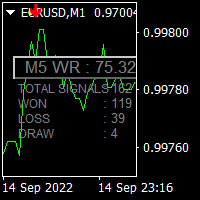
Hi Trader, We are strategy development for Binary and Forex tools, our product have success for binary trading 1 min - 2 min experation. At the moment most of Binary Broker apporev trading with experation conctract 15 minutes and more. We launch MilowLima Indicator for trading 5 minutes to 15 minutes experation is mean can trade from 5 minutes - 15 minutes. Specification of MilowLima trading binary option: Work with specifict time so default setup for Broker use Time Zone GMT+3 auto DST. (exampl

MACros is based on Exponential Moving Average Crossover:
It can be used for: All Pairs: Forex, Cryptocurrencies, Metals, Stocks, Indices. All Timeframe All Brokers All type of Trading Style like Scalping, Swing, Intraday, Short-Term, Long-Term etc. Multiple Chart
***MT5 Version -->> https://www.mql5.com/en/market/product/87474
Notification Setting: All type of notifications and Pop-Up available with this Indicator. (Can manually ON/OFF the notification as per requirements.)
Special Note: I

What Is The Buy OR Sell MT4 Indicator? As the name suggests, the Buy-Sell Indicator is an indicator that tells traders about when to take the buy and sell position on the Forex price chart. This tool is a preference of many traders because it can provide solid indications of the trend and its reversals. In addition, it helps them simplify the hassle of choosing one or more indicators because this one tool alone is enough to provide them with a straight answer. When you apply this indicator
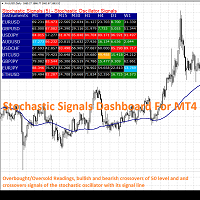
Stochastic Signals is a simple dashboard type indicator that displays the values of the stochastic oscillator on various instruments and time frames chosen by the user. The stochastic is usually used in many trading strategies, especially in countertrend systems when the price reaches overbought/oversold conditions. In addition, this indicator can be configured by the trader to show signals when the stochastic oscillator is in an overbought/oversold condition, when it crosses these levels or whe

This indicator uses 2 trend filters. Great for scalping. Features alerts Settings: TrendFilterPeriod1 TrendFilterPeriod2 How to use: Attach to any chart with default settings, or set to your preference. Can be used on any time frame. If used on lower time frames, check higher time frames too. Buy : - Blue histo color. Sell : - Red histo color. Or backtest and use as you see fit for your strategy. Best results on Major Pairs, but can also be used on other pairs (Metals, Minors).
Important to not
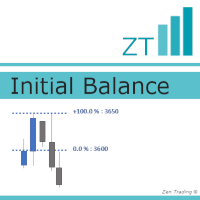
Initial Balance is a concept for the first hour of a trading session, lowest(starting) to highest point, that often determines important support / resistance for the next hours. It is based on Fibonacci levels and offers very relevant levels of reaction. Nowadays, it's mainly used for the first hour BEFORE the open. --------------- The advantage of this indicator lies here : - you could define by yourself the period for YOUR Initial Balance (first hour of a trading session, one hour before the o

FREE

Scanner and Dashboard for Money Flow Index for MT4 The Money Flow Index (MFI) is a technical oscillator that uses price and volume data for identifying overbought or oversold signals in an asset. It can also be used to spot divergences which warn of a trend change in price. The oscillator moves between 0 and 100. Advantages of the Scanner: - Full Alert Options. - Multi Timefrare - Works for all instruments including Currencies, Indices, Commodities, Cryptocurrencies and Stocks. - Fully customis

The purpose of the Combo OnOff indicator is combine differerent tecniques and approachs to the market in order to spot signals that occur simultaneosly. A signal is more accurate if it is validate from more indicators as the adaptive expectations can be used to predict prices.The On-Off feature and alarms help to look for the better prices to enter/exit in the markets
Moving Averages are statistics that captures the average change in a data series over time
Bollinger Bands is formed by upper

訂閱指標注意事項 此信號只支援電腦版MT4 不支援MT5、手機、平板 指標只顯示當日進場箭頭 非直播指標顯示歷史箭頭 (直播為展示用) 指標為交易輔助性質 非EA自動交易 無跟單功能
指標只標示進場位置 無出場(止盈)指示
進場止損點位設定30-50 PIPS 或是前高前低做為防守 止損不需拉太遠
紅色箭頭為多方進場訊號 綠色箭頭為空方進場訊號 撐阻力強度用箭頭大小表示 此指標適用於波段策略 不適合當沖策略盤整 多空反轉時不適用
指標載入後 右下角都會預設顯示盤整 載入指標一小時後 才會顯示多空
加入Youtube頻道會員 可參加每個月一次實體抽獎活動(台灣以外地區,獎品折現金用Paypal匯出) 每月抽獎時間為非農數據公布當週的週末盤勢分析(2100) 得獎者必須抽獎時在線上,逾期不候
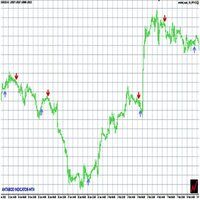
Antabod indicator is a trading system worth being sold for $999, but now $120. For a short period of time the price is now reduce to $60, but may soon go back up to $120 . This forex indicator analyzes the price behavior on the chart every second and determines the ideal entry points, based on the built-in algorithm, informing you when you need to open a deal and close it, to take profit.
It catches very fast and profitable price movements and gives you easy BUY/SELL signals, by Up and Dow
This indicator shows the current direction of the market, the moments of reversal and the levels the market can reach. The development is based on years of experience and on the most advanced concepts of fractal analysis, so it adapts to every market and every time frame. The most impressive property is the ability to draw the levels that the market can reach with dozens of bars in advance.

Szia! Egy indikátorral. Több idő gyertyájának kirajzoltatása egy charton. Különböző színek rendelhetők a long és short gyertyákhoz. Vonal vastagsága állítható. A gyertya kitöltése engedélyezhető. Hello! With an indicator. Drawing multiple time candles on a chart. Different colors can be ordered for long and short candles. Line thickness can be adjusted. Filling the candle can be allowed. Videó: https://www.youtube.com/watch?v=-9bequnAw-g& ;ab_channel=GyulaKlein

Tool for candle information. It allows to show the user information related to the candle when hovering the mouse over it. It has a simple interface. The user can modify its style by changing the colors in the input parameters.
Show data like: Candle date and time Open price of candle Close price of candle Highest candle price Lowest candle price Candle volume
FREE
Are you looking for a reliable support-resistant indicator to help you trade? Look no further! Our support resistance indicator is designed to make your trading experience easier and more efficient. With our indicator, you can find high-probability support and resistant zones and stay on top of the market, so you can take high-probability trades. Try it now and see the difference! support and resistance is the key element in trading just by identifying support and resistance correctly and using

Floating peaks oscillator - it the manual trading system. It's based on Stochastik/RSI type of oscillator with dynamic/floating overbought and oversold levels. When main line is green - market is under bullish pressure, when main line is red - market is under bearish pressure. Buy arrow appears at the floating bottom and sell arrow appears at floating top. Indicator allows to reverse signal types. Main indicator's adjustable inputs : mainTrendPeriod; signalTrendPeriod; smoothedTrendPeriod; tre

Trend speed vector - is the oscillator for manual trading. System measures trend direction and it's speed. Histogram shows 4 colors: Lime --> Strong up movement with good gain speed; Green --> Up movement with low gain speed Red --> Strong down movement with good gain speed; Orange --> Down movement with low gain speed Green and Orange histograms show weak market's movements and thуese places excluded from signal points. Buy arrow is plotted during strong down movement when bearish gain speed i

Floating gain meter is the manual trading system that works with local trends and it's scalping. Histogram represents bull/bear floating trend gain. Green color histogram shows choppy market with bullish pressure, Orange - shows choppy market with bearish pressure. Lime and Red colors shows "boiled" places in market. As a rule buy arrow is placed after strong Down movement when it's power becomes weak and choppy market starts. And sell arrow is plotted after strong Up movement when it's power

Pullback points indicator - is the manual trading system, that shows most popular market prices. Indicator measures bull/bear waves pressure and looks for "consensus" prices. As a rule these points are crossed up and down very often and opened trade has several chances to be closed in positive zone. Mainly, such points is the good base for "common profit" types of strategies. Indicator also represents "common profit" scalping method of trading as default one. Main Indicator's Features Signa

Noize Absorption Index - is the manual trading system that measures the difference of pressure between bears forces and bulls forces. Green line - is a noize free index that showing curent situation. Zero value of index shows totally choppy/flat market.Values above zero level shows how powerfull bullish wave is and values below zero measures bearish forces.Up arrow appears on bearish market when it's ready to reverse, dn arrow appears on weak bullish market, as a result of reverse expectation. S

View the institutional support and resistance on every time frame with alerts on and off buttons for each timeframe for instant chart decluttering. Monthly, Weekly, Daily, 4hour, 1hr, 30 min, 15min,5min etc. Ability to change colors each timeframe Solid or Outline Use bottom or top of Order Blocks as stop loss = defined risk
My Trading Story Began in 2013 in the wild west of the crypto market, I’ve spent over $10,000 on trading courses and what I've learned from this experience is that many

This indicator shows the breakeven line level for the total number of open positions of the current symbol with P/L value and total volume. This indicator is helpful to decide the exit level when using a trading grid strategy. The style of the breakeven line is customizable to choose the color, line shape and font size of the positions description. Send mobile notification when crossing a positive P/L target
FREE

The Golden Target Indicator is a forex trading tool that displays important market levels on the charts. These levels include: buy and sell areas, overbought and oversold levels, extreme levels, reversal levels and middle level. The price will most likely react at these levels so plan your forex trades accordingly. The Golden Target Indicator fits all kinds of timeframes and currency pairs. It is displayed directly on the main trading chart. The default settings can be modified directly fr

Easy Technical Indicator is a powerful tool to detect the market trend and its strength . in addition, The signal Line reduce volatility and convert main trends to reliable Buy or Sell Signals --- Contact me in messages for free gift after purchase! --- HISTOGRAM:
It shows the main trend of the market. A histogram above zero means that the market is bullish A histogram below zero means that the market is bearish The height of the histogram bars indicates the strength of the trend weak,
MACD EXPLANATION Moving average convergence divergence (MACD, or MAC-D) is a trend-following momentum indicator that shows the relationship between two exponential moving averages (EMA's) of a price. The MACD is calculated by subtracting the 26-period exponential moving average (EMA) from the 12-period EMA. macd is one of the best momentum indicators macd is used by a lot of professional traders when it comes to continuous trade macd is the best choice if used properly even a ne

ONLY FOR FX MAJOR PAIRS Neural Oscillator is a later evolution of Neuro Scalper found here https://www.mql5.com/en/market/product/72342 It is a cluster signal, a better oscillator than a more traditional one like MACD. Neural Oscillator adds a divergence with momentum type signal compared to Neuro Scalper. Attach to charts. Entry arrows are at 100 for buy and -100 for sell. Example set up in the comments. Simple rules. Trade this as a stand alone system. How to trade: Trade during Act

PLEASE NOTE: You can customize the settings of all 3 EMA as per your requirement. The accuracy will change as per your settings.
100% Non repaint Pre-alert (get ready) signals Non-delay indications 24/7 signals 100% No lag No recalculating Lifetime license This is a EMA crossover indicator and its 100% non repaint indicator. The EMA_1 and the EMA_2 is based on which signal is generated. EMA_3 is a Higher EMA value which will remain below or above the candle (market) to identify the trend. Me

MACD divergence Simple edition 原始MACD计算方式,升级为双线MACD,使判断更加直观更加贴合大宗交易平台的研究习惯,同时还会自动用实线标出背离,不用再从0开始苦学钻研。
同时,我还提供了提醒服务,在你忙于家务无暇顾及的时候只需要打开音响,一旦达成背离,第一时间就会让你知晓。
这是一款简单版的看背离指标,MACD的九天均线被称为“信号线”,然后绘制在MACD线的顶部,它可以作为买入和卖出信号的触发器。当MACD越过信号线时,交易员可以买入操作,当MACD穿过信号线以下时,交易者可以卖出或做空操作。移动平均收敛-发散(MACD)指标可以用几种方法解释,但更常见的方法是交叉、散度和快速上升/下降。
FREE

Support/Resistance Percent Rank
SR Percent Rank helps to see how many times the current close price has been in the past price range. SR Percent makes a loop over x bars into the past and calculates the percentage of times the current closing price has been between the high and the low price in the x bars before that. So we can determine if the current price is moving at supports or resistance that was formed in the past. I use the indicator when creating strategies with the StrategyQuant X pr
FREE
蜡烛剩余时间和价格根据行情的涨跌,变换不同颜色.当行情发生变化,就会发生颜色变更,在涨时为一种颜色,在跌时变为另外一种颜色。可以根据颜色的变化知道这一跳是涨还是跌。如果一直为同一颜色,说明现在正在加速进行涨或者跌。 蜡烛剩余时间和价格根据行情的涨跌,变换不同颜色.当行情发生变化,就会发生颜色变更,在涨时为一种颜色,在跌时变为另外一种颜色。可以根据颜色的变化知道这一跳是涨还是跌。如果一直为同一颜色,说明现在正在加速进行涨或者跌。 蜡烛剩余时间和价格根据行情的涨跌,变换不同颜色.当行情发生变化,就会发生颜色变更,在涨时为一种颜色,在跌时变为另外一种颜色。可以根据颜色的变化知道这一跳是涨还是跌。如果一直为同一颜色,说明现在正在加速进行涨或者跌。

KT Price Border 创建了一个由三条带组成的价格通道,用于识别市场中的潜在高点和低点。这些水平还可以用作动态市场支撑和阻力。 中间带还可以用于识别趋势方向,因此它也可以作为趋势跟踪指标。此外,其简单易用的特点以及清晰的交易信号,使新手交易者受益匪浅。
功能特点
适用于大多数外汇货币对。 可用于低时间框架和高时间框架。 适用于剥头皮交易、日内交易和波段交易。 支持趋势交易和逆势交易策略。 当价格突破价格带时,可发送提醒通知。 价格带还可作为动态支撑和阻力水平。
理解价格边界的概念 该指标的工作原理类似于布林带。下轨表示市场超卖区域,同时充当动态支撑。 上轨表示市场超买区域,同时充当动态阻力。中间带用于确定趋势方向。 如果价格收于中间带上方,则表明市场仍处于上升趋势;相反,如果价格收于其下方,则表明市场仍处于下降趋势。
专业建议 使用 KT Price Border 进行交易时,可以自由选择自己偏好的入场、止损和止盈方法。 与任何指标一样,应遵循更广泛的市场趋势,并在模拟账户上进行练习,直到完全掌握。请记住,即使是最好的交易指标,在长期交易中也无法保证 100% 的胜

在MetaTrader中,绘制多个 水平线 并跟踪各自的价格水平可能非常麻烦。该指标可自动在等间距位置绘制多个水平线,用于设置价格提醒、标记支撑和阻力位以及其他手动操作。 这个指标非常适合刚接触外汇交易的新手,帮助他们寻找买卖机会并实现快速获利。无论市场处于趋势中还是震荡状态,水平线都能帮助交易者识别潜在的进出场区域。
功能特点 可根据输入参数中的预设,瞬间绘制多个水平线。 使用鲜明的色彩主题,区分不同的水平线。 是追踪多个交易时段价格区间的必备工具。 当价格触及某条水平线时会自动发出提醒。 可设置提醒之间的间隔,避免重复提醒造成干扰。 支持完全自定义设置。
说明 该指标根据输入参数中的配置自动绘制水平线。观察价格在这些水平线附近的反应,可以帮助识别关键支撑/阻力位附近的潜在交易机会。 例如,在水平支撑位形成一根看涨Pin Bar,通常意味着价格可能会继续上涨,朝最近的阻力位移动。 若价格以一根看跌K线收盘于支撑位下方,则可能表明刚刚发生了一个下行突破。而在水平线上发生的假突破,则说明价格未能突破关键水平,可能即将反转方向。 一些价格反转形态(如Pin Bar或假突破)对于
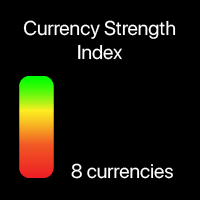
当前8种主要货币的实力 我的 #1 多功能工具: 包含66+个功能,包括此指标 | 如有任何问题,请联系我 | MT5版本 该指标显示在单独的窗口中,可以移动到图表上的任何位置。 在输入设置中 您可以调整: 界面主题 :深色 / 白色; 前缀和后缀, 如果您的经纪商的货币对有这些:
(例如,如果符号是 "EURUSD .pro ",请将 " .pro " 设置为后缀); 面板大小 字体大小 我的 #1 多功能工具: 包含66+个功能,包括此指标 | 如有任何问题,请联系我 | MT5版本 我的 #1 多功能工具: 包含66+个功能,包括此指标 | 如有任何问题,请联系我 | MT5版本 我的 #1 多功能工具: 包含66+个功能,包括此指标 | 如有任何问题,请联系我 | MT5版本
//---
供需区:价格在过去多次接近的可观察区域。 多功能工具: 66+ 功能,包括此指标 | 联系我 如有任何问题 | MT5 版本 该指标显示价格可能再次反转的区域。 通常,价格被拒绝的次数越多,该水平越重要。 在输入设置中 您可以调整: 启用或禁用 弱势区域; 显示或隐藏 区域描述; 字体大小; 设置 基本颜色: 分别针对支撑和阻力:
选定的颜色对于弱势区域会较不强烈,从而在视觉上帮助您分析图表; 多功能工具: 66+ 功能,包括此指标 | 联系我 如有任何问题 | MT5 版本 多功能工具: 66+ 功能,包括此指标 | 联系我 如有任何问题 | MT5 版本 多功能工具: 66+ 功能,包括此指标 | 联系我 如有任何问题 | MT5 版本 多功能工具: 66+ 功能,包括此指标 | 联系我 如有任何问题 | MT5 版本
过去 4 周每个交易日的绝对波动性 我的 #1 多功能工具: 包含 66+ 项功能,包括此指标 | 如有任何问题,请联系我 | MT5 版本 该指标显示在单独的窗口中,可以移动到图表上的任意位置。 在输入设置中 您可以调整: 界面主题 :深色 / 白色; 计算方法: 价格,点数,百分比,% 变化;
面板大小 字体大小 我的 #1 多功能工具: 包含 66+ 项功能,包括此指标 | 如有任何问题,请联系我 | MT5 版本 我的 #1 多功能工具: 包含 66+ 项功能,包括此指标 | 如有任何问题,请联系我 | MT5 版本 我的 #1 多功能工具: 包含 66+ 项功能,包括此指标 | 如有任何问题,请联系我 | MT5 版本 我的 #1 多功能工具: 包含 66+ 项功能,包括此指标 | 如有任何问题,请联系我 | MT5 版本
M1 箭頭倒賣 - 顯示 M1 週期的信號,不重新繪製入場點,並且適用於所有主要貨幣對 + 金屬(黃金/白銀)。該指標使用確定價格模式的算法分析市場,並向交易者顯示圖表上的價格反轉點。紅點表示價格會下跌,藍點表示價格會上漲。該指示器還以 PUSH 通知的形式向手機發送信號。因此,您無需一天 24 小時都坐在 PC 附近。您可以開展業務,但當出現價格反轉時刻時,指標會在您的手機上向您發送通知。您不會在 Internet 上免費找到這樣的指標。指標信號在不同貨幣對上的準確率從 71% - 94%。該指標適用於 M1 週期,但如果您在 H1 和 H4 等大周期進行交易,該指標也會很好地顯示它們的信號。
指標的好處: 取決於貨幣對的信號准確度從 71 - 94% 不重繪其信號 適合在 M1 期間剝頭皮 可以確定所有主要貨幣對的價格反轉點 通過電話向交易者發送信號 如何使用該指標進行交易: 當指標畫出紅點時,價格下跌的可能性為 71 - 94% 。 當指標在圖表上畫一個藍點時,價格有 71 - 94% 的機會上漲。 指標設置: Gap - 從價格點到點的距離。在這裡,您可以設置指標在離價

Gold Scalping Indicator - an indicator for intraday trading on XAUUSD gold. The indicator determines price reversal points and draws signals on the chart. The indicator also sends signals to the phone. When the indicator draws a red dot, it means that the price may turn down now. When the indicator draws a blue arrow, it means that the price may turn up now. Given this information, every trader will be able to build an effective trading system on gold. Gold is a very liquid instrument that is w

XFlow shows an expanding price channel that helps determine the trend and the moments of its reversal. It is also used when accompanying transactions to set take profit/stop loss and averages. It has practically no parameters and is very easy to use - just specify an important moment in the history for you and the indicator will calculate the price channel.
DISPLAYED LINES ROTATE - a thick solid line. The center of the general price rotation. The price makes wide cyclical movements around the

Levels indicator. It works on a neural network and is formalized according to professional rules for building horizontal levels. The indicator redraws the levels every day and notifies you when the price approaches or cross the levels. The indicator is suitable for both professionals and beginners who have only recently begun to learn how to trade in the market. PrimeTools is a series of products designed for correct and professional trading. [PrimeTools Levels | PrimeTools Range ]
Panel Shows

Having trouble marking where the various forex sessions start and end? Or perhaps your strategy requires you trade only in a specific session, then this is for you.
The session indicator shades the session you require in a certain color so that you can identify it easily. The sessions shown include: London session, New York session, Asian Session, Asian - London overlap and London - New York Overlap.
Difference source give varying time ranges for the various session, mostly differing by not mo
FREE

# 33% off - limited time only #
ChartSync Pro MT4 is an indicator, designed for the MetaTrader 5 trading terminals. It enables the trader to perform better multi-timeframe technical analysis, by synchronizing symbols and objects into virtually unlimited charts. Built by traders for traders! Telegram Premium Support - Dd you purchase the Chart Sync indicator and need a bit of help? Send us a screenshot with your purchase and your Telegram ID so we can add you to our premium support Telegram

TPM Cross (trend power moving cross) - is a trend following strategy based on custom signal points. Indicator consists from main custom moving chart line and trend power line. Indicator defines up and down movements by it's trend power and custom moving direction. When current market's trend looses it's power and opposite trend starts - power trend line crosses moving and indicator plots an arrow. Main indicator's adjustable inputs : movingPeriod - period of moving line trendPeriod - period

Impulse fractals indicator - is counter-trend oriented complex market fractal pattern. Market creates bull/bear impulse, trend starts, fractals on impulsed wave are an agressive pullback signals. Buy arrow is plotted when market is bearish and it's impulse showed up-side fractal, and sell arrow is plotted when market is bullish and it's impulse showed dn-side fractal. Main indicator's adjustable inputs : impulsePeriod - main period of impulse histogram filterPeriod - smoothes impulse accordi
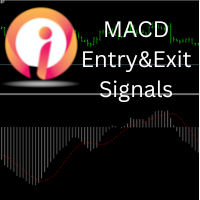
This indicator will show Entry and Exits using MACD and Moving average crossover. User can change settings to find best results from back testing. Profits and losses on candle close price is calculated and shown on screen of chart. Here any MACD settings and any Moving average crossover exit settings on various charts and various timeframes can be used. Watch video for few tests performed. Best wishes for trading.

Wicks UpDown Target
Choppy movement up and down on the opening range every day. Trading breakouts on London session and New York session is recommended. Wicks UpDown Target is specialized in all forex pairs.
Guideline Entry Strategy Idea:
Step 1 - Breakout Forming (Warning! Trade on London Session and New York Session) Step 2 - Breakout Starting (Take Action on your trading plan) Step 3 - Partial Close your order & set breakeven (no-risk) Step 4 - Target complete Step 5 - Don't trade in Sto

KT Forex Trend Rider uses a trend following algorithm developed specifically for the Forex market to provide reliable buy & sell signals across the major currency pairs. It works best on major FX pairs and all time-frames.
Features
It comes with a Multi-Timeframe scanner that can search for upcoming signals across all the time-frames. It comes with four preset profiles to facilitate trading for scalpers, tick-trend, swing, and trend traders. It marks the potential reversal points in the market.

Session Killzone Indicator
Indicator that helps you to identify the killzone times of both London and NewYork sessions which usually is the most times for high volatility and taking liquidity from the market. Killzone times are configurable through indicator parameters. The indicator adjusts the range of the killzones based on the daily trading range.
FREE
The KT De Munyuk is a trend-based indicator that uses Parabolic SAR to identify the market direction. The indicator shows the PSAR in the form of green/red dots using a separate window. Buy Signal: When a green dot appears after a series of at least three red dots. Buy Exit: When a red dot appears on the current or next higher time frame. Sell Signal: When a red dot appears after a series of at least three green dots. Sell Exit: When a green dot appears on the current or next higher

KT XMaster Formula is a buy & sell signal indicator that works magically on most of the timeframes and currency pairs when used correctly.
The indicator uses calculations based on moving averages, RSI, and MACD. It is usually appropriate for scalping and trend trading - whether you are a novice or an experienced trader, the signals generated by this indicator are simple to understand and implement.
Overview The indicator comprises green and red dots arranged in wavy lines. These dots correspo
MetaTrader市场提供了一个方便,安全的购买MetaTrader平台应用程序的场所。直接从您的程序端免费下载EA交易和指标的试用版在测试策略中进行测试。
在不同模式下测试应用程序来监视性能和为您想要使用MQL5.community支付系统的产品进行付款。
您错过了交易机会:
- 免费交易应用程序
- 8,000+信号可供复制
- 探索金融市场的经济新闻
注册
登录