适用于MetaTrader 4的新技术指标 - 57

VWAP Bands gives you the regular Volume-Weighted Average Price and also the deviation bands.
Use this indicator to see the possible amount of market movement, find support and resistance lines, find good spots for entry and exit, and the most important feature is to find possible pivot points.
This indicator has been mathematically improved by Rira team. The calculation begins at the start of each trading day
The indicator highlights the value in "over Sold" and "over Bought" zones. in addition, arrow indicates the return of the value from the extreme zone. Indicator can be easily customized by the user including change of colors, with, levels and arrows. Combination with other market signals and analysis is necessary and provides more stable results. Alert is also available for user.
FREE
The SmartZigZag indicator is a generated system for successful trading, consisting of two indicators - a modified ZigZag and a trend indicator. The system automatically determines the expected reversal levels of the chart price, and also, using the Alert function, gives signals about a favorable situation for buying or selling. Has simple and straightforward settings. It can work in all foreign exchange and non-foreign exchange markets. Any timeframe.
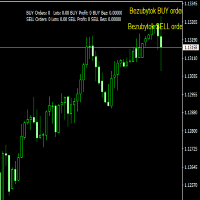
The Breakeven indicator is based on determining the breakeven levels of orders for a given instrument.
The indicator draws the breakeven level of BUY orders, the breakeven level of SELL orders.
If the number of lots between BUY orders and SELL orders between each other, the indicator draws the ALL breakeven level.
Drawing of levels is disabled in the indicator menu.

Please contact me at telegram https://t.me/smartforex7 After purchasing SmartForex Indicator then Use This Indicator...................... SMART EXIT PROFIT LINE Indicator is very Helpful with SmartForex Indicator ........................................ SMART EXIT PROFIT LINE Indicator Attach with SmartForex Indicator after then Red Line Show Exit buy Profit , Green Line show Exit Sell Profit................
FREE
Highly configurable MFI indicator. Features: Highly customizable alert functions (at levels, crosses, direction changes via email, push, sound, popup) Multi timeframe ability Color customization (at levels, crosses, direction changes) Linear interpolation and histogram mode options Works on strategy tester in multi timeframe mode (at weekend without ticks also) Adjustable Levels Parameters:
MFI Timeframe: You can set the current or a higher timeframes for MFI. MFI Bar Shift: you can set th
FREE
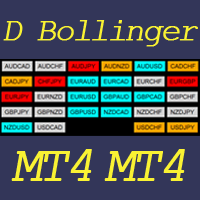
This indicator helps to visualize the Bollinger Band status of 28 pairs. With the feature of color panel, alert, and notification features, user can catch the potential Bollinger Bounce opportunities from 28 main pairs on one Dashboard quickly. Dashboard Bollinger Band is an intuitive and handy graphic tool to help you to monitor all 28 pairs and provide trading signals based on the Bollinger Bounce Rules (Overbought/Oversold and Bollinger Band Cross). COLOR LEGEND:
clrOrange: price is above th
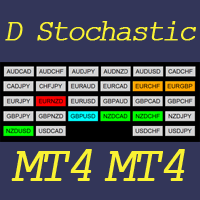
This indicator helps to visualize the Stochastic status of 28 pairs. With the feature of color panel, alert, and notification features, user can catch the potential buy and sell opportunities when the 28 main pairs cross the oversold/overbought area on one Dashboard quickly.
Dashboard Stochastic is an intuitive and handy graphic tool to help you to monitor all 28 pairs and provide trading signals based on the Stochastic Classic Rules (Overbought/Oversold and Stochastic Cross).
COLOR LEGEND:
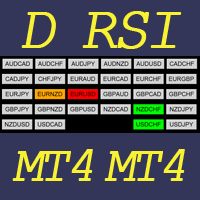
This indicator helps to visualize the RSI status of 28 pairs. With the feature of color panel, alert, and notification features, user can catch the potential buy and sell opportunities when the 28 main pairs cross the oversold/overbought area on one Dashboard quickly. Dashboard RSI is an intuitive and handy graphic tool to help you to monitor all 28 pairs and provide trading signals based on the RSI Rules (Overbought/Oversold and Stochastic Cross). COLOR LEGEND:
clrOrange: RSI signal is above t
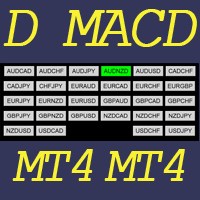
This indicator helps to visualize the MACD status of 28 pairs. With the feature of color panel, alert, and notification features, user can catch the potential buy and sell opportunities when the 28 main pairs’ fast EMA cross the slow EMA on one Dashboard quickly. Dashboard MACD is an intuitive and handy graphic tool to help you to monitor all 28 pairs and provide trading signals based on the MACD Rules (Fast EMA Cross Slow). COLOR LEGEND: clrRed: MACD fast EMA down cross MACD slow EAM and MACD f
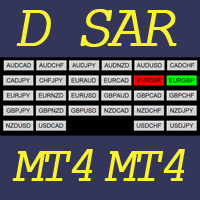
This indicator helps to visualize the SAR status of 28 pairs. With the feature of color panel, alert, and notification features, user can catch the potential buy and sell opportunities when the 28 main pairs’ SAR dots are switching between the above/below of candles on one Dashboard quickly. Dashboard SAR is an intuitive and handy graphic tool to help you to monitor all 28 pairs and provide trading signals based on the SAR Rules (SAR dots are switching between the above/below of candles). COLOR
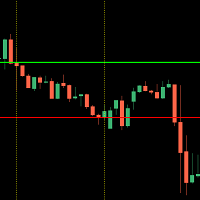
This indicator shows you the higher high and lower low of a certain period of time.
It is easy to use - select your desired time frame (current, 15Min, 1H, 1D) and the corresponding number of candles.
The indicator measures the highest and lowest point within the specified range and automatically draws the two corresponding lines.
The design of the lines is up to you!
Should the trend break one of the drawn lines with a closed candle, a message will be sent to you by the built-in alarm f

This indicator Matic Pro indicator.Indicator displays trend movement. Indicator helps to buy and sell. The indicator shows the movement of sak1 and sak2 Stddevchannel, Regression + zak2 indicator. Features HLper - displays indicator iHighest and iLowest period. ExtDepth - displays indicator ExtDepth. ExtDeviation - displays indicator ExtDeviation. ExtBackstep - displays indicator ExtBackstep. p - line indicator bars back.(bars back= zak2)
m - regression.(1-8),the best(2-3)
i0 -line indicator b
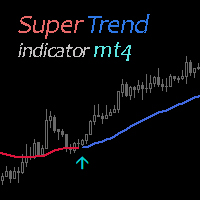
Super Trend Indicator uses two moving averages for calculating the trend direction. Combination with other market signals and analysis is necessary and provides more stable results. Indicator can be easily customized by the user including change of colors, with and arrow sizes.
FREE Super Trend Expert Advisor > https://www.mql5.com/en/market/product/81160?source=Site +Profile+Seller
developed, tested and optimized on " VantageMarkets " platform. Recommended broker > Vantage open a
FREE
不同的经纪人和不同类型的账户可以具有不同的点差值(买入价和卖出价之间的差异),这已经不是什么秘密了。 在这种情况下,同一个专家顾问将以完全不同的结果进行交易。 符号的点差越大,您获得的利润就越少,经纪人从您那里获得的利润就越多。 因此,测量点差对于选择经纪人和账户类型非常重要,特别是对于剥头皮,午夜和盘中策略。
一个简单但可靠的指标从无限将帮助您跟踪任何符号的传播在任何经纪人!
只需在任何图表上安装散点计指示器(建议使用 M1-H1)。 传播米跟踪并记住最大的最小和平均传播变化.
图表底部的散点计指标直方图实时累积历史记录。 因此,经常使用指标很重要。 建议使用VPS或具有永久互联网连接的计算机。
散射仪指示器的参数:
Low/high level -高点差和低点差之间的范围
Save spread data -参数,用于在指示器内存中保存spread data
(抱歉文本的自动翻译)
FREE
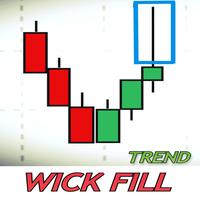
-蜡烛芯填充趋势概念
在市场的高波动性事件中,蜡烛往往会在其移动过程中产生灯芯。蜡烛图中的灯芯反映了价格的拒绝。大多数情况下,这些蜡烛芯被填满是因为有巨大的成交量向该方向推动。烛芯填充趋势扫描那些专注于趋势市场的机会。
它有一个成功率模拟器仪表板,显示带有进入点、获利和止损的实时信号。这个成功率模拟器可以作为回溯测试,检查哪些输入在过去有更好的利润。它计算点数和百分比的利润,根据过去的表现给出一个整体的概念,什么是最好的参数。
- 投入
-趋势阀芯。这个输入决定了指标所要扫描的阀芯的大小。它是以百分比来衡量的。它的默认值为20%。
-信号的数量。这是成功率模拟器所要扫描的信号数量。
-移动平均数。这个过滤器是移动平均线指标和RSI的组合。用户有机会根据自己的需要设置RSI和移动平均线。
-前一栏方向。这个功能可以避免或允许基于前一根蜡烛的信号。如果是真的,该指标将只考虑在前一根蜡烛是在相同的趋势方向上的灯芯作为信号。如果它是假的,它将考虑所有的灯芯。
-最后的高点和低点:该功能允许交易者在最后的 "x "条中扫描最后的高点和低点,以避免范围期。
-

The VWAP Level indicator is a technical analysis tool that calculates the weighted average price for the traded volumes of a specific asset. The VWAP provides traders and investors with the average price of an asset over a specific time frame.
It is commonly used by investors to compare data on "passive" trading operations, such as pension funds and mutual funds, but also by traders who want to check if an asset has been bought or sold at a good market price.
To calculate the VWAP level we
FREE
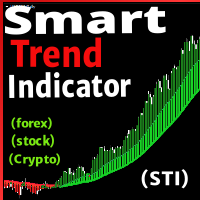
Information about this tool Generally: The Smart Trend Indicator STI is designed for the purpose of showing you the direction of the trend.
How it works It is based on moving averages.
The indicator works on all types of markets. The indicator works on all timeframes. The indicator works on all currency pairs. This indicator doesn't repaint. The light green histograms are for bullish trend. The green histograms are for fast buy signals. The light red histograms are for bearish trend. The d

The Katana indicator works like a charm with our other indicator called Trend Forecasting . When you have these 2 indicators, you can use an extraordinary strategy that we provide to you after purchase. Katana is a follow the trend indicator that sends you buy & alert signals. There is several possibilities on how you can use it. 1st Possibility: When market goes above middle line, it's a buy signal. When market goes below middle line, it's a sell signal. You can use it everyday for your ma
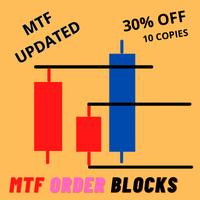
30% discounted ONLY 10 COPIES HURRY UP! 5 LEFT COPIES All Features now have in current version. Very precise patterns to detect High Accurate Order Blocks: It Draw zone after market Structure Breakout with a high Accuracy, institutional orders with the potential to change the price’s direction and keep moving towards it, have been placed. Features Auto Order Blocks Draw Market Structure BOS LINE Auto Imbalance Detect Auto Trend Detect MTF Order Blocks Double Signal One Alert Signal Second Lo

Reliable Tool for the Financial Market This tool delivers high-performance results in trading on financial markets. Advantages: Fast and Accurate Signals: The arrow signals of this tool are easily and accurately analyzed, providing quality signals that you can rely on. No Repainting: This tool does not have any repainting, ensuring reliable trading signals. Quality Guarantee: If any signal repainting is detected, which we cannot correct, we will refund your money without commission. Recommendat
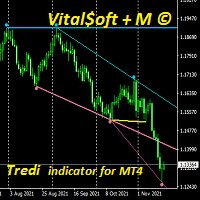
The indicator Tredi shows the direction of the price channel and its correction. The indicator shows the points of support and resistance of the price channel with thin lines, the thick lines show the narrowing or expansion of the price channel, as well as the simplest patterns - the triangle and the flag. Divergence confirms or refutes this direction. The indicator works on any charts and time frames, both on the currency exchange and others. Has clear and simple settings.

Currency Strength Gauge incicator
The currency strength gauge is an indicator to measure of the strength or weakness of currencies in the Forex market. Comparing the strength of currencies in a graphic representation will lead to a good overview of the market and its future trends. You will see in a graphic chart both the strength of the currencies and their correlation, and this will help you in your decisions to get better trades. -To easy detection of over Overbought and Oversold point

Infinity Indicator MT4 3.3 Panel Win Rate based on CandleMT4 Exit Button Calculates the StdDev standard deviation indicator on the RSI data, stored in the matrix similar to the keltner. input int HourCalculate = 12; RsiLength = 5; RsiPrice = PRICE_CLOSE; HalfLength = 4; DevPeriod = 100; Deviations = 0.9; UseAlert = true; DrawArrows = true; TimerWork=300; LevelUp = 80; LevelDown = 20; MoreSignals = true;

Moving Average Cloud draws 4 MAs on chart simultaneously in histogram style. Indicator uses 4 MAs: slow sma & ema 200 and fast sma & ema 50. the range between 2 slows MAs and Fasts, represented by histograms on the MAs boundaries - creating kind of "cloud" that can be traded by all kind of MA strategies like support & resistance or other... Change of color of the same histogram points to momentum changing.
Combined with other market analysis, can greatly improve trading results.
FREE
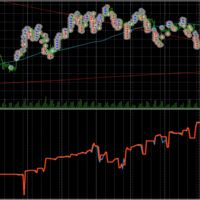
Graph shows your balance and equity in real time similar to the tester graph which is nice to see your real progress vs tester graph. This code was copied from mql5.com, it was free and it works im just putting it here to make it easier for us :-) https://www.mql5.com/en/code/13242
https://www.mql5.com/en/code/8454 .. original code
//+------------------------------------------------------------------+
//| Equity Monitor |
//| Monitori
FREE
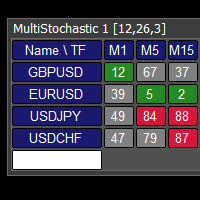
This tool monitors Stochastic indicators on all time frames in the selected markets. Displays a table with signals to open a BUY trade (green) or SELL trade (red). You can set the conditions for the signal. You can easily add or delete market names / symbols. If the conditions for opening a trade on multiple time frames are met, you can be notified by e-mail or phone message (according to the settings in MT4 menu Tools - Options…) You can also set the conditions for sending notifications. The li
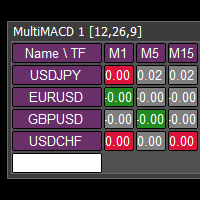
This tool monitors MACD indicators on all time frames in the selected markets. Displays a table with signals to open a BUY trade (green) or SELL trade (red). You can set the conditions for the signal. You can easily add or delete market names / symbols. If the conditions for opening a trade on multiple time frames are met, you can be notified by e-mail or phone message (according to the settings in MT4 menu Tools - Options…) You can also set the conditions for sending notifications. The list of
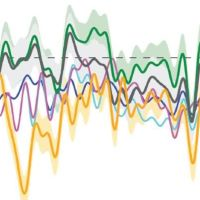
MA collection - мультитаймфреймовый индикатор, вобравший в себя множество разработок в сфере усреднения ценового ряда. Включает свыше 20-ти разновидностей индикаторов усреднения и более 10-ти единиц ценовых данных к которым может быть применено усреднение. В индикаторе предусмотрена цветовая и звуковая индикация смены тенденции. Методы усреднения: Simple Moving Average Exponential Moving Average Wilder Exponential Moving Average Linear Weighted Moving Average Sine Weighted Moving Average Triang

50+ Candlestick Patterns, Simulated Trading Results, Top Five Performers Candle Analysis extends Candlesticks Pattern Analysis by not only identifying Patterns but also recording the Past Performance of the Patterns. What it Does:- Identifies and plots results on chart Displays Top Patterns for both Bullish and Bearish type. Log can be printed in experts tab to see Simulated Trading results Displays All or Selected Patterns Alerts on Pattern formation More detailed information in Blog
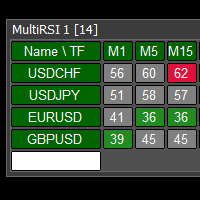
This tool monitors RSI indicators on all time frames in the selected markets. Displays a table with signals to open a BUY trade (green) or SELL trade (red). You can set the conditions for the signal. You can easily add or delete market names / symbols. If the conditions for opening a trade on multiple time frames are met, you can be notified by e-mail or phone message (according to the settings in MT4 menu Tools - Options…) You can also set the conditions for sending notifications. The list of s
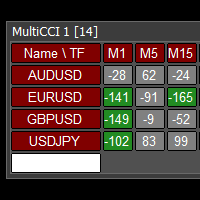
This tool monitors CCI indicators on all time frames in the selected markets. Displays a table with signals to open a BUY trade (green) or SELL trade (red). You can set the conditions for the signal. You can easily add or delete market names / symbols. If the conditions for opening a trade on multiple time frames are met, you can be notified by e-mail or phone message (according to the settings in MT4 menu Tools - Options…) You can also set the conditions for sending notifications. The list of s
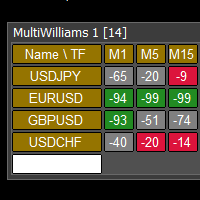
This tool monitors WilliamsPR indicators on all time frames in the selected markets. Displays a table with signals to open a BUY trade (green) or SELL trade (red). You can set the conditions for the signal. You can easily add or delete market names / symbols. If the conditions for opening a trade on multiple time frames are met, you can be notified by e-mail or phone message (according to the settings in MT4 menu Tools - Options…) You can also set the conditions for sending notifications. The li

This indicator Matic indicator.Indicator displays trend movement. Indicator helps to buy and sell. The indicator shows the movement of sak1 and sak2 Stddevchannel, Regression. Features HLper - displays indicator iHighest and iLowest period. ExtDepth - displays indicator ExtDepth. ExtDeviation - displays indicator ExtDeviation. ExtBackstep - displays indicator ExtBackstep. zak1_ST_RE - displays indicator zak1,Stddevchannel,Regression.(true,false) zak2_ST_RE - displays indicator zak2,Stddevchannel

This is an indicator for MT4 providing accurate signals to enter a trade without repainting.
It can be applied to any financial assets: Forex Cryptocurrencies Metals Stocks Indices It will provide pretty accurate trading signals and tell you when it's best to open a trade and close it. How do I trade with the Entry Points Pro indicator? Buy and install the indicator in your terminal Start trading by receiving signals from the indicator telling you about the ideal moment to enter a trade.
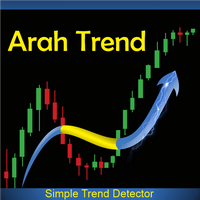
ARAH TREND is an indicator to detect the current trend, and predict next trend. Its very simple way to know trend because the display so clear. Trend changes are indicated by indicator color change. That's great as an entry point. The advantages of this indicator : - Beautiful Entry Points - No Need Setting - Suitable for all time frames - Geat for GBPUSD and Gold TF H1 - The display is simple and clear It can also be combined with your mainstay indicator so that the entry point is more acc
YOU CAN ONLY FOWARD TEST THIS INDICATOR. USE DEMO FOR THIS AND SHARE YOUR RESULTS This indicator is a combination of different strategies that in theory drive the market. Multi-Currency - Using the separate currencies; Euro and Dollar. RSI - from the separate currencies I get two different RSI values that are used to measure the market strength and direction It is important to note that this is not the Holy Grail and you should use a good money management system.
Two signals will appear from
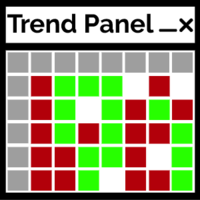
趋势面板是一个简单方便的工具,它将使用用户选择的十对显示时间帧 M1 - D1 的已确认趋势方向。
该指标旨在将方向确认添加到任何策略/模板中,然后还可以作为一个干净的交互式界面快速将图表更改为不同的货币对或时间范围。 群聊: https://www.mql5.com/en/users/conorstephenson 请在购买后与我联系以获取设置建议和免费专家顾问! 我的产品仅在 MQL5 上出售 ,如果您在其他任何地方看到此产品,那是仿制品。不要被愚弄 。 主要特点 清洁图表面板以快速帮助确定时间范围内的趋势方向。 交互功能。 更改图表蜡烛的颜色 - 轻松查看当前和过去的趋势。 点击配对和时间框架按钮可更改当前打开的图表。 单击图表上的面板并将其拖动到最适合您的模板设置的位置。 选择要显示的 10 对。 编辑面板中使用的颜色。 将与外汇对、指数、股票、加密货币... 提示新趋势开始的警报功能。 建议 当面板中的所有一个垂直列都是相同的颜色时,一对可以被认为是强烈趋势。 与策略/模板一起使用以获得时间框架趋势方向的视觉帮助。 输入定义 趋势模式。 更改蜡烛颜色 - True 将更
FREE
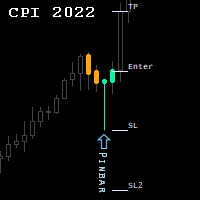
Candlestick Patterns Indicator.
NEW! FREE Candlestick Patterns Expert Advisor > https://www.mql5.com/en/market/product/105634?source=Site +Profile
The Indicator draws colored candlestick patterns, their description and future levels of Stop Loss / Take Profit. Combined with other market analysis, can greatly improve trading results. Indicator can be highly customized by the user including change of colors, fonts, levels, candle sizes etc...
developed, tested and optimized on " VantageM
FREE

Jacket is an arrow indicator for forex, futures and binary options without redrawing. Tracks the market trend, ignoring sharp market fluctuations and noise around the average price. Works only at open prices. Therefore, it is reliable and without redrawing. This indicator uses its algorithms to analyze previous periods and predict further market behavior. It is based on the calculation of levels with a certain period, which allows you to more accurately assess the situation. Often, signals that

America is a global trend indicator. If you do not have your own trading strategy yet, you can use our ready-made trading strategy. The indicator will help in finding entry points when analyzing the price chart. The program first receives a "snapshot" of the graph, then analyzes it. The results are communicated to the trader in the form of signals. The main purpose of this indicator is to determine the moments of entries and exits from transactions, therefore the indicator displays only the tre
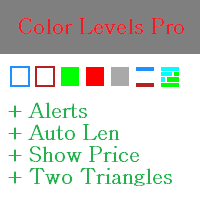
Color Levels Pro is a new version of the normal Color Levels. It allows setting two empty rectangles, three filled ones, two tredlines, and two triangles.
The indicator parameters are very simple and divided into blocks:
The ones beginning with 1 and 2 - empty rectangle (frame) parameters; 3, 4, and 5 - filled rectangle parameters; 6 and 7 - trendline parameters; 8 and 9 - triangle parameters. Simply click a desired object and it will appear in the corner.
Main Adjustable Parameters : C
FREE

Signal Eskiya, in addition to channel lines, reflects entry signals in the form of arrows. Trading strategies using the channel indicator belong to the classic methods of technical analysis, are easy to execute, and therefore available even to beginners. Price ranges work equally well on any trading assets and timeframes, they can be used both independently and with additional confirmation from oscillators and market volumes.
American traders say: “Trend is your friend”, which means “Trend is

The Trend Professor is a moving average based indicator designed for the purpose of helping the community of traders to analyse the price trend. The indicator will be displayed in the main chart as it is indicated on the screenshot section. How it works The indicator has lines of moving averages and colored histograms to depict the direction of the trend. There will be a fast signal line colored blue/yellow/red at some points. The red/yellow colored lines stands for bearish trend/signal while th

The Changend signal indicator works on all timeframes and any markets. Analyzes data in the specified period and gives signals for a possible trend change (sell or buy).
The indicator has only two settings: Period bars - the number of last bars for data analysis Deviation level of bars -the degree of deviation from the analyzed data Additionally, in the indicator settings, you can set your own style of signal display: Size Arrow Code Arrow Buy Color Arrow Buy Code Arrow Sell Color Arrow Se

RENKO on Time Chart
This indicator is an enhanced Renko, so you can watch the Renko bricks on the chart to understand price movement more clearly
the other improvement is automated box size according to ATR (Average True Range) period
you can set the ATR number as you want and the box size of Renko changes automatically based on price movement
Inputs
Mode: Box size is the input to specify the size of the Renko box you want to print on the chart. This input lets you choose the fixed b

The indicator searches for matches in history for a specified range of the latest known oscillated Moving Average data.
Found matches are indicated on the graph as colored fields. Analysis of historical data (the behavior of quotes in history) will help make decisions in trading.
The matches found are updated when a new bar is opened (i.e., the calculation is performed upon opening prices).
The value of the increase accuracy (Accuracy) must be changed with a decrease in the timeframe, and
FREE

Cloud Eyes is an advanced moving average alert that will easily monitor the price action based on set moving averages to multiple open charts. Objective: To monitor multiple open charts and notify traders conveniently in a single display panel when using the moving averages to enter/exit a trades. Features: Monitor price action in two timeframes at the same time Supports simple, exponential, smoothed, linear weighted moving averages Trigger an alert based on candle size (full/body length)
Ca

The indicator defines a trading corridor, a flat market, and corrections.
Allows you to compare the significance of different flat and trend areas (by time of existence and by volatility). This makes it possible to assess the market cycle and its mood at a glance.
That is, how long does the flat last on average, and how long is the trend and what kind of volatility they have in points.
As a rule, the longer the flat lasts, the more likely it is to accumulate the potential for a strong
Binary Options Assistant (BOA) BURST Signals Indicator provides signals based on Binary Trending Binary Options Strategy. Indicators: MACD Indicator & Schaff Trend Cycle Indicator
Stop missing trades, stop jumping from chart to chart looking for trade set-ups and get all the signals on 1 chart! U se any of the BOA Signals Indicator with the Binary Options Assistant (BOA) Multi Currency Dashboard . All BOA Signal Indicator settings are adjustable to give you more strategy combinations. The

Maximum Directional Index (MDI) is designed for two purposes. 1. To show the direction of the trend (The blue yellow trend line) 2. To show the Overbought (Resistance) and Oversold (Support) zones for a trader to know whether the trend is about to reverse or not. It shows the maximum direction of the price trend.
How it works 1. The indicator works on all time-frames but for clarity I recommend you use it on 5minutes, 15miutes, 30minutes, 1 hour and 4 hours time-frame charts. 2. The indicator
Binary Options Assistant (BOA) FLAME Signals Indicator provides signals based on the combination of: RSI, MACD & Stochastic Indicators
Stop missing trades, stop jumping from chart to chart looking for trade set-ups and get all the signals on 1 chart! U se any of the BOA Signals Indicator with the Binary Options Assistant (BOA) Multi Currency Dashboard .
All BOA Signal Indicator settings are adjustable to give you more strategy combinations. The signals can be seen visually and heard a
FREE

This indicator Mega Super indicator.Indicator displays trend movement. Indicator helps to buy and sell.In dicator displays arrow and line. Features per - displays indicator period.
How to understand the status: If the arrow color is green, trend is up. I f the arrow color is red, trend is down.
//////////////////////////////////////////////////////////////////////////////////////////////////////////////////////////////////////////////////// //////////////////////////////////////////////
Top Dog description AROON is one of the most Powerfull confirmation Indicator at all Times Our System we introduce is absolutly Beginner friendly and dont need a lot of expirience to make good Trades. For Beginner: use only Daily Timeframe ! You heard that 95% of all traders lose their money? because they mostly trade in smaller time frames and this is something for professional traders. With the AROON indicator you dont need expensive Expert Advisors or Indicator.
How its Work? 1. Use a

PW Oscillator - индикатор предназначенный для поиска локальных экстремумов, определения текущей тенденции. В расчетах индикатора используется авторская методика. С помощью индикатора можно определять места возможного разворота цены желательно в направлении тенденции, но также с достаточной точностью и против нее. Также с помощью индикатора можно определять текущую тенденцию. Индикатор подходит для любых валютных пар, но для адекватного отображения показания необходимо, чтобы было достаточно ис
Binary Options Assistant (BOA) COOL Signals Indicator provides signals based on the combination of: Fisher Oscillator & JRSX Indicator
Stop missing trades, stop jumping from chart to chart looking for trade set-ups and get all the signals on 1 chart! U se any of the BOA Signals Indicator with the Binary Options Assistant (BOA) Multi Currency Dashboard .
All BOA Signal Indicator settings are adjustable to give you more strategy combinations. The signals can be seen visually and heard a
Binary Options Assistant (BOA) FLAME Signals Indicator provides signals based on the combination of: RSI, MACD & Stochastic Indicators
Stop missing trades, stop jumping from chart to chart looking for trade set-ups and get all the signals on 1 chart! U se any of the BOA Signals Indicator with the Binary Options Assistant (BOA) Multi Currency Dashboard .
All BOA Signal Indicator settings are adjustable to give you more strategy combinations. The signals can be seen visually and heard a
Binary Options Assistant (BOA) FROST Signals Indicator provides signals based on the combination of: ADX Indicator & JRSX Indicator
Stop missing trades, stop jumping from chart to chart looking for trade set-ups and get all the signals on 1 chart! U se any of the BOA Signals Indicator with the Binary Options Assistant (BOA) Multi Currency Dashboard . All BOA Signal Indicator settings are adjustable to give you more strategy combinations. The signals can be seen visually and heard audible.
Binary Options Assistant (BOA) KAM Signals Indicator provides signals based on the combination of: 3 Moving Averages & Stochastic
Stop missing trades, stop jumping from chart to chart looking for trade set-ups and get all the signals on 1 chart! U se any of the BOA Signals Indicator with the Binary Options Assistant (BOA) Multi Currency Dashboard . All BOA Signal Indicator settings are adjustable to give you more strategy combinations. The signals can be seen visually and heard audible. Th
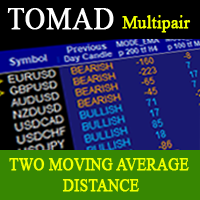
TOMAD (Two Moving Average Distance) is an indicator that can scan multi pairs, the data displayed on the indicator is in the form of a range of PIPs. This indicator is also equipped with information on the movement of today's candle and the previous day's candle formation.
In the input indicator settings, you can change it according to your needs, whether it's from the pair that will be displayed to setting the period, mode and MA price.

Market Fractal Analysis, Fractal Swing, Market Flow Fractal Cycles looks for Similar Patterns in the Market that repeat themselves because of the Market Fractal Nature. These patterns are displayed with help of Graphical Objects and Alerts can be received on their arrival. Read the Blog for full information. Features:- Auto Detection of Patterns Customization for Color and Line Styles Alerts, Emails & Push Notifications

JULY OFFER 80% OFF next price for unlimited version will be 17000$. This is the only time you can get this institutional and professional indicator at this price for unlimited version. Don't dare to miss this. The tool I am about to introduce to you you can't compare it with other tools due to its strategy and accuracy level in predicting the next price directional movement . This tool is designed for serious traders who have decided to make a difference through trading. Be the next person to wi
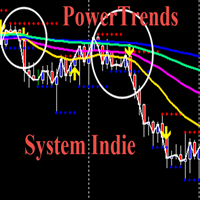
Power Trends System Indicator
Power Trends System Indicator is a custom indicator developed in line with a profitable trading system and it has been living up to its name.
It is a trending system carefully filtered to remove most of the downsides inherent in trend-following systems.
This is highly useful for those traders that are lazy to analyze the market but still want to make money from Forex market without stress.
The good news for any trader that comes across this system is that
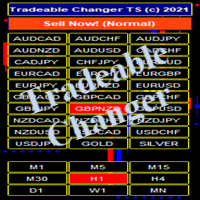
Tradeable Changer Indie
Trade-able Changer Indie is an indicator that serves several purposes. The idea behind this operating indicator is to have a minimal set of indicator
or experts on the chart in order to avoid clumsy chart window and at the same time have a great time trading profitably.
This is a combination of Symbol/Time-frame Changer and a Trading system based on Trends following.
It has a small board to display trade signals for the trader.
Due to the nature of these com
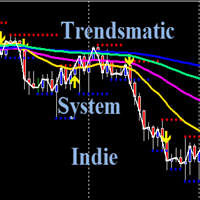
Trendsmatic System Indie Plus
Trendsmatic System Indie is an indicator that gives in-depth analysis of market trending on any currency pair as displayed
in the MT4's Market watch. It actually shows the states of the current candles and the trending positions on all higher
time-frames for a long term price trending movements.
This can give a trader a stupendous profits on a long term single trade with long stride trend movements in a specific
direction. It saves the trader some hassl

米 一黃牛系統 獨特的剝頭皮手動交易系統。該交易系統自動分析市場,確定價格反轉點,向交易者顯示何時打開和關閉訂單。 該系統在圖表上直觀地顯示了交易者需要的所有信息。 米 一黃牛系統 通過電話和電子郵件向交易者發送信號!因此,您無需一直坐在電腦前等待信號。當市場上出現開啟交易的良好信號時, 指標會自動向您的手機和電子郵件發送通知。 米 一黃牛系統 不重繪它的信號!這個交易系統是公平的。它不會重新繪製其信號,也不會根據市場調整它們。因此,當信號繪製在圖表上時, 它會一直存在,不會消失。 米 一黃牛系統 很容易設置。為了讓交易者盡可能輕鬆地工作,我們將設置數量減少到只有一個參數。現在使用一個參數時期 前任, 您可以自定義整個交易系統。通過將此參數從 三 更改為 五十,您可以更改系統的交易特性、其交易的積極性和信號的準確性。 交易系統設置米 一黃牛系統 百利得 管理機器人的交易分析。該值越高,信號越準確,但交易越平靜。值越低,交易系統開始工作的越積極。
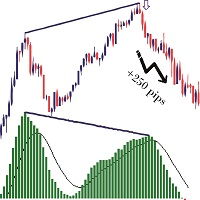
What Is Moving Average Convergence Divergence (MACD)? Moving average convergence divergence (MACD) is a trend-following momentum indicator that shows the relationship between two moving averages of a security’s price. The MACD is calculated by subtracting the 26-period exponential moving average (EMA) from the 12-period EMA.
The result of that calculation is the MACD line. A nine-day EMA of the MACD called the "signal line," is then plotted on top of the MACD line, which can function as a tri
FREE

Suggested timeframes to trading :M1-M5 - M15-M30 -H1 wait london and newyork markert open after wait best then select the best strong index and weakest index by sniper. histogram is indicated by one arrow at a time. The signal in the end direction of weak and strong all red and green mean trending index,natural market is displayed only in white SL Sniper Indicator can be used for short term long and scalping. It is better to confirm entry signals with high low price action. currency is gaining

Description : Koala Pro divergence is not just simple divergence, it's qualified strategy can detect nice divergence signals based on distance from moving line, we know moving average work like gravity, price respect moving line and refer to moving average always, this indicator determine price distance by moving line continuesly and try to choose one of divergance arrows that has enough potential.
In this strategy always our target is moving average.

This indicator is designed based on Mr. WD Gann's square of nine methods.
Using this indicator, we can enter the desired pivot price and, based on the coefficient we assign to it, extract 8 support and resistance numbers with 8 angles of 45, 90, 135, 180, 225, 270, 315, and 360.
Calculates 8 support and resistance points and draws support and resistance lines.
The coefficient is to triple the number of executions.
To select pivot points in which a price is a lar
MetaTrader市场提供了一个方便,安全的购买MetaTrader平台应用程序的场所。直接从您的程序端免费下载EA交易和指标的试用版在测试策略中进行测试。
在不同模式下测试应用程序来监视性能和为您想要使用MQL5.community支付系统的产品进行付款。
您错过了交易机会:
- 免费交易应用程序
- 8,000+信号可供复制
- 探索金融市场的经济新闻
注册
登录