适用于MetaTrader 4的新技术指标 - 61

Matrix is a Forex arrow indicator. Displays signals simply and clearly! The arrows show the direction of the transaction, and are colored accordingly, which can be seen in the screenshots. As you can see, trading with such an indicator is easy. I waited for an arrow to appear in the desired direction - I opened a deal. An arrow formed in the opposite direction - closed the deal. The indicator also displays the lines with the help of which the arrow signals are formed, taking into account the int

Platoon is an indicator designed to be able to detect a bottom or top similar to the Fractals indicator, but of course a different algorithm is used. In other words, you should not enter into a buy deal if the fractal is below. And you should not enter into a sell deal if the fractal is higher.
The indicator only denotes fractals on the chart without performing any additional calculations, therefore, theoretically, any trader can find these patterns by himself. But what is a fractal, how exac

Angry is a trend indicator, it indicates well the points of the beginning of the trend and its completion or reversal. This tool scans the market looking for the correct entry. Against the background of insignificant fluctuations, it is possible to identify a trend and indicate its direction. It uses only price data and analytics to calculate entry points. Does not use auxiliary indicators.
Angry captures moments of stable price movement direction. There are only three types of trend: Bullish

The Matios indicator visually unloads the price chart and saves analysis time: no signal - no deal, if an opposite signal appears, then the current deal should be closed. This is an arrow indicator for determining the trend.
According to the wave theory, Matios displays the course of the wave, while the oscillator can specify the entry point, that is, catch the price movement inside it, i.e. small “subwaves”. By correctly understanding the wave nature of price movements and using the Matios i

The Schindler indicator implements a trend trading strategy, filtering and all the necessary functions built into one tool! The principle of operation of the indicator is to automatically determine the current state of the market when placed on a chart, analyze historical data based on historical data and display instructions for further actions on the trader's screen. You need to understand that any arrow indicator is only a visual form of a signal. As a rule, such Forex indicators contain a wh

I present to your attention my new Bacheha indicator. Which generates signals based on the calculation of a complex algorithm. This indicator displays signals in the form of arrows on the price chart. Signals are displayed only on a fully formed candlestick. After being displayed, the signal is not redrawn.
Volatility is taken into account when calculating values. It can be used to identify overbought or oversold zones in the market. Reaching such levels indicates that the market may soon rev
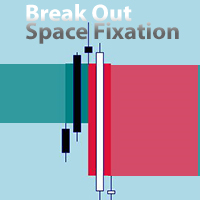
An EA version is being prepared. You can send a private message "notify about EA version".
EA will be versatile with many settings for trading on various indicators. The new EA will also allow trading on this indicator. For example, allowing signals after X signals/bars to X signals/bars in one direction, before changing direction. If Break Out happened before/after the signal of another indicator. Collect profit on each next signal above/below the previous one.
Send a private message "noti
FREE

Description:
The Wall of Worry indicator allows you to assess market sentiment and possible reversals. The indicator represents three lines that are displayed in a separate window.
Black line (trend) - the amount of volumes in the candle body.
Red line (bears) - the amount of volumes in the upper shadow of the candlestick.
Blue line (bulls) - the amount of volumes in the lower shadow of the candle.
The idea is based on "Wall of Worry" - this is the periodic tendency of financial marke
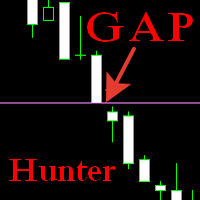
The indicator displays closed and unclosed gaps on a given timeframe and time range. By default, the display of closed gaps is disabled, the search timeframe is the current one. In the flat, it helps to track the direction of the position set by large market participants. In the trend, it shows the points of completion of the position by large market participants. Filters out false pivot points. Another point I wanted to explain, if the parameter Timeframe_for_Search is set to Current in the in
GannRS Trend Scalper GannRS is an advanced trading tool based on Gann Law and Supports and Resistances. designed to have an active trading at any time not lagging Indications are given at the beginning of a new candle
Please watch the full tutorial video.
How to use GannRS Very easy to set up... Put it on your chart Adjust inputs
Inputs Show Resistance and support : [bool] true = Shows R/S on chart false = does not show Show Levels :[bool] true = Shows levels on the chart false = doe

YOU CAN NOW DOWNLOAD FREE VERSIONS OF OUR PAID INDICATORS . IT'S OUR WAY OF GIVING BACK TO THE COMMUNITY ! >>> GO HERE TO DOWNLOAD
Momentum channel is a simple momentum based system yet with a great degree of accuracy in detecting turning points. The market momentum are defined by Average True Range Channels . When price breaks these channels most times , it is an indication of a shift in market momentum and thus a possible new trend formation. The system can be traded on any time frame an
FREE

Broomby Indicator is a trading tool that can be used both independently and in addition to other systems.
It is recommended to use in conjunction with instruments by trading levels. It can be a great filter for opening deals.
Broomby gives 2 types of signals: preliminary and basic. The main one is more filtered, but it depends on you which one suits you best.
It can be used in both trading and options.
Number of last bars - Latest Bars to Analyze Minimum Pips Distance - Pips filter. T

This support and resistance indicator gives u a)support level b)resistance level c)direction(trend) all in one.The indicator is based on the top 3 best levels there are!Red dots are sell direction and green dots are buy direction,if candles dont break these levels u get in after the 3rd dot,always use higher time frames from h1 up so its more clear where direction is going,also u can set the indicator to your time frame that u are lookin at.
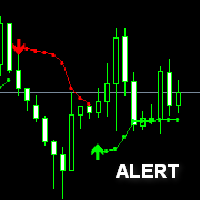
bollinger Stop Alert Indicator is one of the simplest trend-following indicators you may have ever experienced. Besides defining the market trends it also determines possible trend reversal points which are interpreted as trade signals. The bollinger stop can be applied to trade all kinds of forex currency pairs. bollinger Stop Alert Indicator suits all sorts of timeframe charts available within your forex MT4 trading platform thus supports both scalping and day trading. You can also easily cu
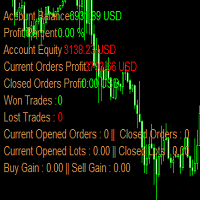
account_info_horizontal is a mt4 (MetaTrader 4) indicator and it can be used with any forex trading systems / strategies for additional confirmation of trading entries or exits.
Indicators add account information to chart. Profit, Balance, Equity, Free Margin, Margin and Margin Level %.
AccountInfo indicator can reveal all advanced features of MetaTrader 4 (above build 600). This indicator can clearly symbolize the main data of the current account (balance, equity, free margin, current Pro

Real Trend Zigzag shows the real trend of a market, u nlike the default Zigzag indicator. It calculates the trend in real time and shows green lines for upwards trends, red lines for downward trends and blue lines for no trends. Regarding the old slogan "the trend is your friend" it helps you to decide if should open a buy or sell position. MT5 Version can be found here: https://www.mql5.com/en/market/product/72065 If you are looking for a multi timeframe zigzag, take a look at the PRO vers

Real Trend Zigzag PRO shows the real trend of a market, u nlike the default Zigzag indicator. It calculates the trend in real time and shows green lines for upwards trends, red lines for downward trends and blue lines for no trends. Regarding the old slogan "the trend is your friend" it helps you to decide if should open a buy or sell position. The PRO version is a multi timeframe zigzag (MTF). Means, it shows the trend of the current timeframe as well as the trend of a higher or lower time.

What Is a Pivot Point? A pivot point is a technical analysis indicator, or calculations, used to determine the overall trend of the market over different time frames. The pivot point itself is simply the average of the intraday high and low, and the closing price from the previous trading day. On the subsequent day, trading above the pivot point is thought to indicate ongoing bullish sentiment, while trading below the pivot point indicates bearish sentimen
How to Use Pivot Points The very e

Super Trend Button Super Trend is a trading strategy according to which one should trade Forex or Stocks when its price trend goes up, and trend goes down, expecting price movements to continue. “The trend is your friend” agree? Features - Special Button : Quick hide/show Super Trend chart. ( Make your Chart more clean and clear easily) - Color : You have the option of customising your favourite colour of Up Trend or Down Trend . - Super Trend Periods : You have the option to c
YOU ARE PUCHASING A FOREX INDICATOR THAT WAS CUSTOM BUILT IN 2021 THIS INDICATOR WILL HELP YOU FIND PRECISE ENTRIES FOR TRADES. SO HOW DOES IT WORK? 1) It looks for engulfing candlestick pattern. (It can tell if there is a bullish or bearish engulfing pattern which is a typically a reversal signal) 2) It will also look to see if price is near a short term extreme by using Bollinger Bands. 3) It combines the engulfing candle stick pattern along with Bollinger Bands to give signal 4) If price has
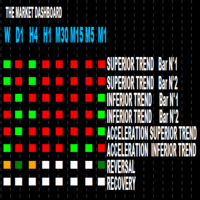
1. Access to all market in the same graphic You know exactly what happens in the market from the shortest timeframe(M1) to the biggest one (MONTH). You will see wether there is a reversal, recovery,acceleration, deceleration of the market. Therefore your decisions become more easy to take and as you are far from usual stress that traders are facing because of numerous analysis they have to do in order to enter or exit the market.
2. Features Every timeframe shows: SUPERIOR TREND B

如果你象这个项目一样,就有5个饥饿审查。 塔克的后续工作: borelatech 平均价格与总额相比
一段时间内贸易。 这是按平均价格计算的。
a 股票是贸易点。 西非经货联经常被用作一个企业。
旨在尽可能被动的投资者的贸易基准
执行。 有了这一指标,你将能够利用万国宫: 目前日。 目前周。 目前 Month。 目前配额。 目前年。 或: 前一日。 前一星期。 曾任Month。 曾任。 曾任一年。
FREE

如果你象这个项目一样,就有5个饥饿审查。 塔克的后续工作: borelatech 这项指标采用了既定价格的公开、高、低价和关闭价格
可以对特定时间区加以调整。 许多机构和专业人士都认为这些是重要的。
贸易商可以为你了解他们可能更进一步的地点,
积极。 现有期间为: 前一日。 前一星期。 曾任Month。 曾任。 前一年。 或: 目前日。 目前周。 目前 Month。 目前配额。 今年。
FREE

该指标分析分形的价格结构并确定市场动态的可能反转点。与其他类型的指标结合使用时非常完美。
好处:
适用于所有仪器和时间序列, 不重绘结果, 指示器元素的可定制颜色, 适用于任何趋势策略, 调整分形的强度。
MT5 version -> HERE / Our news -> HERE
Strategy:
AW Flexible Fractals is an indicator that indicates signals not instantly, but with a delay, due to the structure of the fractal.
To detect a signal in the " Number of candles on each side of the fractal " variable, you can adjust the number of bars on each side from the central point of the fractal. In the default settin
FREE
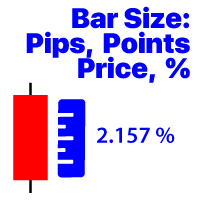
显示所选时间帧的最后一个收盘价柱的变化 价格价值; 百分比值(%); 点数; 市场点; 我的#1助手 :包括36+功能/ 如果您有任何问题,请联系我 程序文件必须放在" Indicators "目录中。
在指标的设置中,您可以配置: 字体大小; 文字颜色; 在图表上的定位:在左下角或右下角; 打开/关闭计算机当前时间的显示; 计算的时间范围(您可以设置当前:当TF变化时,值将改变); 计算类型:
1=价格值;
2=百分比值(%);
3=以点数为单位的大小;
4=以点为单位的大小; 值的计算方法:
true:将使用高-低值;
false:打开-关闭值将被使用; 我的#1助手 :包括36+功能/ 如果您有任何问题,请联系我 程序文件必须放在" Indicators "目录中。

Description Better version of MACD indicator which offer a complete visual trading strategy and realize an auto-optimization
KEY LINKS: How to Install – Frequent Questions - All Products How is this indicator useful? NEVER repaints. Detect best parameters of MACD indicator, based on profit factor during the specified period. This indicator can be used as a visual strategy, following the recommendations of entry, stop, and targets. Indicator features It can be used as a complete trading s
该指标发现技术分析反转模式,如双底、三重底、头肩顶及其相反的对应物。该指标将它们显示在货币对图表上,如果最近形成了一种模式,则可以向交易者发出信号。这使您可以快速检测可能的趋势反转或修正,在图表中添加一个指标就足够了,之后,您可以更改不同的时间范围以快速找到此类模式,如果没有找到这些模式,或者相反,不是位于历史上最好的地方,您可以更改参数以更好地显示某个货币对。此外,您可以更改显示图案的线条颜色,并启用未完全成型的图案线条的显示。
选项 History - 在图表上搜索形态的柱数; ExtremCountBars - 搜索极值的柱数,例如,第二个峰值的高点(推荐 3-40); MinExtremDist - 2 个极值之间的最小柱数(推荐 2-12,值越高,找到的形态越大); MaxExtremDist - 2 个极值之间的最大柱数(推荐 10-50); MultipleVerticesFilter - 过滤以找到“额外的”高点或低点(如果启用,应该只有 2 个顶部或底部); PeriodMAforEdgeFiltering - 通过 MA 过滤双底和顶部形状的边缘,以便有平滑的

"BUYUK SAVDOGAR" TM has developed this strategy to support anyone who trades binary options.
The "monoBAR" trading system is based on mathematical probability and consists of algorithms that can analyze the market situation with high accuracy.
This trading system consists of mathematical probability, which helps to determine the most accurate state of the price movement. The strategy algorithm helps to detect small impulse movements in a timely manner.
You can simultaneously analyze and r
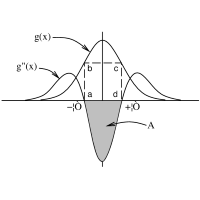
Trend Second Derivative RSI is a forex indicator based on the usual RSI, based on the second derivative of the price function. On the chart itself, trend signals will be displayed by arrows, they are filtered by the algorithm and always alternate buy / sell. It also shows the number of profitable pips that the indicator can give at the specified interval (LimitCalcHistory). The indicator has a parameter (Spread), which deducts a part of the profit per spread for each signal.
Immediately notic

O melhor indicador para o mercado forex, binárias, commodities! Não repinta ( não alterna o sinal, ocultando as percas) 100% transparente e muito eficaz. Ótimo indicador mesmo no período de notícias! Sempre aprimorando para ser o indicador mais poderoso do mercado! Com atualizações mensais... próxima atualização dia 30 de setembro de 2021 CONFIRA!!!!

这是一套原创的、敏捷型、极佳趋势系统。无论您是刚入门的交易新手还是专业级的交易人士,这套指标均可助您快捷及时的追踪市场趋势的最新变化。它具有以下特点: 使用方法极简单,即插即用,且所有趋势分析结果的显示方式一目了然 ; 不需配置 任何功能参数 ,趋势追踪指标将根据市场数据自动分析显示日/周/月级别的趋势大方向; 本日,本周及当前月度的趋势信息同时显示在同一个图表窗口中; 不依赖于任何其他传统/经典指标的数据 ; 支持 MT平台的 所有交易品种; 支持5分钟到日线的各级图表(MT5平台用户没有任何限制); 这套指标 采用特有的市场行为分析算法,以不同于传统趋势分析方法的维度,快速辨识即将形成的趋势。因此您 可以将本指标结合任何其他经典分析方法一起使用,从多方角度衡量您的交易决策。

The General indicator helps to analyze the market on a selected time frame. He defines the mainstream. The Forex General trend indicator provides an opportunity to classify the direction of price movement by determining its strength. Solving this problem helps investors enter the market on time and make good profits.
It does not provide real-time signals, signals arrive late. But nevertheless, it is very effective. You need to read its signals as if it were a zigzag, the principle of receivin

The SPV Volatility indicator is one of the most effective filters. Volatility filter. Shows three volatility options. The so-called limit, real, and the last most effective filter for the filter is the percentage filter. Percentage display of folatility shows the ratio of limit to real volatility. And thus, if we trade in the middle of the channel, then it is necessary to set a condition that the percentage is less than a certain indicator value. If we trade on the channel breakout - following t

Fully featured Pivots and Levels indicator Pivots: Floor (normal), Woody, Camarilla, Fibonacci Levels: ATR, Historical Volatility with standard deviations, Close Price Volatility with standard deviations
Features: 4 +/- levels MTF, pivots/levels based on Daily, Weekly, 4hr or even 15min Hour and minute time offset
Texts with prices and pip distances to central pivot/level Inputs for Camarilla/Fibonacci/ATR/Volatility levels
Alerts, popup, push, email, sound, live or completed candles on leve

Its free now till Frebruary 15th GIVE ME A GOOD RATING! Helio indicator is a advance version of RSI indicator with more features .
It provides technical information about bullish and bearish price momentum , and is often plotted in “Existed pane below”. An asset is usually considered overbought when the Helio is above 70 and oversold when it is below 30. Add your additional chart analysis to filter the signals further . ITS FREE, GIVE ME A GOOD RATING!
Traders of all experience levels ca
Odyusa Pips is designed to visualize the direction of the trend. This indicator is deprived of delay and therefore very effective. Odyusa Pips determines the direction of the current trend using a cluster digital filter . ITS FREE, GIVE ME A GOOD RATING! Characteristics of the ODYUSA PIPS INDICATOR · Platform: Metatrader4 · Asset: Any available trading assets · Trading Time: Around the clock · Timeframe: Any · Recommended broker: InstaForex , XM , , Rules of trad

I just made it free till 14th February, GIVE ME A GOOD RATING! Pro Blaster is an advanced trading system based on two indicators, each of which in turn is based on the MACD indicator. The system provides signals to enter in the market, which will be understood even by novice traders. ITS FREE, GIVE ME A GOOD RATING! The strategy algorithm has a double trend confirmation and is capable of generating signals. Characteristics of the PRO BLASTER · Platform: Metatrader4 · Currency pair

You don't know what to trade? This is the one for you. Currency Strength (ROC Base) is the easiest way to identify strong and weak currencies. This indicator is a custom-made indicator you can use to determine the currency pairs that are currently trading strongly and the ones that are trading weakly.
This indicator shows the relative strength of 8 major currencies such as AUD, CAD, CHF, EUR, GBP, JPY, NZD, USD. I used a method call " Rate Of Change (ROC) " for calculate all currency in percen

Questo indicatore fractal ti invierà un messaggio telefonico (tramite app mt4) non è necessaria la configurazione dell'indicatore, basta impostare l'ID del tuo smartphone e potrai ricevere il messaggio BUY o SELL in tempo reale (affidabilità 80%)
per qualsiasi domanda o dubbio non esitate a contattarmi su mql5.com o telegram (link al gruppo disponibile in bio)
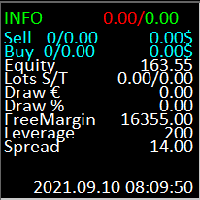
Индикатор информационная панель. 1 строка отображает текущий профит по счету(по всем валютным парам) весь заработанный профит по текущей валютной паре(где стоит индикатор). 2 строка отображает позиции на SELL ордера кол-во открытых ордеров/лотность открытых ордеров и текущий профит по ордерам SELL. 3 строка отображает позиции на BUY ордера кол-во открытых ордеров/лотность открытых ордеров и текущий профит по ордерам BUY/ 4 строка отображает EQUITY. 5 строка отображает лотность закрытых ордеров п
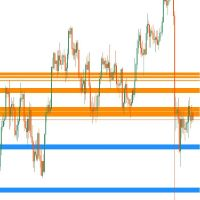
This MT4 indicator can show you Dynamic Support and Resistance Zone in current stage based on Current MA Price in 9 Timeframes, Price Lines or Price Zones for Multi (9) Timeframes according to the setting options as you need which you can set such as MA Period, MA Method, MA Shift, MA Price and you will see price lines all 9 timeframes or you can show Price Zones and also you can hide Minutes timeframes and several setting as you want and You can add several MA Periods in your chart such as 50,

This indicator call "ATR Trend" will display 2 lines on chart, make it easy to trade buy/sell. and also Stop Loss. This Indicator's formula base on standard ATR (Average True Range) function. and I combined it with "Dow Theory" concept. It has 4 parameters. - ATR : Period of ATR it self. - ATR Multiple : Multiple value to display on chart. - Price Mode : Used this price option for check on change to uptrend or downtrend [Open, High, Low, Close, High/Low, (High+Low) / 2, (High+Low+Close) / 3 ,

*Non-Repainting Indicator "Mercy" is an arrow indicator that shows possible bounce set ups. It's best to Use The M5 and M1 charts for indices. M15 and M5 for forex pairs. I recommend turnkeyforex.com as a great broker and the one I personally use Live signal based on this indicator: Hurican TK -Push notifications to phone or computer -Great For Scalping -Great For Swing Trading -Arrow Appears at The "Close Of The Candle" -Works On Any Timeframe -Works On Any Mt4 Pair -Perfect For New Trader

Forex Signal Generator is a cutting edge technology for Trend Trading, and filtering all inbuilt in one tool. The Signal Generator analysis the market like a Pro by using its smart algorithms to detect the trend, filter out market noise and display on your chart with the : ENTRY, STOPLOSS AND TARGET PROFIT
Advantages You Get
Access to the proven reliable trend indicator based
Easy and effective trend detection.
Gives you the ability to filter out 'NOISE' from the ma

该指标从极值开始构建三周期信号和反转形态 123。信号出现在第二根蜡烛的开口处。 该形态可以通过不同方式(测试点 3、突破等)进行交易。退出通道或突破趋势线是寻找入场点的主要触发因素。 图标根据斐波那契水平着色。黄色图标表示对某一水平的测试,在该水平上信号会被放大。 使用多币种仪表盘,您可以跟踪 123 形态是在哪些货币对上发现的,以及有多少个条形图跟随该形态。 基于分形之字形。可重新绘制。因此,请在博客链接 - 123 Fractal Trading With UPD1 中研究该策略。
输入参数。
Bars Count – 显示历史记录。 Tooltip – 将鼠标悬停在对象上时是否显示工具提示。 Show Semaphore – 启用或禁用信号灯。 Show 123 – 启用或禁用显示 123 模式。
Period 1, 2, 3 - 信号周期。 Period 1, 2, 3 Visual – 启用或禁用单独周期的显示。
Arrow Coeff Period – 用于计算的条数。 Arrow Coeff – 平均烛

ADX 指标用于确定趋势及其强度。 价格的方向由 +DI 和 -DI 值显示,ADX 值显示趋势的强度。 如果+DI高于-DI,则市场处于上升趋势,如果相反,则市场处于下降趋势。 如果 ADX 低于 20,则没有明确的方向。 一旦指标突破该水平,中等强度的趋势就会开始。 值高于 40 表示强劲趋势(下降趋势或上升趋势)。
平均方向运动指数 (ADX) 指标的多货币和多时间框架修改。 您可以在参数中指定任何所需的货币和时间范围。 此外,当趋势强度水平被交叉时,以及当 +DI 和 -DI 线被交叉时,指标可以发送通知。 通过单击带有句点的单元格,将打开该符号和句点。 这是 MTF 扫描仪。
与货币强度计类似,仪表板可以自动选择包含指定货币的货币对,或以该货币为基础货币的货币对。该指标在“货币对集合”中指定的所有货币对中搜索货币;其他货币对将被忽略。并根据这些货币对计算该货币的总 ADX。您可以看到该货币的强弱程度。
默认情况下,从图表中隐藏仪表板的键是“D”。
参数 ADX Period — 平均周期。 ADX Applied Price — 价格类型。 Clear th

该指标创建一个相对于其他图表指标的通道: 指标 + ATR 和指标 - ATR 。了解价格是否超出您的基准线非常有用。 ATR 水平可以用乘数进行调整。 此版本比其 MT5 版本更复杂,以避免某些 MT4 限制:您需要引入基线的 名称 、 参数 (以逗号分隔的字符串)和 缓冲区 。确保您的基线在 一个 缓冲区中包含所有必要的值(或者您可能需要放置多个实例)。
不支持 基线上的字符串参数,无论引入什么值,都将始终使用默认值。 对于枚举数,使用他们的位置(从 0 开始,对于大多数人来说)。例如对于 MA 模式:sma=0; EMA=1; smma=2; lwma=3
作为一个优势,此指标还显示原始基线,因此您将在同一指标中拥有所有 3 行。您可以使用特殊名称标签访问 MT4 本地指标:在这种情况下,有用的是“<MA>”和“<ICHIMOKU>”(用于 kijun-sen)。还有更多可用,但它们在图表中没有多大意义(也许你也可以从布林带中得到一些东西:<BB>)。
还有一个MT5版本
FREE

Specifically speaking about this indicator (Truman), its signals are very accurate and there is no redrawing. At least this is not an unimportant factor. First of all, I want to note that this indicator is universal and is perfect for almost all underlying assets.
Let's talk in more detail about this indicator and see how to apply it in practice. Before us is a rather simple and unpretentious indicator-switchman. The indicator displays both a line of different colors and arrows to which you c
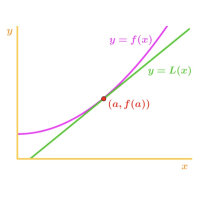
Second Derivative RSI is a forex indicator based on all familiar RSI, based on the second derivative of the price function.
Just a note on the use of the indicator. The indicator requires selection of settings not only for each currency pair but also for each timeframe. If there is no setting, then as a last resort, the indicator may not show signals! In order to pick up the settings, just use a bot that will help you do it.
The indicator combines the functionality of an oscillator and a tr

Channels indicator does not repaint as its based on projecting the falling and raising channels. As a trader you need a path to be able to place your buy and sell trades such as: Supply and Demand , Falling & raising channels. Falling and raising channels can be in any time frame and also can be in all time frames at the same time and the price always flows within these channels. Experienced trades will draw the key levels and channels around the timeframes. But, they will not be able to draw
FREE
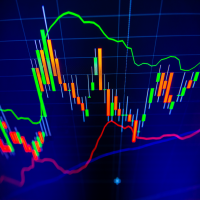
The indicator calculates reversal points based on the past trend and forms a channel (outer) on this basis. This elapsed time span from which the reversal points are determined can be specified in the settings.
An inner channel is also drawn in white. The trend continues in this channel, if there is a sideways trend. Here the upper / lower line form the possible turning point.
The indicator is suitable for all trading areas, whether forex, crypto, metals, indices or futures. All areas trade

NEXT PRICE 99$ Alert Everything ToolBox divergence And Moving Cross: Buy "ALERT EVERYTHING" at 99$ and receive 1 EA for free (* for ONE trade accounts)
THIS EA IS GIFT : https://www.mql5.com/en/market/product/63710
1. 4 Moving Average Cross Alert. 2. MACD divergence Alert 3. Indicators Alerting( ICHIMUKO /RSI/CCI/MACD/STOCH) 4. Pattern Alert 5. Draw Daily Support / Resistance 6. Display Some information on chart.
If you need help :
My WhatsUp Number: +989020473963 : if you want to

ToolBox 360 is the swiss knife of all indicators. It is full packed with useful tools to help you with your trading. It can be used to find best entry and exit points and help you to decide if you should open a trade or not. It shows market trends, candlestick formations outside / inside bars and you can sett time based allerts.
Main features:
Time based Fibonacci lines Choose a start and end time and the indicator shows you Fibonacci lines within the selected time range including range high

Toroid - The indicator reflects information in a visual form, it can be used both for pipsing on small periods and for long-term trading. It generates fairly frequent and accurate signals. The indicator can be used as the main one for determining the trend. The indicator can work both for entry points and as a filter. Uses two parameters for settings. The smart indicator algorithm detects the trend, filters out market noise and generates input signals. It is based on the signals of elementary in
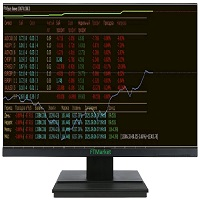
Are you looking for monitoring services to watch trading in the terminal?? You don't need it anymore!! Full monitoring is right in your terminal. There are a couple of strokes left and you can buy it both for real and for a demo test Параметры Parameters:
Max///Statistics Month///Statistics A week///Statistics Day///Statistics
For an open pair:
Symbol Number of orders To buy In villages Density separation Buy profit Sell profit Weekly profit Total profit Drawdown
There is also a built-i

See RSI values turned into colored candles
This indicator provides both colored candles and a colored moving average. 6 drawaing styles are provided to allow customization of the color coding.
Applying coding to the chart may help in conceptualizing price trend and impulse movements defined through RSI values.
Features - optional colored candles - optional colored ma - 6 draw styles; RSI slope RSI above/below overbought/oversold levels RSI above/below level 50 RSI above/below it's moving aver
FREE

Know2fly - unique modular add-ons for Metatrader 4
The quickest therefore the first of a series of as fun as strong modules thoroughly designed to give you a more deep insight into the dynamics of the financial markets and, as a result, improve your trading performance in case you are into this.
Module 1:
fun fast alround leightweight ask bid spread rsi dynamics on-onchart visualisation indicator
fun = imagine a quickly flying dog with carpet ... leaving a trail of fire and smoke ... f
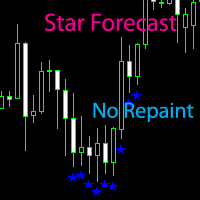
Star forecast is an analytical toolkit used to help currency traders with foreign exchange trading analysis through technical charts and indicators. Forex forecasting which help analysts and traders to determine appropriate and profitable entry and exit points for their forex trades. *Non-Repainting *For Desktop MT4 Only *Great For Intraday
*Great For Swing Trading *Star Appears at The "Close Of The Candle" *Attach On H1 Timeframe for see Daily Trend
*Works On Any Mt4 Pair *Perfect For New Tr
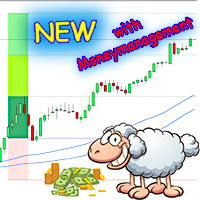
Bring the "sheep" into the dry.
The blue channel represents the river. The "sheep" have to be brought into the dry over this river so that they can graze on the pasture. Whereby the "sheep" are the candles and the "grazing" are the profit.
Entry for long trades is the high of the first candle, which closes completely above the channel. Reversed accordingly for shorts.
Stop Loss as you please. It is best to be below the last low. Take Profit can either be set according to CRV, according

A flexible 2-Line MACD indicator The default MACD indicator inside MT4, limits you to using the MACD with a fast-EMA, slow-EMA, and signal-SMA. This MACD indicator allows you to set your own MA-Method choices for these 3 components, separately! You can select from SMA-EMA-SMMA-LWMA-DEMA-TEMA, and can even use a separate method for each 3 fast-slow-signal periods. On-chart colored candles, with drawing condition types is included, with a show/hide button too.
Features - MA Methods: SMA, EMA, S

Supply and Demand indicator does not repaint as it counts the number of tests/retests occurred in the past x number of times. As a trader you need a path to be able to place your buy and sell trades such as: Supply and Demand, Falling & raising channels . Experienced trades will draw the key levels and channels around the timeframes. But, they will not be able to draw them on the small time frames as the price changes too frequent. This indicator is based on Shved supply and demand indicator, b
FREE

Indicator support for only: Entry Point to Trend Pro Link indicator support : https://www.mql5.com/en/market/product/70867
Supports all currency pairs declared in the definition. Help investors do not need to open many charts. Notice the DEAL: multiple time frames confluence M15, H1, H4.
Entry Point to Trend Pro The indicator helps investors to identify the earliest and perfect reversal point. Easy to make decision to trade with the trend Price action trading. support resistance
FREE

A flexible 2-Line MACD indicator The default MACD indicator inside MT4, limits you to using the MACD with a fast-EMA, slow-EMA, and signal-SMA. This MACD indicator allows you to set your own MA-Method choices for these 3 components, separately! You can select from SMA-EMA-SMMA-LWMA, and can even use a separate method for each 3 fast-slow-signal periods. A more featured version is available with colored candles+conditions, full alerts+conditions, line coloring, DEMA and TEMA options; MACD MAX
FREE

a novel indicator by the maker of velvet.
FREE
What is a tool ? This indicator use for forecast direction of the 28 pairs, Calculates from multiple pairs and timeframes and present by percentage as 70-79% , 80-89% , 90-100% is a little, medium and strong trend. How to use Place the indicator on any pair and any timeframe. Pair : Any Timeframe : Any Input Parameter No Visit my products Target Profit Magic Target Profit All The Profit Tracker Currency Scoring Pair Direction
FREE

What is a tool ? This indicator use for comparison of 8 major currency from 28 pairs and multiple timeframes and calculates a score of strength from 0-100. How to use Place the indicator on any pair any timeframe, And entering only the value of X Y position to be displayed in the graph. Pair : Any Timeframe : Any Input Parameter Start X Position : Value of X on chart Start Y Position : Value of Y on chart Visit my products Target Profit Magic Target Profit All The Profit Tracker Currency
FREE
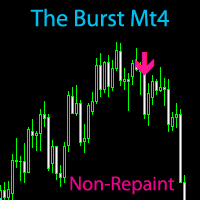
The Burst MT4 Hurry and Buy Before Price Doubles Tomorrow! *Non-Repainting Indicator "The Burst" is an indicator that shows precise Buy and Sell Trades. A great arsenal to add to any chart. It's Best to Use The D1,H4 or H1 chart "The Burst" is designed to alert BUY and SELLS. So Of course, For the best take The Arrows In a Uptrend or Downtrend Only For Confirmation
*Non-Repainting *For Desktop MT4 Only *Great For Scalping *Great For Intraday
*Great For Swing Trading *Arrow Appears at The "Clo
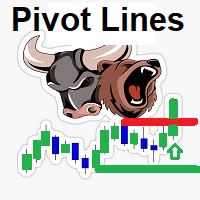
::: FREE FOR A LIMITED TIME !!!! the Smart Pivot Lines detection indicator It detects market direction By identifying super candles and major support resistance levels It detects the major breakout Candles amplified by the volume and Candle body size and shows it in a separate window to give a great indication of market power and direction Support resistance lines are detected by a unique strategy using tick volumes , bars patterns and bars size
- if Bears dominates :: Price will be below

Индикатор предназначен для переключения ТФ. Если у вас стоит советник который зависит от текущего ТФ, тогда это вещица вам необходима. Выставление ТФ происходит по количеству ордеров или по набранной лотности. К примеру, для ясности, если ваш советник начинает просаживаться, набирая сетку, то индикатор переключает ТФ автоматически, на увеличение ТФ и не даёт набирать лотность. Как только он закрыл сетку, происходит автопереключение на М1 и по новой. Так ваш советник торгует как скальпер и далее
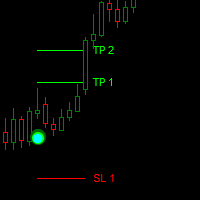
Dark Point is an Indicator for intraday trading. This Indicator is based on Trend Following strategy, also adopting the use of the atr to determine the right volatility. We can enter in good price with this Indicator, in order to follow the strong trend on the current instrument. If you love Dark Point, consider adding some power: Dark Power
Key benefits
Easily visible take profit/stop loss lines Intuitive directional points/arrows by colors Useful statistics , which indicate the win
FREE
MetaTrader市场是独有的自动交易和技术指标商店。
阅读MQL5.community用户备忘更多地了解我们提供给交易者的独特的服务:复制交易信号,自由职业者开发的自定义应用程序,通过支付系统完成的自动付款和MQL5云网络。
您错过了交易机会:
- 免费交易应用程序
- 8,000+信号可供复制
- 探索金融市场的经济新闻
注册
登录