MetaTrader 4용 새 기술 지표

FX 레벨은 기존의 라이트하우스 방식과 혁신적인 동적 접근 방식을 결합한 매우 정확한 지지 및 저항 지표로 모든 거래 심볼에서 완벽하게 작동합니다. 여기에는 통화쌍, 지수, 주식 또는 원자재가 포함됩니다. FX 레벨은 반전 포인트를 식별하여 차트에 표시하므로 트레이딩 활동에서 수익 목표로 이상적으로 활용할 수 있습니다. FX 레벨을 개발하면서 브로커에 대한 광범위한 경험과 데이터 피드 및 시간 설정의 다양성을 활용했습니다. 그 결과 FX 레벨은 이제 여러 브로커에서 거의 100% 동일한 레벨을 식별할 수 있습니다. FX 레벨의 이 특별한 기능은 다른 지지 및 저항 지표에서는 찾아볼 수 없는 전례 없는 수준의 신뢰성을 사용자에게 제공합니다. 스타인 인베스트먼트는 좋은 트레이딩 도구와 훌륭한 도구의 차이를 만드는 것이 세부 사항이기 때문에 세부 사항에 많은 주의를 기울이고 있으며, 세부 사항에 대한 추가주의를 통해 잘 알려진 분석 방법을 사용자에게 완전히 새로운 수준으로 끌어올릴 수

Reversal-Arrow: 정확하고 신뢰할 수 있는 반전 포인트 식별 Reversal-Arrow는 트레이더가 잠재적인 추세 반전 지점을 식별할 수 있도록 돕기 위해 설계된 고급 지표입니다. 이 지표는 명확한 시각적 신호를 제공하여 시장 상황을 이해하기 쉽게 하고 불확실성을 줄이며 의사 결정 과정을 간소화합니다. 특히 XAUUSD 및 XAUEUR의 1분, 5분, 15분 타임프레임에 최적화되어 이 시간대에서 최대 성능을 발휘합니다. 그러나 다른 통화 쌍과 시간대에서도 다양하게 사용할 수 있습니다. Reversal-Arrow의 특징 및 장점 명확한 반전 신호: Reversal-Arrow는 잠재적인 반전 지점을 표시하기 위해 컬러 화살표 시스템을 사용합니다. 녹색 화살표는 매수 신호를, 빨간색 화살표는 매도 신호를 나타냅니다. 이 시각적 표현은 직관적으로 설계되어 트레이더가 주요 반전 레벨을 쉽게 인식할 수 있도록 도와줍니다. 짧은 시간대에서 높은 정확도: 정밀한 조정을 통해 XAUUSD
4개 한정, $49 – 가격이 $149로 오르기 전에 서둘러 구매하세요! 혁신적인 RSI Kernel Optimized with Scanner를 소개합니다. 이 최첨단 도구는 강력한 커널 밀도 추정(KDE) 알고리즘을 통합하여 전통적인 RSI 분석을 재정의합니다. 이 고급 지표는 실시간으로 시장 트렌드에 대한 인사이트를 제공할 뿐만 아니라, 여러 통화쌍과 시간 프레임을 동시에 스캔할 수 있는 대시보드를 포함하고 있습니다. 이 도구가 당신의 거래 도구 상자에 필수적인 이유를 살펴보겠습니다. See more MT5 version at: RSI Kernel Optimized with Scanner for MT5 See more products at: https://www.mql5.com/en/users/ndhsfy/seller
주요 기능: 혁신적인 피벗 감지 : KDE 알고리즘을 활용하여, 이 지표는 캔들스틱이 피벗 포인트를 형성할 확률을 추정하며, 거래자에게 시장 반전에 대
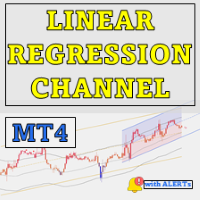
5개 한정 $49 – 지금 구매하지 않으면 가격이 $149로 상승합니다! 선형 회귀 채널 지표 는 가격 추세와 잠재적인 반전 지점을 포착하는 데 도움을 주는 강력한 기술적 분석 도구입니다. 선형 회귀 채널, 밴드 및 미래 예측을 계산하여 시장 역학에 대한 깊은 통찰력을 제공합니다. 이 지표는 과매수 및 과매도 상태, 추세 방향을 식별하는 데 도움을 주며, 향후 가격 움직임에 대한 명확한 시각적 신호를 제공합니다. MT5 버전은 여기를 참조하십시오: Linear Regression Channel MT5 See more products at: https://www.mql5.com/en/users/ndhsfy/seller
주요 특징: 1. 선형 회귀 밴드: 기능: 과매수 및 과매도 수준을 나타내는 선형 회귀 계산을 기반으로 밴드를 그립니다. 맞춤 설정: 길이: 다양한 시간 프레임에 유연하게 적용할 수 있도록 회귀 계산의 조회 기간을 조정합니다. 편차: 트렌드 내 주요 수준을
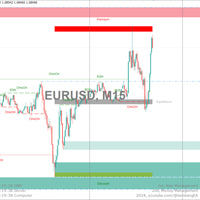
이 올인원 지표는 실시간 "시장 구조"(내부 및 스윙 BOS/CHoCH), 주문 블록, 프리미엄 및 할인 구역, 동일 최고가 및 최저가 등을 표시하여 트레이더가 널리 사용되는 가격 액션 방법론으로 차트를 자동으로 마크업할 수 있도록 합니다. 공정 가치 갭 스크립트가 출시된 후, 커뮤니티에서 동일한 범주에 더 많은 기능을 출시해 달라는 요청을 많이 받았습니다.
"시장 구조"는 유동성을 보다 정확하게 탐색하고 시장에서 보다 최적의 관심 지점을 찾으려는 가격 액션 트레이더 사이에서 비교적 새롭지만 널리 사용되는 용어입니다. 기관 시장 참여자가 주문을 한 곳(매수 또는 매도 측 유동성)을 파악하려는 것은 가격 액션에 따라 보다 실용적인 진입 및 종료를 찾는 매우 합리적인 접근 방식이 될 수 있습니다.
이 지표에는 스윙 구조의 존재 및 기타 여러 관련 조건에 대한 알림이 포함됩니다.
특징
이 지표에는 많은 특징이 포함되어 있으며, 이러한 특징은 아래와 같습니다.
실시간으로
FREE
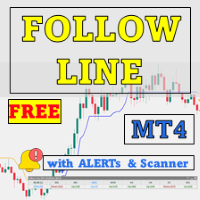
Follow Line 와 스캐너로 거래에서 앞서 나가세요. 이 고급 변동성 기반 지표는 진지한 트레이더를 위해 설계되었습니다. 이 도구는 Bollinger 밴드의 강력한 기능과 맞춤 설정을 결합하여 가격 움직임에 대한 정확한 통찰력을 제공합니다. See more MT5 version at: Follow Line MT5 with Scanner See more products at: https://www.mql5.com/en/users/ndhsfy/seller Follow Line의 핵심은 가격이 1 표준 편차로 설정된 Bollinger 밴드를 초과할 때를 감지하는 능력에 있습니다. 작동 방식은 다음과 같습니다: 매수 신호: 가격이 상위 Bollinger 밴드를 넘을 때, Follow Line은 파란색으로 바뀌어 매수 기회를 알립니다. 매도 신호: 가격이 하위 Bollinger 밴드 아래로 떨어질 때, Follow Line은 빨간색으로 바뀌어 매도 신호를 나타냅니다. 그러나 Fo
FREE
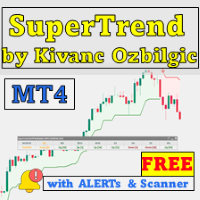
SuperTrend by Kivanc Ozbilgic with Scanner 를 소개합니다 – 시장 트렌드를 앞서기 위해 설계된 다기능 강력한 도구로, 사용자 맞춤형 기능과 실시간 알림을 제공합니다. ATR 계산 방법을 RMA (상대 이동 평균)와 SMA (단순 이동 평균) 중에서 선택하여 최대한의 유연성을 제공할 수 있습니다. 기본 설정으로 ATR 기간은 10, 배수는 3으로 설정되어 있으며, SuperTrend 는 매수 및 매도 신호를 효율적으로 감지합니다. 내장된 스캐너와 알림 시스템은 여러 통화 쌍과 시간 프레임을 모니터링하여 실시간 알림을 제공해 즉각적인 조치를 취할 수 있도록 합니다. See more MT5 version at: SuperTrend ATR Multiplier with Scanner for MT5 See more products at: https://www.mql5.com/en/users/ndhsfy/seller 주요 특징 : 검증된 SuperTren
FREE
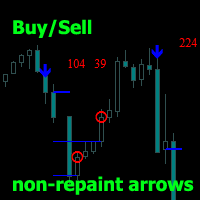
금, 석유, 통화, 암호화폐에 대한 거래 진입 및 종료 신호 - 모두 MT4에서 다시 그리지 않고 추세 예측과 함께 제공됩니다. 초보자도 모든 시간대에서 쉽게 거래할 수 있습니다. 화면에서 볼 수 있고, 영어로 들을 수 있고, 스마트폰에서 수신할 수 있는 신호를 자동 조정하기 위한 유연하고 정확한 알고리즘.
이 지표에는 사용자를 교육하기 위한 힌트 시스템이 있습니다. 마우스 포인터를 아무 객체 위에 올려놓으면 표시됩니다. 사용 설명서 대신 무료 데모 버전을 다운로드하여 테스트를 중단한 후 차트에서 세부 정보를 연구하세요.
구매 후 무료 보너스를 받을 수 있습니다. 한 창에 6개의 스토캐스틱을 동기적으로 표시하는 또 다른 지표와 14년 이상의 거래 경험을 가진 프로그래머인 트레이더의 효과적인 거래 및 설정에 대한 지침입니다. 저에게 편지를 쓰면 보내드리겠습니다.
이 지표의 장점과 동작:
- 통화 활동 및 스토캐스틱의 스캐너로, 새 신호가 나타나는 차트로 화면을 자동으로
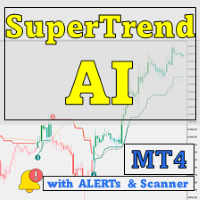
5개 한정 $49 – 지금 구매하지 않으면 가격이 $149로 상승합니다! MetaTrader 4 (MT4) 용의 혁신적인 거래 도구인 SuperTrend AI Clustering with Scanner 로 AI의 힘을 발견하세요. 이 지표는 K-means 클러스터링과 널리 알려진 SuperTrend 지표를 결합하여 시장 분석을 재정의하고, 거래자가 트렌드와 신호를 탐색할 때 유리한 위치를 차지할 수 있도록 합니다. See more MT5 version at: SuperTrend AI Clustering MT5 with Scanner See more products at: https://www.mql5.com/en/users/ndhsfy/seller
이 도구가 돋보이는 이유 전통적인 SuperTrend 지표는 트렌드 감지에 도움을 주지만, SuperTrend AI Clustering은 기계 학습을 통합하여 한 단계 더 나아갑니다. 즉, 정적인 설정 대신 지표가 실시간 성능
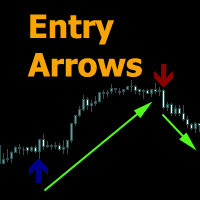
변동성 돌파 지표는 전환점을 결정하는 추세 지표입니다. 지표의 작동 원리는 초기 추세 반전 지점을 찾는 것을 기반으로 합니다.
ATR 변동성 지표를 기반으로 하기 때문에 선 교차점의 경우처럼 가격이 반전되어 어느 정도 이동할 때까지 기다리지 않습니다. ATR 지수 변동성 반전 방법을 사용하여 추세 변화를 결정합니다.
모든 금융 상품 및 기간에 사용할 수 있습니다.
화살표는 양초가 닫힌 후에만 나타나며 결코 다시 칠해지지 않습니다.
하나 또는 두 개의 시간 프레임에 대한 독립적인 지표로 사용하여 시간 프레임 H1 - H4의 추세를 결정하고 M5 - M15의 주문을 개시할 수 있습니다.
화살표에 대한 여러 유형의 경고가 포함되어 있습니다.
파란색 화살표 - 켜짐, 빨간색 화살표 - 꺼짐. 선 표시를 켤 수 있습니다.
지표의 작동은 거래 수단 및 기간에 맞게 변경해야 하는 2가지 매개변수로 규제됩니다.
Volatility Index (0,8-2) - 추세 반전

Ultimate Trend Dashboard Ultimate Trend Dashboardは、直感的なカラースキームを使用してH1タイムフレームで市場のトレンドを識別し、強調するために設計された強力なMT4インジケーターです。M30タイムフレームで明確なエントリーシグナルを提供し、ダッシュボードに数値として表示されます。この数値がゼロに近づくとアラートが発生し、取引の機会を逃さないようにします。 主な機能: トレンド識別 :H1タイムフレームでトレンドがホットかどうかを示すためにカラースキームを使用。 エントリーシグナル :M30タイムフレームでエントリーシグナルを提供し、シグナル数値がゼロに近づくとアラートを発生。 セッションの有効性 :エントリーが有効であるのはロンドンセッションまたはニューヨークの朝のセッション中のみ。 カスタマイズ可能なアラート :トレンドとエントリーアラートのためのデスクトップ、モバイル、およびメール通知。 ダッシュボードのカスタマイズ :パーソナライズされた取引体験のための調整可能なダッシュボードサイズとカラ設定。 複数のタイムフレー
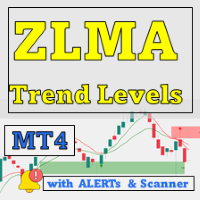
단 5개의 카피, 49달러 – 가격이 149달러로 오르기 전에 지금 확보하세요! Zero Lag MA Trend Levels 스캐너 지표는 Zero-Lag 이동평균(ZLMA)과 표준 지수이동평균(EMA)을 결합하여 트레이더에게 시장 모멘텀과 주요 가격 수준에 대한 포괄적인 뷰를 제공합니다. 또한 스캐너와 알림 기능을 통해 트레이더는 여러 통화 쌍 및 타임프레임에서 신호를 쉽게 추적하여 거래 기회를 더 잘 포착할 수 있습니다. See more MT5 version at: Zero Lag MA Trend Levels MT5 with Scanner See more products at: https://www.mql5.com/en/users/ndhsfy/seller
주요 기능 및 사용 방법 Zero-Lag 이동평균(ZLMA)과 EMA 구름
이 지표는 트렌드 방향에 따라 ZLMA와 EMA 사이에 색상이 변하는 구름을 표시합니다. 녹색은 상승 추세를, 빨간색은 하락 추세를 나타
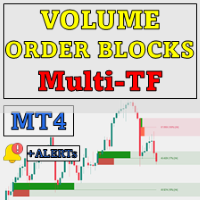
$49에 5개의 복사본만 제공 – 가격이 $149로 오르기 전에 확보하세요! 다중 시간 프레임의 체적 주문 블록 지표는 주요 시장 참가자들이 주문을 축적하는 중요한 가격 영역을 식별하여 시장 행동에 대한 더 깊은 통찰을 원하는 트레이더들을 위해 설계된 강력한 도구입니다. 이 영역들은 체적 주문 블록으로 알려져 있으며, 잠재적 지지 및 저항 구역으로 작용해 정보에 입각한 거래 결정에 중요한 이점을 제공합니다. MT5 버전 보기: Volumetric Order Blocks MT5 Multi Timeframe See more products at: https://www.mql5.com/en/users/ndhsfy/seller
핵심 기능 1. 체적 주문 블록의 자동 감지
이 지표는 매수 또는 매도 주문이 축적되는 중요한 가격 수준을 강조하며, 두 가지 주요 유형을 제공합니다: 강세 체적 주문 블록: 일반적으로 스윙 저점 근처에 위치하여 잠재적 지지 수준으로 작용합니다. 약세

MIGHTY FALCON PIPS 소개 Mighty Falcon Pips는 TRIX, 이동 평균 및 모멘텀을 기반으로 하는 간단한 매수 및 매도 지표입니다. 이 지표는 유용한 반전 신호와 함께 추가적인 출구 신호를 제공하는 데 중점을 둡니다. 강력한 출구 신호는 반전 추세에서 제때 나갈 수 있도록 하여 거래를 원활하게 진행할 수 있습니다. 출구 신호를 포함한 모든 신호는 조정 가능하지만, 좋은 필터와 함께 사용하는 것을 권장합니다(예: 구조 기반 지표). 주요 기능: 재작성 및 지연 없음 신호 및 출구 알림 및 푸시 알림 강한 신호와 약한 신호 가격 행동과 쉽게 결합 가능 우리는 설정 파일을 제공하며, 소유하고 있는 경우 설정 파일을 받기 위해 관리자에게 문의할 수 있습니다.
MIGHTY FALCON PIPS 소개 Mighty Falcon Pips는 TRIX, 이동 평균 및 모멘텀을 기반으로 하는 간단한 매수 및 매도 지표입니다. 이 지표는 유용한 반전 신호와 함께 추가적인 출

트렌드 오실레이터: 부드럽고 신뢰할 수 있는 시장 트렌드 식별 트렌드 오실레이터는 트레이더가 트렌드 방향과 잠재적 반전 포인트를 정확하게 식별하는 데 도움을 주기 위해 설계된 MT4의 고급 지표입니다. 직관적인 시각적 표현을 통해 시장이 상승 추세인지 하락 추세인지를 명확하게 보여주어 분석을 단순화하고 차트 가독성을 높입니다. 다양한 시장 및 시간 프레임에 적합하여 여러 트레이딩 요구에 유연하게 대응할 수 있습니다. 트렌드 오실레이터의 주요 특징과 장점 단순화된 트렌드 시각화 : 트렌드 오실레이터는 라인의 색상을 변경하여 트렌드 움직임을 그래픽으로 나타냅니다. 파란색은 상승 추세를, 노란색은 하락 추세를 나타내어 트렌드를 즉시 명확하게 파악할 수 있습니다. 신뢰할 수 있는 반전 신호 : 고급 알고리즘을 통해 지표는 잠재적인 반전 포인트를 나타내는 색상의 화살표를 생성합니다. 녹색 화살표는 매수 포인트를, 빨간색 화살표는 매도 포인트를 나타내어 트레이더가 진입 또는 청산을 평가할 수
Moving Averages Divergence 3x3 Indicator uses the crossover technique for signaling the market trend and the trade opportunities as well. It applies 3 formats of the same indicator and allows them to plot the crossover signals which are interpreted as the trade signals along with the direction of the market trend. Moving Averages Divergence 3x3 Indicator can be applied to trade all kinds of forex currency pairs within the financial markets. Although, this indicator works well only in be
FREE

The Wolf Wave Finder Indicator is a popular indicator, that is useful in identifying potential trading opportunities. The indicator works by recognizing the Wolf Wave pattern, which is a well-known pattern used by professional traders to identify potential areas of support and resistance. The indicator is easy to use and provides traders with an easy way to identify potential trades. The Wolf Wave Finder Indicator is a great tool for traders who are looking for a reliable and accurate way
FREE

This indicator is a fusion of the Parabolic SAR and Fibonacci indicators. Fibo is drawn on the last wave, at the peaks the indicator displays prices for convenience. Parabolic SAR helps to define the market trend and generates trends following trade signals. On the other hand, Fibonacci plots the price retracement levels so that traders can determine a better and safer place to enter the market. You can purchase our expert advisors through our affiliate program with a 50% discount. More info
FREE

This indicator consists of two indicators RSI and EMA. As signals for more effective entries and exits from positions, it is recommended to use visual monitoring of line crossings, since the arrows appear with a delay and display the strength of the trend after the lines cross and are auxiliary information. You can purchase our expert advisors through our affiliate program with a 50% discount. More information is available on our website ProfRoboTrading.
FREE
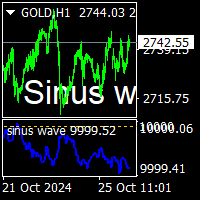
Sinus wave indicator is a oscillator. it works all pairs and all timeframes. suitable for experienced and beginner traders.. indicator works opposite side of the prices.. while sinus wave go up side that means prices will down. and while sinus wave go down that means prices is going up. it is default cnt number has set to 1000..this can be rise acording to chart has bar numbers minimum cnt numbers must not be lower 500.
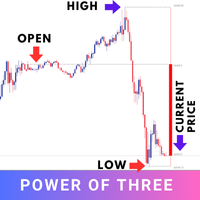
The "Power of Three" (PO3) is a concept developed by the Inner Circle Trader (ICT) to illustrate a three-stage approach used by smart money in the markets: Accumulation, Manipulation, and Distribution . ICT traders view this as a foundational pattern that can explain the formation of any candle on a price chart. In simple terms, this concept is effective for any time frame, as long as there's a defined start, highest point, lowest point, and end. MT5 - https://www.mql5.com/en/market/product/124
FREE
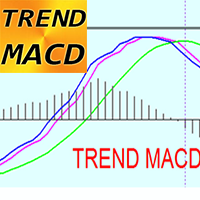
MT4용 TREND MACD 지표 - 훌륭하고 효율적인 거래 도구입니다!
이 지표는 큰 가격 변동을 포착하는 데 집중하는 트렌드 트레이더에게 좋습니다. TREND MACD는 3개의 선으로 구성되어 있습니다. 녹색 선 - 주요 추세 방향을 표시하고, 파란색 및 자홍색 선은 진입 및 종료를 나타냅니다. 지표는 수익을 극대화할 수 있도록 합니다. 수익성 있는 거래에서 너무 일찍 종료하지 않도록 합니다. 지표에는 모바일 및 PC 알림이 내장되어 있습니다. 지표 사용 방법(그림 참조): 1) 파란색 및 자홍색 선이 모두 녹색 선 위에 있는지 확인합니다. 2) 그런 다음 파란색 선이 자홍색 선 위에 있으면 매수합니다. 3) 파란색 선이 자홍색 선 아래에 있으면 거래를 종료합니다. 4) 단기 거래의 경우 그 반대입니다.
// 더 많은 훌륭한 전문가 자문가 및 지표는 여기에서 확인할 수 있습니다. https://www.mql5.com/en/users/def1380/seller 이 MQL5
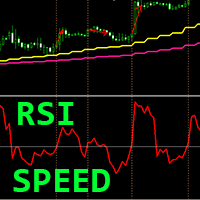
MT4용 외환 지표 "RSI SPEED" - 훌륭한 예측 도구!
이 지표의 계산은 물리학의 방정식을 기반으로 합니다. RSI SPEED는 RSI 자체의 1차 도함수입니다. RSI SPEED는 주요 추세 방향으로 스캘핑 진입에 좋습니다. HTF MA(그림 참조)와 같은 적절한 추세 지표와 함께 사용합니다. RSI SPEED 지표는 RSI 자체가 방향을 얼마나 빨리 변경하는지 보여줍니다. 매우 민감합니다. RSI SPEED 지표를 모멘텀 거래 전략에 사용하는 것이 좋습니다. RSI SPEED 지표 값이 < 0이면 가격 모멘텀이 감소하고 RSI SPEED 지표 값이 > 0이면 가격 모멘텀이 증가합니다. 지표에는 모바일 및 PC 알림이 내장되어 있습니다.
// 더 많은 훌륭한 전문가 자문가와 지표는 여기에서 확인할 수 있습니다. https://www.mql5.com/en/users/def1380/seller 이 MQL5 웹사이트에서만 제공되는 오리지널 제품입니다.
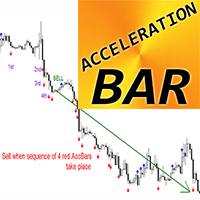
MT4용 외환 지표 가속 막대 - 거대한 추세를 포착할 수 있음
지표 "가속 막대"는 추세 거래를 위한 매우 강력한 도구입니다. 시장 침체 영향이 최소화됩니다. 상승 가속 막대(파란색)는 이전 5개 막대의 최대값보다 높고 최소값이 다음 5개 막대의 최소값보다 낮은 차트의 막대입니다. 하락 가속 막대(빨간색)는 이전 5개 막대의 최소값보다 낮고 최대값이 다음 5개 막대의 최대값보다 높은 차트의 막대입니다. 추세 거래: 매수 신호 - 차트에 4개의 상승 가속 막대가 연속으로 나타날 때 매도 신호 - 차트에 4개의 하락 가속 막대가 연속으로 나타날 때 PC, 모바일 및 이메일 알림이 포함되어 있습니다.
// 더 훌륭한 전문가 자문가와 지표는 여기에서 확인할 수 있습니다: https://www.mql5.com/en/users/def1380/seller 이 MQL5 웹사이트에서만 제공되는 오리지널 제품입니다.
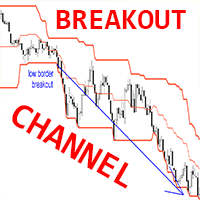
MT4용 외환 지표 BREAKOUT CHANNEL, 리페인트 없음
이 지표는 하이/로우 브레이크아웃을 기반으로 하는 완전한 거래 시스템으로 사용할 수 있습니다. 매개변수가 1개뿐입니다. HYSTORY DEPTH로 지표에서 고려하는 캔들 수를 반영합니다. 매개변수 HYSTORY DEPTH 권장 값: 기간 D1 - 20(1개월), H4 - 30(1주일), H1 - 24(1일) BREAKOUT CHANNEL은 3개의 선으로 구성됩니다. 하이 보더 - 마지막 N개(HYSTORY DEPTH 매개변수) 캔들의 최대 가격, 로우 보더 - 마지막 N개(HYSTORY DEPTH 매개변수) 캔들의 최소 가격, 중간 선. 지표는 다른 지표/가격 활동 패턴과 함께 사용할 수 있습니다. BREAKOUT CHANNEL 지표 사용 사례는 그림에서 찾을 수 있습니다.
// 더 훌륭한 전문가 자문가와 지표는 여기에서 확인할 수 있습니다: https://www.mql5.com/en/users/def1380
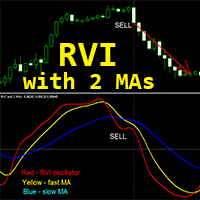
MT4용 외환 지표 "RVI 및 2개 이동 평균"
상대적 활력 지수(RVI) 자체는 추세 시장에서 매우 유용한 기술적 모멘텀 지표입니다. "RVI 및 2개 이동 평균" 지표를 사용하면 RVI 오실레이터의 빠르고 느린 이동 평균을 볼 수 있습니다. 지표는 특히 큰 시간 프레임(D1, H4, H1, M30)에서 모멘텀 거래에 적합합니다. 매개변수를 통해 이 지표를 설정하는 것은 매우 쉽고, 모든 시간 프레임에서 사용할 수 있습니다. 그림에서 매수 및 매도 진입 조건을 확인할 수 있습니다. 매수 진입 조건: (1)-빠른 노란색 MA가 느린 파란색 MA 위에 있음, (2)-빨간색 RVI 선이 노란색 빠른 MA 위에 있음, (3)-빨간색 RVI 선이 빠른 노란색 MA에서 위로 반등 매도 진입 조건: (1)-빠른 노란색 MA가 느린 파란색 MA 아래에 있음, (2)-빨간색 RVI 선이 노란색 빠른 MA 아래에 있음, (3)-빨간색 RVI 선이 빠른 노란색 MA에서 아래로 반등
// 더
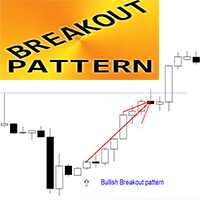
MT4용 외환 지표 "브레이크아웃 패턴"
지표 "브레이크아웃 패턴"은 가격 액션 거래에 매우 강력한 지표입니다. 다시 칠하거나 지연할 필요가 없습니다. 지표는 차트에서 "내부에서 3개"라고도 하는 막대의 브레이크아웃 조합을 감지합니다. 강세 브레이크아웃 패턴 - 차트에 파란색 화살표 신호(그림 참조) 약세 브레이크아웃 패턴 - 차트에 빨간색 화살표 신호(그림 참조) PC, 모바일 및 이메일 알림 지표 "브레이크아웃 패턴"은 지지/저항 수준과 결합하기에 매우 좋습니다.
// 더 많은 훌륭한 전문가 자문가와 지표는 여기에서 확인할 수 있습니다. https://www.mql5.com/en/users/def1380/seller 이 MQL5 웹사이트에서만 제공되는 오리지널 제품입니다.
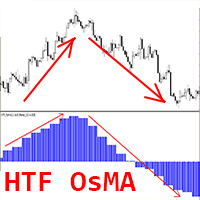
MT4용 Forex Indicator HTF OsMA Oscillator, 리페인트 없음.
HTF OsMA는 시장에서 가장 좋은 트렌드 지표 중 하나입니다. HTF는 - 더 높은 시간 프레임을 의미합니다. 이 지표는 가격 액션 항목이 있는 다중 시간 프레임 거래 시스템이나 다른 지표와 함께 사용하기에 매우 좋습니다. HTF OsMA Indicator를 사용하면 더 높은 시간 프레임에서 현재 차트로 OsMA를 첨부할 수 있습니다 --> 이는 전문적인 거래 방식입니다.
// 더 훌륭한 전문가 자문가와 지표는 여기에서 확인할 수 있습니다: https://www.mql5.com/en/users/def1380/seller 이 MQL5 웹사이트에서만 제공되는 오리지널 제품입니다.
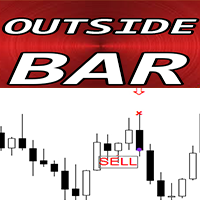
MT4용 외환 지표 OUTSIDE Bar 패턴
지표 "OUTSIDE Bar"는 가격 액션 거래에 매우 강력한 지표입니다. 다시 칠하거나 지연할 필요가 없습니다. 지표는 차트에서 OUTSIDE Bar 패턴을 감지합니다. 강세 OUTSIDE Bar - 차트에 파란색 화살표 신호(그림 참조) 약세 OUTSIDE Bar - 차트에 빨간색 화살표 신호(그림 참조) PC, 모바일 및 이메일 알림이 포함되어 있습니다. 지표 "OUTSIDE Bar 패턴"은 지원/저항 수준과 결합하기에 매우 좋습니다.
// 더 많은 훌륭한 전문가 자문가와 지표는 여기에서 확인할 수 있습니다. https://www.mql5.com/en/users/def1380/seller 이 MQL5 웹사이트에서만 제공되는 오리지널 제품입니다.
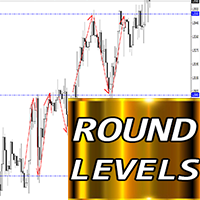
MT4용 외환 지표 "라운드 레벨"
지표 "라운드 레벨"은 지지/저항을 고려하는 트레이더에게 반드시 필요한 보조 지표입니다. 라운드 레벨은 가격에 매우 중요합니다. 가격은 라운드 레벨에서 매우 자주 반등합니다. H4, D1 시간 프레임에는 1000포인트 스텝을 사용합니다. H1 및 그 이하 시간 프레임에는 500포인트 스텝을 사용합니다(일중 거래의 경우) 또한 라운드 레벨은 이익 실현(라운드 레벨 앞) 및 SL(라운드 레벨 뒤)을 할당하는 데 좋습니다. 이러한 레벨은 특히 가격이 횡보하고 평평할 때 매우 강합니다.
// 더 훌륭한 전문가 자문가와 지표는 여기에서 확인할 수 있습니다. https://www.mql5.com/en/users/def1380/seller 이 MQL5 웹사이트에서만 제공되는 오리지널 제품입니다.
The MarketPrice Indicator is designed to provide a quick, one-glance visualization of the trend direction for a currency pair across all time frames (Time Frames), streamlining decision-making. MarketPrice Indicator is based on daily levels and trading signals derived from moving average crossovers and market strength according to various technical indicators. It comes fully configured, though you can, of course, modify any parameters as desired. Indicator Logic The indicator uses a combination

Dynamic MA Trend Zone – Dynamic Moving Average Trend Zone
The Dynamic MA Trend Zone is a visually compelling indicator that dynamically tracks changes in market trends. By displaying moving averages on three different price levels (close, high, and low), it creates a color-coded trend zone that clearly indicates the trend’s direction and strength.
Features and Functions:
- Trend Direction Color Coding: The indicator automatically color-codes the trend zones based on whether the candle’s c
FREE

Real Spread Monitor is a powerful indicator that is designed to accurately measure and analyze real spreads, giving traders the ability to compare trading conditions of different brokers. This product is also available for MetaTrader 5 => https://www.mql5.com/en/market/product/125768 Key Features of Real Spread Monitor:
1. Two modes of operation: Write mode : In this mode the indicator collects data on real spreads of the selected trading instrument and records them in a file. The spread is
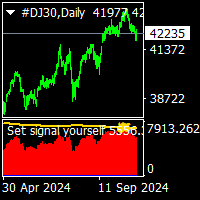
c default values has been set to euro usd pair. free demo MUST BE TESTED on EURO USD pair
set signal yourself is no repaint ,multi timeframe indicator.has too long way to signals. it work all time frame and all pairs. there is c value that you can set the signals. in any timeframe ,changing this value you can set the top and bottoms for that pair and leave it for that pair.and it work all timeframes. wave walue default has been set the 500. processed value is bar numbers on the chart and ha

This indicator is collection of important dynamic support and resistance giving a trader crystal clear idea , where to sell and where to buy. it completely complements trend lines, support, resistance, and sideways market and allow a trader to make sustainable profits. The thickness of lines suggests its strengths, the thicker the dynamic line, the stronger is rejection or pullback allowing a trader to make multi-fold profit, as they can clearly see them.
Introducing Your Ultimate Trading Edge

Scalping Worm is an essential tool for every trader aiming to improve the accuracy of their market entries and exits. With its advanced weighted moving average formula and adaptive smoothing logic, this indicator not only captures the current trend direction but also helps determine its strength and stability. The blue line signals an uptrend, while the red line indicates a downtrend, making analysis highly intuitive and visually straightforward. The main advantage of this indicator is its abili
Signal Indicator
when price is crossing Trend Lines Horizontal Lines Rectangles Works on all timeframes and with all instruments. Multiple notification types Arrows on Chart Alert box Journal Log File Log Specific Sound Email Notification (must be configured in Terminal - please review MT4 docs) Push Notification (must be configured in Terminal - please review MT4 docs) Draw your trend lines, horizontal lines or rectangles onto your chart. Select an object and bring up its properties and typ

To meet the need for quick and accurate decision-making in the market, we have launched this exceptional trend indicator. It is designed to provide clear trend analysis for your trading, reducing unnecessary noise and making trading simpler and more effective. Key Highlights and Advantages : No Redrawing : Once signals are generated, this indicator does not change with market fluctuations, ensuring the stability of your trading decisions. This avoids the confusion caused by redrawing and gives

The real market buy/Sell signals, you can trust.
This indicator tracks the trend strength, the market strength, the real current volume, and the price direction to give traders and investors the optimum point for entry in the form of signals. The time frames range from 5 minutes to one (1) hour chart.
Trading on higher time frames produce the best outcomes, but also do produce less frequent trades, compared to trading on lower time frames.
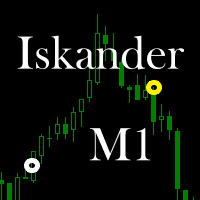
Iskander M1
Welcome back to my page!
- The Iskander M1 indicator was created specifically for the M1 timeframe. - It also works well on the M5 range. - On longer time intervals, the indicator gives rare and very rare signals.
- Iskander M1 indicator works on all currency pairs. - We have seen promising signals on the GBPJPY pair.
- Indicator does not repaint.
- The white circle represents the signal to buy. - The yellow circle indicates the signal to sell.
If the indicator is not di
Questo indicatore per MT4 traccia automaticamente livelli di supporto e resistenza basati sui frattali, evidenziando aree chiave del mercato in cui il prezzo potrebbe invertire o rallentare. I frattali sono strutture grafiche che identificano massimi e minimi significativi, formando così un sistema dinamico di livelli di supporto e resistenza. L'indicatore permette di visualizzare questi livelli direttamente sul grafico, agevolando l'analisi tecnica e l'identificazione di potenziali punti di ing
FREE

Questo indicatore avanzato è un potente strumento progettato per aiutare i trader a identificare i livelli chiave di supporto e resistenza nel mercato. Questo indicatore è versatile e offre un'interfaccia personalizzabile e intuitiva, consentendo ai trader di scegliere tra sei diversi metodi di calcolo del punto pivot: Classic, Camarilla, Woodie, Floor, Fibonacci, Fibonacci Retracement.
FREE

Questo indicatore per MT4 traccia automaticamente i punti di pivot giornalieri sul grafico, fornendo livelli chiave di supporto e resistenza basati sui prezzi di apertura, chiusura, massimo e minimo del giorno precedente. I punti pivot aiutano i trader a identificare potenziali aree di inversione e zone di prezzo critiche, migliorando la precisione nelle decisioni operative quotidiane."
FREE

La Bollinger BandWidth (BBW) è un indicatore di analisi tecnica derivato dall'indicatore Bande di Bollinger standard. Le Bande di Bollinger sono un indicatore di volatilità che crea una banda di tre linee tracciate in relazione al prezzo di un titolo. La linea centrale è in genere una media mobile semplice a 20 giorni. Le bande superiore e inferiore sono tipicamente 2 deviazioni standard sopra e sotto la SMA (linea centrale). La Bollinger BandWidth serve a misurare quantitativamente l'ampiezza t
FREE
Le Bande di Bollinger %b o Percent Bandwidth (%b) sono un indicatore derivato dall'indicatore standard delle Bande di Bollinger (BB). Le Bande di Bollinger sono un indicatore di volatilità che crea una banda di tre linee tracciate in relazione al prezzo di un titolo. La linea centrale è in genere una media mobile semplice a 20 giorni. Le bande superiore e inferiore sono tipicamente 2 deviazioni standard sopra e sotto la SMA (linea centrale). L'indicatore %b quantifica o visualizza la posizione d
FREE

The indicator defines the buy and sell arrows with high performance and consistent results. Suitable for trend trading or following the trend. Automatic analysis of market opportunities ; Help traders earn more from their investments;
Never repaints, recalculates or backpaints signals; This is FREE demo version of the indicator and works only on "EUR USD M15" . The demo version does not work on SUFFIX OR PREFIX brokers ! Forex Trend Commander All details about the indicator here :
FREE
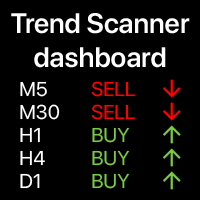
Trend dashboard: multi timeframe indicator, shows you the summary of the current trend This tool is based on the 3 major indicators: RSI, Stochastic and Commodity Channel Index. The alerts option will help you not to miss the beginning of the trend. My #1 Utility : includes 65+ features | Contact me if you have any questions | MT5 version A variety of options will allow you to customize the indicator according to your needs. Settings: Calculated bar: either the cu
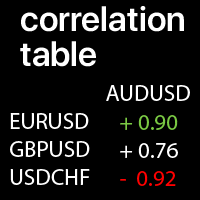
Correlation values between the selected Symbols: compare the current market trends A value of +1: means a complete positive correlation; A value of -1: means a complete inverse correlation; A value of 0: means there is no explicit correlation (prices do not depend on each other, or the correlation is random ); My #1 Utility : 65+ features | Contact me for any questions | MT5 version Each Symbol can be customized: removed / replaced. You can add up to 10 Symb
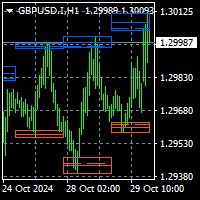
To get access to MT5 version please click here . Note: Multi time frame option is not available with this indicator. To order multi time frame please contact via private message. This is the exact conversion from TradingView: "Supply and Demand Daily byLuxAlgo". This is a light-load processing. All input options are available except multi time frame option. Buffers are available for processing in EAs. Only the latest bar of every new day(rightmost) holds the valid value. You can message in pr

Hey there! If you are using Moving Average indicator into RSI indicator's window and always wondering if there could be a way to get alerts on your smartphone when those two indicators get a crossover that would be great, right!? Then you have found the right tool for that. This indicator is nothing but a mix of MA indicator and RSI indicator into one indicator window as well as it will give you alerts for crossovers on your smartphone app, email and also on your trading terminal's (desktop) cha
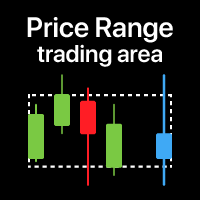
Price zone: v isualization of the trading range for the selected time period E specially useful when trading on low timeframes , so that you can see the range from a higher TF . My #1 Utility : 65+ features, including this indicator | Contact me for any questions | MT5 version When it might be useful: When using multiple time frames To see the overall picture from a different period To see the entire range for the selecte
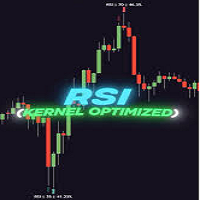
GENERAL OVERVIEW
Introducing our new KDE Optimized RSI Indicator! This indicator adds a new aspect to the well-known RSI indicator, with the help of the KDE (Kernel Density Estimation) algorithm, estimates the probability of a candlestick will be a pivot or not. For more information about the process, please check the "HOW DOES IT WORK ?" section. Features of the new KDE Optimized RSI Indicator :
A New Approach To Pivot Detection
Customizable KDE Algorithm
Realtime RSI & KDE Dashboard

Indicator detects long bars. How to use:
base = base value in points of our long bar if this value is larger than bar we have our signal. useSplit = when we want to divide our trading into two before and after preset time. Both before and after work the same as our base . splitTimeHour = split time hour 14:00 would be 14. splitTimeMinute = split time minute 14:30 would be 30. before = same as base long bar value in points. after = same as base long bar value in points. useATR = instead
To get access to MT5 version please contact via private message. You can also check the other popular version of this indicator here . This is the exact conversion from TradingView:"Optimized Trend Tracker" by "kivancozbilgic" This is a light-load processing indicator. It is a non-repaint indicator. Highlighting option is not available due to MT4 restricted graphics. Buffers are available for processing in EAs. You can message in private chat for further changes you need. Thanks.

The indicator provides arrows and a moving average
The arrows is based on T3 and only shows bullish signals above moving average and vice versa - Where candle closes
The moving average shows color change based on slope
I didn't add alert because to many arrows
Suitable for any timeframe and symbol
Please test extensively in tester before purchase!
Enjoy! ----------------------
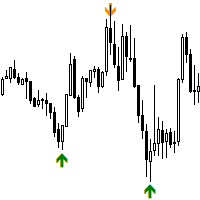
Swing Points Indicator for MetaTrader 4
The **Swing Points Indicator** is a custom-built technical tool designed for MetaTrader 5 (MT5), primarily used for identifying crucial reversal points in price action. By plotting swing highs and swing lows, it highlights potential trend reversals, making it a valuable tool for traders relying on price action analysis. This indicator helps traders anticipate changes in market direction by visually marking significant turning points on the chart.
Main

Buy Sell Arrows Indicator
Maximize trading accuracy with our advanced Buy Sell Arrows Indicator , engineered to deliver clear, actionable signals for optimal entry and exit points. Designed to work seamlessly on M5 and higher timeframes , this indicator provides reliable buy/sell alerts through a unique combination of trend-following and momentum-based strategies. Key Features: Dual Moving Average Crossover : This core strategy uses Faster and Slower EMA crossovers , identifying bullish or bea
FREE

The Zone1 is a tool to help professional or novice traders to assist in making decisions to buy or sell. This indicator is also not repainted so it is also suitable for scalping strategies, day trading and even swing strategies. i hope you can profitable like me....
if you have quotion abot this product you can contact me via email ichwan.dreamweaver@gmail.com

What is Elliott Wave analysis all about? You probably heard something about Elliott waves or even seen wave counts. That's because nowadays Elliott wave analysis becomes one of the most popular approaches of the Forex market forecasting. Why? Elliott Wave Principle is the only tool in our experience, which can sort out the price movement on every timeframe from the Monthly or even Yearly chars to just one-minute intraday intervals. The Elliott Wave Theory is a technical analysis concept used to
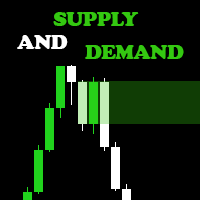
Are you ready to elevate your Forex trading game? Introducing the Supply and Demand Indicator , a powerful tool designed to help traders identify key market zones and make informed decisions with confidence! Key Features: Accurate Zone Identification : Our indicator pinpoints critical supply and demand zones, allowing you to spot potential reversal points and areas of price consolidation. User-Friendly Interface : With an intuitive design, you'll easily navigate through the settings and custom

LAUNCH PROMO: Only a few copies left at current price! Final price: 199$ https://discord.com/invite/nc43Mg7JaX WELCOME: AutoTrend uses multiple confirmation algorithms to find the best entry price and runs multiple strategies internally to spread the risk of the trades. This strategy has been tested across different pairs, using multiple pricefeeds for various brokers, nothing seems to be able to make it fail. NOTE TO USERS For guidance regarding setup, please join discord or contact me in priv
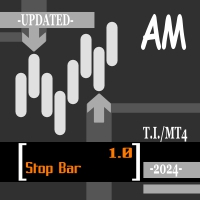
The indicator accurately identifies a short-term trend both on trend and flat markets. The confirmation of the signal is the overcoming by the price of the high/low of the bar on which the signal was given. Signals are given on fully formed bars and are not redrawn. Calculations are based on the system of Moving Averages. The indicator is highly sensitive. Use it together with other technical analysis indicators.
Settings: Sensitivity - amount of bars for the indicator calculation (1 or higher
Expiry Arrows - a technical indicator that gives signal arrows on fractal points. Based on RSI indicators.
Works in two modes, only down arrows or only up arrows. Use on two charts. Can be used independently or together with trend indicators.
If used independently, you need to open the H1 or H4 time frame, after the signal arrow, wait for the signal on M5 or M15.
Arrows are displayed when the candle opens, they are not redrawn. You can change the frequency of signal arrows.
The indicator pro

Official Release price of $65 for the first 48 /50 copies ( 2 copies left). Next price is $120 !
Send us a message after your purchase to receive more information on how to get your BONUS for FREE that works in great combination with Bull vs Bear !
Bull versus Bear is an easy-to-use Forex indicator that gives traders clear and accurate signals based on clear trend retests . Forget about lagging indicators or staring at charts for hours because Bull vs Bear provides real-time entries

무료 MT4 지표: https://www.mql5.com/en/market/product/125434 무료 MT4 어시스턴트: https://www.mql5.com/en/market/product/107986
이 무료 도구가 마음에 드셨다면 5점 만점에 5점을 주세요! 정말 감사합니다 :) 랠리 베이스 랠리(RBR), 드롭 베이스 랠리(DBR), 드롭 베이스 드롭(DBD), 랠리 베이스 드롭(RBD), 공정 가치 갭(FVG)/불균형, 숨겨진 베이스
"공급 수요 MT4" 지표를 소개합니다. 정확하고 확신을 가지고 역동적인 금융 시장을 탐색하기 위한 최고의 도구입니다. 이 최첨단 지표는 거래자에게 공급 및 수요 역학에 대한 실시간 통찰력을 제공하여 정보에 입각한 의사 결정을 내리고 거래 잠재력을 극대화하도록 세심하게 설계되었습니다. 주요 기능: 자동화된 존 식별: 이 지표는 고급 알고리즘을 사용하여 가격 차트에서 주요 공급 및 수요 존을 자동으로 감지하고 표시합니다. 이러한 존
FREE

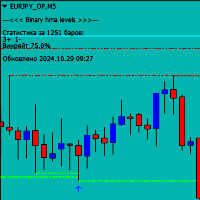
MT4용 Binary HMA Levels 인디케이터는 이진 옵션에 특별히 설계되었지만, Forex 거래에도 매우 적합합니다. 이 인디케이터는 중요한 레벨에서 가격이 반등할 때 화살표 형태로 신호를 제공하며, 현재 캔들이 닫히기 전에 확인됩니다. 인디케이터가 올바르게 작동하려면 "MQL5" 폴더를 터미널 디렉토리에 다운로드하여 설치해야 합니다. 폴더는 이 링크를 통해 다운로드할 수 있습니다: https://disk.yandex.ru/d/DPyo0ntaevi_2A 이 인디케이터는 모든 타임프레임과 통화쌍에서 작동하는 범용 인디케이터이지만, 더 정확한 신호를 얻으려면 최적의 만기 시간과 타임프레임을 선택하는 것이 중요합니다. 또한 신호의 성공률을 차트에 직접 표시하여 그 효과를 평가하는 데 도움이 됩니다. 기본적으로 만기 시간은 1분으로 설정되어 있어 단기 거래에 이상적이며, 인디케이터 설정에서 조정하여 통계를 정확하게 표시할 수 있습니다.

"Easy Indicator" forex is a pointer indicator based on non-standard calculation principles. The optimal exit is marked with a yellow cross, it signals the optimal exit point in the current trend. An emergency exit is marked with a red dot, signaling a possible change in trend. The “Risk” section displays the current risk for a given transaction, which is calculated taking into account the features of the current chart.
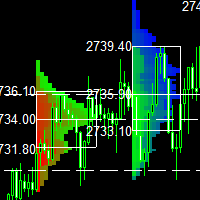
This indicator is a classic implementation of the Market Profile (Volume Profile Visible Range), allowing for the display of price density over time while highlighting the most significant price levels, the value area, and the control price within a specific trading session. MT5-version: https://www.mql5.com/en/market/product/125308 The indicator can be applied across timeframes from M1 to D1, enabling the analysis of market profiles for daily, weekly, monthly, or intraday trading. Utilizing l
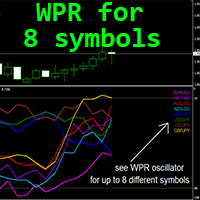
MT4용 외환 지표 "8개 심볼에 대한 WPR", 리페인트 없음
WPR 자체는 스캘핑을 위한 최고의 오실레이터 중 하나입니다. 강력한 매수 과다 영역(-10 이상)에서 매도 진입을 취하고 강력한 매도 과다 영역(-90 미만)에서 매수 진입을 취하는 것이 좋습니다. "8개 심볼에 대한 WPR"은 단 하나의 차트에서 최대 8개의 다른 심볼의 WPR 값을 제어할 수 있는 기회를 제공합니다. 이 지표는 매도 과다/매수 영역의 가격 액션 진입과 결합하기에 매우 좋습니다. ..................................................................................................................................................... // 더 많은 훌륭한 전문가 자문가와 지표는 여기에서 확인할 수 있습니다. https://www.mql5.com/en/users/def1380/seller
123456789101112131415161718192021222324252627282930313233343536373839404142434445464748495051525354555657585960616263646566676869707172737475767778798081828384858687888990919293949596979899100101102103104105106107108109110111112113114115116117118119120121122123124125126127128129130131132133134135136137138139140141142
MetaTrader 마켓 - 거래자를 위한 로봇 및 기술 지표는 거래 터미널에서 바로 사용할 수 있습니다.
The MQL5.community 결제 시스템은 MQL5.com 사이트의 모든 등록된 사용자가 MetaTrader 서비스에서 트랜잭션을 수행할 수 있습니다. 여러분께서는 WebMoney, 페이팔, 또는 은행 카드를 통해 자금을 예치하거나 인출하실 수 있습니다.
트레이딩 기회를 놓치고 있어요:
- 무료 트레이딩 앱
- 복사용 8,000 이상의 시그널
- 금융 시장 개척을 위한 경제 뉴스
등록
로그인
계정이 없으시면, 가입하십시오
MQL5.com 웹사이트에 로그인을 하기 위해 쿠키를 허용하십시오.
브라우저에서 필요한 설정을 활성화하시지 않으면, 로그인할 수 없습니다.