适用于MetaTrader 4的新技术指标 - 97
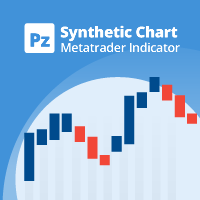
This indicator creates synthetic charts. It creates a candlestick chart plotting the price of one instrument measured against another, helping you to find hidden opportunities in the market crossing relationships between different instruments. [ Installation Guide | Update Guide | Troubleshooting | FAQ | All Products ] Find hidden trading opportunities Get a broader sense of the price of commodities Commodities range against each other and are easier to trade Correlated Indices can be traded ag
FREE

This indicator calculate the minimum,maximum,average and relative (to points of the bar) spread in the chart applied period. The indicator must be applied to one or more different period on a Pair and analyze the spread for all the Pairs available by the Broker. The csv output for one minute chart is something like this https://gofile.io/?c=K5JtN9 This video will show how to apply the indicator https://youtu.be/2cOE-pFrud8 Free version works only for GBPNZD
FREE
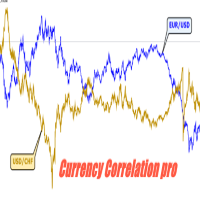
Currency Correlation pro
Currency correlation happens when the price of two or more currency pairs moves in conjunction with one another. There can be both positive correlation, where the price of the currency pairs moves in the same direction and negative correlation, where the price of the currency pairs moves in opposite directions. this indicator put the price of 5 pairs on sub-windows so you see what happens in one chart.
How to use Correlation Indicator?
You can simply choose curren
Fast Signal Fx This indicator is working very simple. The indicator will detect the swing pattern and find the return point. The main structure was combined with Stochastic Oscillator level for return point and moving average calculation for confirm the direction. The important strategy is making fast signal for scalper trading technique with high frequency trade. Indicator Installation Attach this indicator to the chart window of currency pairs. The recommended currencies are EURUSD, GBPUSD, U
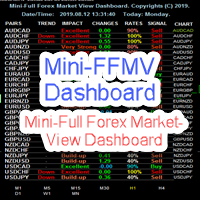
MINI FFMV Dashboard MINI FFMV Dashboard is a MINIATURE custom indicator of FULL FOREX MARKET-VIEW DASHBOARD created to give the Traders a full view of what is going on in the market. It uses a real time data to access the market and display every bit of information needed to make a successful trading. It shows as many as 30 currency pairs or as allowed to display in the Market Watch of your MT4 USAGE: For Solo Trading For Basket Trading (See the screenshot on how) COMPONENTS: Trend: Overall tren

Mini Forex Market-View Dashboard and Mini-CSM Mini Full Forex Market View Dashboard is a miniature creation of FULL FOREX MARKET_VIEW Custom indicator created to give the Traders a full view of what is going on in the market but in a partial matter to make it conscise. It is useful most especially for those who don't like bogus indicators or those who have a PC with limited screen size. It uses a real time data to access the market and display every bit of information needed to make a successful

This indicator calculate the minimum,maximum,average and relative (to points of the bar) spread in the chart applied period. The indicator must be applied to one or more different period on a Pair and analyze the spread for all the Pairs available by the Broker. The csv output for one minute chart is something like this https://gofile.io/?c=K5JtN9 This video will show how to apply the indicator https://youtu.be/2cOE-pFrud8

Bermaui 销钉
或者 (BPB) 是一个指标,可以在图表上找到 Pin Bars 价格行为模式。 Pin Bars 是“Pinocchio Bars”的快捷方式,它是日本烛台的经典条形图案替代品. Bermaui Pin Bars 指标根据可以在后续步骤中解释的公式找到此模式:
首先 BPB 计算蜡烛主体的中心 (= [开盘 + 收盘] / 2)。 然后 BPB 找到实体中心和蜡烛低点之间的距离。 最后一步是将第 2 步的结果除以蜡烛图范围。 如果蜡烛主体中心太靠近蜡烛的高点或低点,则 BPB 会检测到 Pin Bar 模式并提醒用户。 Bermaui Pin Bars 公式 : https://www.mql5.com/en/blogs/post/729139 我通过添加以下内容增强了 Bermaui Pin Bars 功能: 多时间框架蜡烛方向面板 告诉您所有时间框架的当前蜡烛情况。其中绿点表示关闭>打开,红色表示关闭<打开,黄色表示关闭=打开。
Bermaui Bands 可帮助您确定当前趋势是看涨、看跌还是中性。 你可以从这里 阅读更多关于它的信息。 Berma

通常,交易者面临着确定价格在不久的将来可能发生变化的程度的任务。为此,您可以使用Johnson分发类型SB。这种分布的主要优点是即使只有少量的累积数据也可以使用它。用于确定此分布参数的经验方法允许您准确地确定价格通道的最大和最小水平。 这些值可用于不同的情况。例如,它们可用于设置市场订单的止损和止盈水平,或挂单的入场点。此外,使用追踪止损时可以定向这些水平。此外,在历史足够大的情况下,指标可能预示着上升趋势或下降趋势的开始。嗯,或者说它的结束,如果这样的趋势是。 该指标的主要缺点是对价格排放的敏感度极高,以及对市场形势变化的反应较迟。 蓝色和红色线分别显示价格通道的最大值和最小值。绿线表示在给定市场情况下价格的均衡值。 使用 LB 参数配置指标。此参数确定将在计算中使用的柱数,其允许值在2-64之间。
做事、做交易讲究天时地利人和,平常我们大多数时候只关心在哪个价位开仓、在哪个价位止损、在哪哪个价位止盈,这叫地利。很少去关注在什么时候去开仓、止损、止盈,这个叫天时。 这个指标可以帮助您去寻找什么时候去做交易,什么时候应该关了电脑去陪家人、旅游、和玩乐。 不管您是图表交易者,趋势交易者,日内短线交易者,或是剥头皮交易者,相信这个指标会对您大有帮助。 比如画趋势线时去连接对应时间框架内的低点,这回您会发现趋势线变得更有趣了。 其他的我这里不做赘述,您可以根据您的交易策略发现这个指标的其他很有意思的用处。 指标没有外部参数,不会根据回溯柱的个数不同而使结果不一致,所有使用的条件都完全来自市场,也就是市场怎么说咱就怎么做,永远跟随市场的脚步。

Mars 8 is a TREND indicator is a powerful indicator of TREND DIRECCTION for any par and any timeframe. It doesn't requires any additional indicators for the trading setup.The indicator gives clear signals about opening and closing trades.This Indicator is a unique, high quality and affordable trading tool. Can be used in combination with other indicators Perfect For New Traders And Expert Traders Low risk entries. Never repaints signal. Never backpaints signal. Never recalculates signal. For
Strike Line is an accelerator combining in itself a large number of the best tools filtered An exclusive algorithm ...
-------------------------------------------- It is great for scalping or binary options trading this the tool does not lag he draws there is a multi currency with him very simple work use given the tool stands with additional filters for example, like makdi or bolinger waves ......

Motivated from: A market is the story of cycles and of the human behavior that is responsible for overreactions in both directions. - Seth Klarman
NeuroWave Scalper PRO is a advanced powerful cycle algorithm which depicts the cycles of market in a effective manner.This Indicator works in trending as well as ranging market conditions. This indicator is perfect for scalp trades as well as swing trades. NeuroWave Scalper PRO is not just an indicator, but a trading strategy itself. It doesn

Chart Linker This tool is indicator for linking charts in Metatrader 4. Thanks to this tool you have to change symbol only in the main window and all other change automatically. Add this tool to all charts that you want to be linked with each other. Set one chart as a main. Change symbol in the main window and linked windows change automatically to the new symbol.
Compare to https://www.mql5.com/en/market/product/30048 Chart linker can work simultaniously with other indicators and/or expe

Automatic redrawing of Trend Supports and resistances levels and Possible Wedge pattern formation to indicate price breaking of Rising Wedge (signal SELL) or price breaking of falling Wedge (signal BUY) Very simple and smart indicator ALERTS AND MOBILE NOTIFICATIONS availavle !!! you can edit the calculation bars of the bars count for formation of the trend lines and the initial shift from current price Smaller values for bars /shift inputs when using Higher Time frames (D1-H4) and the reverse

MM Trend Direction follow trend. Color change trend changed. Works in EURUSD/GBPUSD/AUDUSD/USDCHF/EURNZD/NZDUSD/SILVER/USOIL/US500/AUS200/USDTRY/EURTRY and all pairs
Best timeframe 15M
Signal on close of a bar.
DOES NOT repaint. DOES NOT repaint. DOES NOT repaint. DOES NOT repaint.
DOES NOT recalculate. DOES NOT recalculate. DOES NOT recalculate. DOES NOT recalculate NOTE : COLOR CHANGED TREND CHANGED
Settings : No Settings
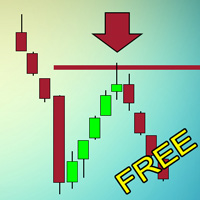
Индикатор, который ищет качественные точки входа в рынок и отображает их в виде стрелок. Действует по сложному алгоритму. Сначала ищет на графике специальные уровни, которые обязательно должны быть пробиты импульсом. Если цена возвращается к этому уровню в виде свечи с длинной тенью и маленьким телом и касается уровня только тенью - возникает точка входа. Не перерисовывается! Лучше всего выглядит и отрабатывает на Н1.
Может использоваться как: Индикатор уровней, где цена будет останавлива
FREE
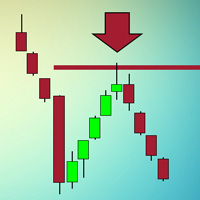
Индикатор, который ищет качественные точки входа в рынок и отображает их в виде стрелок. Действует по сложному алгоритму. Сначала ищет на графике специальные уровни, которые обязательно должны быть пробиты импульсом. Если цена возвращается к этому уровню в виде свечи с длинной тенью и маленьким телом и касается уровня только тенью - возникает точка входа. Не перерисовывается! Лучше всего выглядит и отрабатывает на Н1.
Может использоваться как: Индикатор уровней, где цена будет останавлива

Индикатор показывает: открытые ордера по инструменту; количество ордеров; профит по Buy и Sell каждого инструмента; суммарный профит. Количество строк и столбцов по инструментам определяется автоматически, в зависимости от ширины окна. Индикатор обновляется по таймеру, время обновления задается в настройках. Устанавливать индикатор можно любой график вне зависимости от ТФ и пары. Клик по названию инструмента переключает текущий график на выбранный. Совместно со скриптом https://www.mql5.com/ru/
FREE
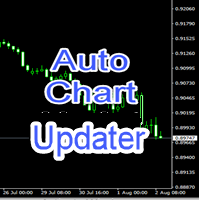
Auto Chart Updater Indicator is created to update the window chart for any indicator, expert or any trading program receive fresh data retrieval at xx period interval set by the user as a preference. It is laced with on-chart Candle clock to give the user the sense of time when the updater would refresh the chart or the remaining time for the candle/session to end. It also has an option for the user to choose when exactly does he/she wants the Updater to update the chart. The User can also selec
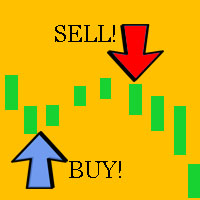
準備交易系統,讓交易者買入和賣出信號。將指標放在圖表上就足夠了,它會自動分析市場情況,確定趨勢方向,計算支撐位和阻力位,分析價格運動動態,並以箭頭的形式在圖表上顯示交易者需要打開訂單的時刻和方向。
ScalpingCircles的交易策略: 使用這些信號進行交易非常簡單。向任何貨幣對添加指標,並查看圖表底部預測的利潤額。如果利潤額很小或指標預測虧損,我們可以更改貨幣對或時間範圍。如果利潤額適合我們,請等待指標發出信號。如果您打開指示器設置並在SIGNAL = true參數中指定,指示器將向我們的手機和電子郵件發送信號。在指標給我們買入信號(藍色箭頭)後,我們打開買單並設定訂單量為0.05。獲利100點。追踪止損設為50點。止損設定120點。在指標向我們發出賣出信號(紅色箭頭)後,我們打開賣單並設定訂單量為0.05。獲利100點。追踪止損設為50點。止損設定120點。我們還可以在交易策略中使用具有受控損失水平的鞅。如果訂單在虧本時以止損方式平倉,則下一個訂單將以前一個訂單的兩倍打開。如果虧損交易系列為3,則從0.05的起始交易量開始下一個第四個訂單。此交易策略允許您以最小的風
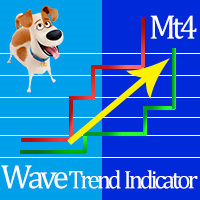
严格按照道氏理论制作的波段高低点,可以用来区分支撑和阻力位置,也可以对趋势起点进行识别,还可以用来止盈止损。 不管您是趋势交易者,日内短线交易者,或是剥头皮交易者,相信这个指标会对您大有帮助。 比如当价格下穿绿线,当前空头趋势开始,同样当价额上穿红线,多头趋势开始,对应的高点与低点作为对应开仓的有效止损线,对应的反向穿越作为止盈的位置。 当然配合其他理论比如图表、江恩、海龟、等等能使指标发挥更大作用。 其他的我这里不做赘述,您可以根据您的交易策略发现这个指标的其他很有意思的用处。 指标没有外部参数,不会根据回溯柱的个数不同而使结果不一致,所有使用的条件都完全来自市场,也就是市场怎么说咱就怎么做,永远跟随市场的脚步。

indicator for trading binary options and forex trading. The indicator does not redraw the readings. when trading binary options, testing was performed. This indicator showed the good results correct predictions.
Under these conditions, the eur / usd m1 chart, when a signal appears, the transaction opens in the direction indicated by the indicator for 5 candles, then the truth is (5 minutes since in us the 1-minute chart of a candlestick is 1 minute) the result was.
When trading in the forex

Indicator patterns Price Action. The indicator uses in its work 12 patterns, a trend channel and horizontal price lines (support and resistance lines). You can work both by channel and lines, or simply by patterns. Some patterns are customizable. Below is a small manual.
Period of candles: Set the period on which the indicator will work.
Parameters of information on the chart
Consider trend and horizontal

This indicator can be interpreted as a trend and channel indicator. The indicator divides the market into two parts. In one part, it is more promising to buy, the whole price zone is allocated for purchase. In the other part, for sale, there is also an entire zone. If you work with algorithms such as grids or catch-up, then this indicator is very good to use for work.

Update: Push to mobile notification is now added as optinal in the settings. Most traders fail to generate profit because of the lack of so-called filters and scanners. If you want to win at trading you need a solid system and also a filtering tool for some or all of your entry criteria. It is impossible to follow 24 currency pairs, all the indices, stocks and commodities without a filtering tool. Imagine you can get an email any time CCI crosses bellow 100 and 0 when the price is bellow MA5 an

DailyFx - EA for scalping. Works on the principle of a smooth analysis of the market and the determination of peak wave values. With the help of three adaptation algorithms, EA systematically scans the time segments of the price chart by determining the impulse points of contact between demand and supply. The smoothed neural network algorithm, learning from historical data of price behavior, predicts its further behavior.
Trading with the indicator is very simple. To do this, simply place the

Stick - уникальный авторский индикатор, отображающий сигналы в направлении основной тенденции, и против нее. Благодаря разнообразию настроек и фильтров индикатор можно настроить под свой стиль торговли. Stick подходит для любого таймфрейма, валютной пары. Сигналы индикатора не пропадают ни при каких условиях. Отличительной особенностью является возможность настроить сигналы индикатора отдельно для тенденции и против нее. С помощью Stick можно открывать сделку только в направлении основного д

Индикатор отображает бары в системе High-Low-Close ( HLC ). Имеется возможность выделять бары с увеличенным объемом. Простые понятные настройки цвета, толщины баров. Входные параметры Width Line – толщина баров. Color Down Bar – цвет медвежьего бара. Color Up Bar – цвет бычьего бара. Color Undirected Bar – цвет ненаправленного бара. Volume Level (0-off) – уровень объема для показа бара с увеличенным объемом (0-отключено). Color Volume Bar – цвет бара с увеличенным объемом.
FREE

This is a very powerful indicator which is very useful in trend detection the way is used is similar to moving average but giving very reliable results. principle is very easy, that depicts a mobile support and resistance line when the price is below the orange line the trend is bearish and the line act as resistance and as soon as the resistance is broken and price is above the line then the trend becomes bullish and the line changes into the support line. this can be used in any time frames. i

A great indicator that allows one to spot reversals, and follow a trend easily, on any timeframe. Works on any forex pair and other instruments. Works extremely well on exotic pairs It changes colour and direction and can be set to provide an alert for both long and short trades. It can also be used to set the stop loss and manually trail the trade. The indicator can be used on different timeframes easily, and is reliable in that it does not change during slight market corrections, once a tren

ADX arrow
该指标将 ADX indicator (平均方向移动指数)的信号显示为图表上的点。
这便于信号的视觉识别。 该指示器还具有警报(弹出消息框)和向电子邮件发送信号。
参数 Period -平均周期。 Apply to -用于计算的价格:关闭,开放,高,低,中位数(高+低)/2,典型(高+低+关闭)/3,加权关闭(高+低+关闭+关闭)/4。 Alert -启用/禁用警报。 EMail -启用/禁用向电子邮件发送信号。 Push -启用/禁用发送信号推送 Period - averaging period. Apply to - price used for calculations: Close, Open, High, Low, Median (high+low)/2, Typical (high+low+close)/3, Weighted Close (high+low+close+close)/4. Alert - enable/disable alerts. EMail - enable/disabl

Are you tired of wasting time trying to figure out the total value of your TP and SL lines on Metatrader charts? Look no further, because we have a solution for you. Introducing our free MT4 indicator that allows you to easily track the total SL and TP of your positions on any corner of your screen. With customizable X-Y parameters and color options, you can personalize your screen to fit your trading style. Say goodbye to the hassle and confusion of monitoring your positions, and make smarter
FREE

Th3Eng PipFinite PRO Indicator This product is distinct from the Th3Eng PipFinite Original, utilizing a different logic and algorithms. The Th3Eng PipFinite Pro indicator offers analysis of trend directions using custom algorithms. It provides indications of trend direction, entry points, a stop loss point, and three take profit points. The indicator also displays pivot points, dynamic support and resistance channels, and a side-box with detailed current signal information.
How to Trade with

Arrow signal indicator for scalping Defines price reversals, kickbacks and trend changes All arrows remain in place and do not disappear Can send notifications to your phone or email Works on any currency pairs, metals and cryptocurrency Suitable for working with binary options Distinctive features Does not redraw; Defines trend changes; Sends signals to a smartphone or email; Advanced settings for fine tuning; Works on all timeframes and on all symbols; Suitable for trading currencies, metals,

Mars 7 is a Trend indicator is a powerful indicator of TREND CHANGE for any par and any timeframe. It doesn't requires any additional indicators for the trading setup.The indicator gives clear signals about opening and closing trades.This Indicator is a unique, high quality and affordable trading tool.
Perfect For New Traders And Expert Traders Low risk entries. Never repaints signal. Never backpaints signal. Never recalculates signal. For MT4 Only Great For Scalping Great For Swing Trad

A simple indicator algorithm with the highest accuracy generates input signals by intersecting lines. Strategy for trading by trend, filtering and all the necessary functions built into one tool! The principle of the indicator is to automatically determine the current state of the market when it is placed on a chart, analyze historical data, based on historical data and display instructions to the trader for further actions. The system itself shows in the form of intersection of lines when to bu
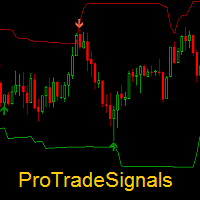
Dear traders, ProTradeSignals is a professional trading indicator. It performs Multi time frame analysis using Price- Volumes- Volatility. Main indicator alongwith its adaptive bands helps in trading in different market conditions.
Please refer to attached video for detailed information on the indicator.
If you have any further queries, feel free to write to use.
Thanks for showing interest in this indicator.
About us: We are a small team of professional traders with experience in fore

Intraday Volume Profile Forex MT4 Intraday Volume Profile - This is a visualization tool for understanding the high activity zone and low activity zone, as part of the D1 senior timeframe. The volume profile provides an excellent visual image of supply / demand at each price for the selected timeframe. Introducing POC - Point of Control, which indicates the price at which the maximum volume was sold, as well as Value Area - the area where 68% of the instrument's assets are traded. POC -

Session Volume Profile is an advanced graphical representation that displays trading activity during Forex trading sessions at specified price levels. The Forex market can be divided into four main trading sessions: the Australian session, the Asian session, the European session and the favorite trading time - the American (US) session. POC - profile can be used as a support and resistance level for intraday trading.
VWAP - Volume Weighted Average Price.
ATTENTION! For the indicator to
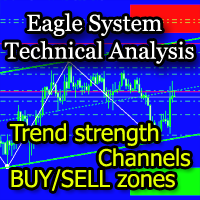
The EagleSystem indicator is a complete trading system.
The indicator algorithm determines wave movements, price channels formed, Pivot-levels, zones of intended purchases and sales (overbought / oversold zones).
The indicator can be used both independently and as an addition to any trading system.
Settings Alert for turning points - Alert when forming a point; Send Emails - Send to e-mail; Display the EagleSystem - Show price peaks; Alert at the color dot change - Alert when the dot chan

The indicator algorithm with the highest accuracy generates input signals using the arrows. Strategy for trading in a flat, all the necessary functions built into one tool! The principle of the indicator is to automatically determine the current state of the market when it is placed on a chart, analyze historical data, based on historical data and display instructions to the trader for further actions. The system itself shows in the form of arrows when to buy and when to sell.
Magic Trend Signal Arrow is an indicator that generates trade arrows. It generates trade arrows with its own algorithm. These arrows give buying and selling signals. The indicator certainly does not repaint. Can be used in all pairs. Sends a signal to the user with the alert feature.
Trade rules Enter the signal when the buy signal arrives. In order to exit from the transaction, an opposite signal must be received. It is absolutely necessary to close the operation when an opposite signal is re

Base Trading System (MTF) MULTI TIME FRAME
For Single Time Frame click here BASE TRADING SYSTEM MTF is a useful tool to trade with simple strategy. It draws automatically base up for long trade and base down for short trade. Clear trade when base is going opposite direction. User can trade by instant market entry or by pending order entry. It depends on user best strategy. input: Arrow UP, Arrow DOWN. Base Box Color- UP base box , DOWN base box, UP base shadow, Down base shadow.

This dashboard is designed and simplified for use on the standard mt4 terminal. There are 1 spread columns and adjustable signal columns for 5 different timeframes. For the signals, I used a special indicator that I developed and called mars. I haven't published the Mars indicator in the market yet. You can use this indicator only as dashboard signals. I'm in preparation for an expert for the indicator, and I will publish it when it's ready. ( Published https://www.mql5.com/en/market/product/40

The Multi Trendlines indicator automatically draws the dominant trendlines on the current chart. The indicator looks for the 5 best Up trends and the 5 best Down trends as at the current price, drawing each trendline if filter conditions are met. The trendlines are named "Trendline"+[Direction]+Symbol()+TrendlineSequenceNumber For example: The second Up trendline on a EURUSD chart would be named "TrendlineUpEURUSD2". To get its current value would be: ObjectGet("TrendlineUpEURUSD2",OBJPROP_PRI
FREE

The Sentiment Ratio indicator gauges current Market Sentiment between -100% and 100%, where lower than -40% is considered Bearish and higher than 40% is Bullish. The channel between the two is considered Neutral. The indicator has been a very useful filter tool for signals within a trading system.
Example call function: int SentimentIndicator(double triggerLevel)//Return sentiment if trigger level is activated { double sentimentRatio=iCustom(NULL,0,"Sentiment Ratio",0,0,0); if(sentimentRa
FREE

其中一种强大的分析方法是使用Levy流程对财务系列进行建模。这些过程的主要优点是它们可用于模拟大量现象 - 从最简单到最复杂。我只想说市场中分形价格变动的想法只是Levy过程的一个特例。另一方面,通过适当选择参数,任何Levy过程都可以表示为简单的移动平均值。图1显示了一个Levy过程的示例,其中片段放大了几次。 让我们考虑使用Levy流程来平滑价格图表的可能性。首先,您需要选择Levy过程的参数,以便它可以用于模拟线性过程。然后我们得到一个权重系统,其中包括不同符号的系数。有了这个,我们不仅可以平滑金融范围,还可以跟踪其中存在的反趋势和周期性成分。 通过选择参数 LF 来配置指示器的操作。它决定了故事的深度,并将对其进行分析。此参数的允许值位于0 - 255之间。用于计算的条形数将比此数字多两个。 蓝线表示高价平滑的结果,绿线表示收盘价,红线表示低价。 该指标的主要缺点是根据严格定义的算法执行抗锯齿,该算法没有考虑市场中的急剧和强烈变化。此外,与所有平滑指标一样,存在可以达到简单移动平均值的滞后。
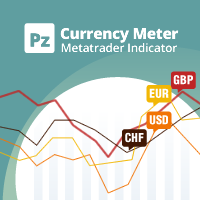
用强货币兑弱货币交易始终是最安全的做法。该指标衡量主要货币之间的相对强度,使工具选择更加容易,进出交易更加容易。基本思想是使用强势货币作为对冲货币来攻击弱势货币,反之亦然。买强反弱,短期买弱反强。 [ 安装指南 | 更新指南 | 故障排除 | 常见问题 | 所有产品 ] 一目了然地找到强弱货币 轻松将一种货币与另一种货币进行比较 货币升值了吗?寻找多头 货币在贬值吗?寻找短裤 它实现了一个多时间仪表板 这是交易的最高品质确认 该指标根本不需要优化 可定制的回溯期 指示器不重涂 解释指标非常容易。它比较了27种货币对的当前价格和以前的价格,并计算了每种货币兑其他所有货币获利或损失的次数。由于只有8种货币,因此最高得分为+7,这意味着相对于所有其他货币获得了一种货币,而最低得分为-7,这意味着相对于所有其他货币而言,该货币损失了。将为每个时间范围计算此逻辑,并将其显示在仪表板中,以帮助您找到所有时间范围内的强弱货币。
重要提示: 该指标在测试仪中不起作用,MT4不支持多币种背书。不要回测。
指标剖析
货币计量器指标评估几种货币对,并以绝对值确定在确定的时间段内哪种货币相对于所

当在多个时间范围内识别出一个或多个趋势反转蜡烛形态时,此多时间框架和多品种指标会发送警报。它可以用于从 M5 到 MN 的所有时间范围。可以启用移动平均线或 RSI 趋势过滤器以仅过滤掉最强的设置。结合您自己的规则和技术,该指标将允许您创建(或增强)您自己的强大系统。 特征
可以检测以下模式:Pin bar、吞没、镊子、晨星/晚星、三线罢工和三只黑乌鸦/白人士兵。 可以选择要使用的时间范围。 在仪表板内持续执行反转强度等级排序。可以禁用此排序,以便更轻松地找到特定符号。然后,交易品种将按照它们在交易品种参数中输入的相同顺序显示,或者按照它们在市场报价窗口中显示的顺序显示。 通过在矩形内单击,将打开一个带有相关交易品种和时间范围的新图表。 将指标放在一张 M5 图表上就足够了,您将收到来自您选择的任何交易品种的警报。支持所有 Metatrader 原生警报类型。 输入参数
请在此处 找到输入参数的说明和解释。 重要的
指标必须放在 M5 图表上,这是一个干净的图表,上面没有任何其他指标或智能交易系统。该指标将被加载到一个指标窗口,然后您可以将其展开以覆盖整个图表。 请注意,策略测试

The principle of the indicator.
The Asummetry indicator allows you to predict the beginning of a change in the direction of trends, long before their visual appearance on the price chart. The author statistically revealed that before changing the direction of the trend, the probability distribution function of the price is made as asymmetric as possible. More precisely, the price movement in any direction always pulls sideways the function of its dis
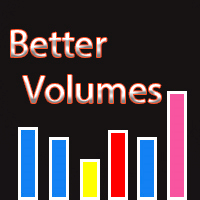
Description: The indicator of tick volumes Better Volumes allows you to assess the general mood of the market and quite accurately catch the moments of the formation of large movements. The indicator is a color histogram in an additional window. In the calculation of Better Volumes the Price Action combinations are taken into account, the values of the volumes with the height of columns and color marking are displayed. Input parameters: Display_Bars - the number of displayed bars (at 0, all are

Triton Arrow - уникальный авторский индикатор, имеющий возможность отображать 3 типа сигналов. Которые появляются в направлении текущей тенденции, и против нее, а также при определенном превышении волатильности. Triton Arrow подходит для любого таймфрейма, валютной пары. Сигналы индикатора не пропадают ни при каких условиях. Рекомендуются таймфреймы M5, М15.
Параметры индикатора
Основные настройки ( Main Settings ): CounterTrendPeriod - период для расчета сигналов против тенденции, и расче
TradingDesk Demo – Performance Analyse MT4 This is a Demo version of TradingDesk indicator which is limited to show only EURUSD. Full version can be found here: https://www.mql5.com/en/market/product/40189
TradingDesk analysed MetaTrader 4 historical data by Symbol, Magic Number, Trade or Comment. All these evaluations will be displayed in real time on your MetaTrader 4 chart window.
All this information will be displayed in the following dashboards: account info General information about
FREE

TradingDesk – Performance Analyse MT4
To test the indicator download free Demo version here: https://www.mql5.com/en/market/product/40471
TradingDesk analysed MetaTrader 4 historical data by Symbol, Magic Number, Trade or Comment. All these evaluations will be displayed in real time on your MetaTrader 4 chart window.
All this information will be displayed in the following dashboards: account info General information about the account is displayed in the account info dashboard. performance
Highly configurable Accumulation and Distribution (AD) indicator. Features: Alert functions. Multi timeframe ability (lower and higher TF also). Color customization. Linear interpolation and histogram mode options. Works on strategy tester in multi timeframe mode (at weekend without ticks also). Adjustable Levels. Parameters:
Ad Timeframe: You can set the lower/higher timeframes for Ad. Bar Shift for Lower Timeframe: Shift left or right the lower timeframe's candle. Stepless (Linear I
FREE

Forex Daily Percentage Calculator Forex Daily Percentage Calculator indicator is created for the Trader who cherishes the discipline of choosing only a percentage of their Trading account balance as profit per trade, per time or day. All you need to do is enter your desired percentage of your account balance, enable the notification popup alert to know when it has been attained so as to get out of the market till another day or trade. This helps the traders who are using it to determine a certai

目前有26%的折扣!!
这个指标是我们两个主要指标( Advanced Currency Strength 28 & Advanced Currency IMPULSE with ALERT )的一个超级组合。它显示了28个外汇对的TICK-UNITS货币强度值和警报信号。可以使用11种不同的Tick-Units。它们是1、2、3、4、5、6、10、12、15、20和30秒。子窗口中的Tick-Unit栏将被显示并向左移动,当在一秒钟的定时器中至少有一个Tick。
只用一个图表,你就可以剥28个外汇货币对的头皮!想象一下,你的剥头皮将如何提高。想象一下,你的剥头皮将如何改善,因为你能够准确地确定剥头皮机会的触发点?
这是市场上第一个在比1分钟更短的时间内工作的货币强度指标! 它是为那些希望快速进出并从市场中切出小点数的快速剥头皮者准备的。
用户手册:点击这里 https://www.mql5.com/en/blogs/post/727178
特点。
为28个货币对提供嘀嗒单位的卖出/买入警报,有一个按钮可以快速打开目标图表。 在3种敏感模式中选择
This LEGIT Indicator Can Accurately Predict the Outcome of One Bar.
Imagine adding more filters to further increase your probability!
Unlike other products, Binary Options PRO can analyze past signals giving you the statistical edge.
How Increase Your Probability
Information revealed here www.mql5.com/en/blogs/post/727038 NOTE: The selection of a Good Broker is important for the overall success in trading Binary Options.
Benefits You Get
Unique algorithm that anticipates price weaknes

Ace Supply Demand Zone Indicator The concept of supply demand relies on the quantity mismatching between buying and selling volumes in the financial market. Supply and demand zone can provide the good entry and exit. A zone is easier to trade than a line. The supply demand zone can provide the detailed trading plan and the risk management. Its ability to predict market direction is high. There are two distinctive points about Ace Supply Demand Zone Indicator. Ace Supply Demand Zone indicator was

为了隔离长期和非随机组件,不仅要知道价格变化了多少,还要知道这些变化是如何发生的。换句话说 - 我们不仅对价格水平的价值感兴趣,而且对这些水平相互替代的顺序感兴趣。通过这种方法,人们可以找到影响(或可能影响)特定时间点价格变化的长期和稳定因素。了解这些因素可以让您做出或多或少准确的预测。 让我们确定我们希望从财务系列的分析中得到什么具体结果: •首先,我们需要强调这一趋势,如果它存在于市场中; •其次,我们需要确定周期性成分; •第三,结果应足够稳定,可用于预测; •最后,我们的分析方法应该适应当前的市场形势。 为了满足指定的条件,我们使用相对价格变化的回归分析,并基于该模型做出指标。该指标的算法基于对历史数据的学习,其工作在交易者的完全控制之下。 LH 是一个参数,用于确定用于平滑金融系列的柱数。其允许值介于0到255之间。 UTS 是影响学习速度和深度的参数。它的值也在0到255之间。如果UTS的值为零,则在整个历史记录中进行学习。在所有其他情况下,训练集会不时更新。更新越频繁,UTS值越小。 该指标的主要缺点是,当平滑金融系列被认为是静止时,这可能会导致一些延迟。

TPA True Price Action indicator reveals the true price action of the market makers through 100% non-repainting signals (except early signals mode) strictly at the close of a candle!
TPA shows entries and re-entries, every time the bulls are definitely stronger than the bears and vice versa. Not to confuse with red/green candles. The shift of power gets confirmed at the earliest stage and is ONE exit strategy of several. There are available now two free parts of the TPA User Guide for our custo

The gravity line indicator to which the price always returns. This is a kind of center of attraction and a magnet for price. Allows you to trade on the trend and on pullbacks. It works on all timeframes, on any currency pairs, metals and cryptocurrency Can be used when working with binary options
Distinctive features Does not redraw its values; Price always returns to the line of gravity; Based on the laws of balance; It has simple and clear settings; It works on all timeframes and on all symb

Mars 6 is a Oscillators indicator is a powerful indicator of Break Zone for any par and any timeframe. It doesn't requires any additional indicators for the trading setup.The indicator gives clear signals about opening and closing trades.This Indicator is a unique, high quality and affordable trading tool.
Perfect For New Traders And Expert Traders Low risk entries. Never repaints signal. Never backpaints signal. Never recalculates signal. For MT4 Only Great For Scalping Great For Swing

The Moving Averages On-Off let you control the indicator using the keyboard or a button . You can choose if you want the indicator always shown or always hided while switching among different time frames or financial instruments . ---> This indicator is part of Combo Indicator OnOff
It's possible to use three Moving Averages , defined as Short , Medium , Long or Raimbow MA 5,10,20,50,100,200.
Input MOVING AVERAGES
You can customize the price type used for calculation : close,
FREE
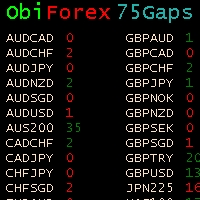
Gaps Size 75 - Market Gap Indicator The Gaps Size 75 indicator reveals the gaps between the current day and the previous day, aiding your trading decisions. It is designed for the "END OF WEEK GAPS" strategy, allowing you to identify potential opportunities. This indicator supports up to 75 currency pairs, with additional pairs available upon request. The columns are color-coded for easy interpretation. For inquiries regarding the weekend gaps strategy, kindly send a private message. Gaps Size 7
FREE

The indicator tracks the market trend with unsurpassed reliability, ignoring sharp market fluctuations and noises around the average price. This indicator allows you to track the trend and see its beginning, as well as the end, especially when the reversal begins! It catches the trend and shows the favorable moments of entry into the market with arrows. The indicator can be used for pipsing on small periods, and for long-term trading. The indicator implements a variety of technical analysis base

This trend indicator shows successful signals. It can be used with an optimal risk/reward ratio. The efficiency rate of the trend is 80%. The product shows the best opportunity to enter the market using the arrows. The indicator can be used for pipsing on small periods, as well as for the long-term trade. The indicator uses two parameters for the settings. The indicator does not redraw and lag. Take profit exceeds stop loss by 6-8 times on average! The product works on all currency pairs and all

Support and Resistance is a very important reference for trading. This indicator provides customized support and resistance levels, automatic draw line and play music functions. In addition to the custom RS, the default RS includes Pivot Point, Fibonacci, integer Price, MA, Bollinger Bands. Pivot Point is a resistance and support system. It has been widely used at froex,stocks, futures, treasury bonds and indexes. It is an effective support resistance analysis system. Fibonacci also known as t
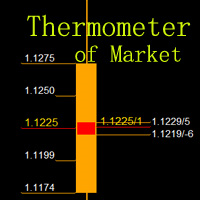
Measure the temperature of the market Like a thermometer .The function of this indicator is to measure the temperature of the market ,it is just like that using a thermometer to measuring water temperature, directly to show where the market is running and where it is likely to reach.
Pivot Point is a resistance and support system. It has been widely used at froex,stocks, futures, treasury bonds and indexes. It is an effective support resistance analysis system. Average True Range(ATR) is
MetaTrader市场是您可以下载免费模拟自动交易,用历史数据进行测试和优化的唯一商店。
阅读应用程序的概述和其他客户的评论,直接下载程序到您的程序端并且在购买之前测试一个自动交易。只有在MetaTrader市场可以完全免费测试应用程序。
您错过了交易机会:
- 免费交易应用程序
- 8,000+信号可供复制
- 探索金融市场的经济新闻
注册
登录