Regardez les tutoriels vidéo de Market sur YouTube
Comment acheter un robot de trading ou un indicateur
Exécutez votre EA sur
hébergement virtuel
hébergement virtuel
Test un indicateur/robot de trading avant d'acheter
Vous voulez gagner de l'argent sur Market ?
Comment présenter un produit pour qu'il se vende bien
Nouveaux indicateurs techniques pour MetaTrader 4
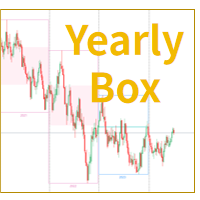
Indicateur de boîte de bougies annuelles MT4
L'indicateur "Boîte de Bougies Annuelles" sur la plateforme MetaTrader 4 est un outil d'analyse de graphiques qui affiche visuellement les mouvements de prix d'une année dans une boîte rectangulaire. Cet indicateur met en avant les prix d'ouverture et de clôture annuels en encadrant la fourchette des prix et en colorant l'arrière-plan. Les traders peuvent facilement identifier et analyser les fluctuations de prix annuelles en un coup d'œil en utili

Cet indicateur sépare efficacement le volume de tic-tac sur le marché des changes en catégories haussières et baissières.
En outre, il permet de calculer et d'afficher la somme des volumes haussiers et baissiers pour la période de votre choix.
Vous pouvez facilement ajuster la période en déplaçant les deux lignes bleues sur le graphique, ce qui permet de personnaliser et de préciser l'analyse des volumes en fonction de vos besoins de trading.
Si vous le trouvez utile, vos commentaires ser
FREE
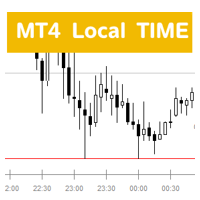
Description de l'Indicateur de Temps Local ( MT4 Local Time H4box )
Présentation L'indicateur de temps local est un indicateur personnalisé conçu pour la plateforme MetaTrader 4 (MT4), visant à fournir aux utilisateurs l'heure locale actuelle de leur région. Cet indicateur est adapté aux traders du monde entier, leur permettant de consulter rapidement l'heure locale lors de leurs transactions sur le marché des changes, afin de mieux saisir les dynamiques du marché et les opportunités de
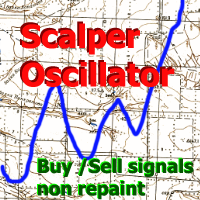
Un outil analytique conçu pour effectuer des transactions commerciales.
L'indicateur analyse la volatilité et les volumes du momentum pour identifier les signaux potentiels.
Contient un système de détection de tendances qui filtre le bruit du marché.
L'algorithme de l'indicateur génère des signaux lorsque les niveaux spécifiés sont franchis dans les cadres de tendance.
Possibilités
Fonctionne sur toutes les périodes et instruments de trading (Forex, crypto-monnaies, métaux, actions, indi

Heiken Ashi Histo Filter - is great & efficient auxiliary trading tool! Advanced new calculation method is used - 10 options for parameter "Price for calculation" Excellent to combine with Price Action patterns Green color histogram - Look for Bullish entries Magenta color histogram - Look for Bearish entries There are plenty of opportunities to upgrade even standard strategies with this indicator Indicator has built-in Mobile, PC and Email alerts
// More great Expert Advi

Forex Indicator INSIDE Bar Pattern for MT4 Indicator " INSIDE Bar " is very powerful indicator for Price Action trading Indicator detects INSIDE Bar patterns on chart: Bullish INSIDE Bar - Blue arrow signal on chart (see pictures) Bearish INSIDE Bar - Red arrow signal on chart (see pictures) No repaint; No delays; High R/R ratio (reward/risk) PC, Mobile & Email alerts are included Indicator " INSIDE Bar Pattern" is excellent to combine with Support/Resistance Levels: https:
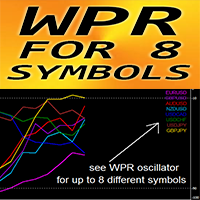
Forex Indicator "WPR for 8 Symbols" for MT4, No repaint WPR itself is one of the best oscillators for scalping It is great to take Sell entries from strong OverBought zone (above -10) and Buy entries from strong OverSold zone (below -90) "WPR for 8 Symbols" gives opportunity to control WPR values of up to 8 different symbols just on 1 chart
This indicator is excellent to combine with Price Action entries from OverSold/Bought areas as well . // More great Expert Advisors and

Our new indicator is an important part of the Smart Money Concepts (SMC) system
It uses a modern market vision and fast calculation methods. As a result, the trader has a complete picture of the trade at every moment in time, which makes the process of obtaining results easier and faster.
Our new indicator displays the following important patterns:
Order Blocks. Imbalance – Fair Value Gap (FVG). Break Of Structures (BoS). Change of character (CHoCH). Equal highs & lows. Premium , Equili
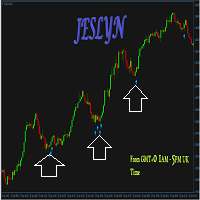
This indicator is the MT4 version based on the MT5 indicator of JES-USDJPY which is used and optimized for USDJPY currency pair. Other currency pairs have similarly optimized software for each currency pair, since they all behave differently even though some pairs share a bit of correlation.
Extensive tests, settings, and videos are available on the MT5 version thread: https://www.mql5.com/en/forum/470202 No MT4 version of JesVersal EA for now.
https://youtu.be/V2KhpUFq8MY Forex profit te

The Accumulation/Distribution (AD) Technical Indicator is a tool used in technical analysis to determine whether an asset is being accumulated (bought) or distributed (sold) in the market. Key Characteristics of the AD Indicator: Purpose: The AD indicator is used to assess the balance between buying (accumulation) and selling (distribution) of an asset. This helps traders and investors evaluate the strength of the current trend and potential reversals. Interpretation: Rising Indicator: When the

The principle of this indicator is very simple: detecting the candlestick pattern in H1 timeframe, then monitoring the return point of graph by using the pullback of High-Low of H1 Candlestick and finally predicting BUY and SELL signal with arrows, alerts and notifications. The parameters are fixed and automatically calculated on each time frame. Example:
If you install indicator on XAUUSD, timeframe H1: the indicator will detect the reversal, pullback, price action on this timeframe (for exa
FREE

Features:
Get OB/OS Levels from Golden MA Levels Wait for Buy/Sell Start Level Cross Optional: Should price cross Mid Level in earlier bars Optional: Crossing bar High/Medium Volume Optional: MA Stacked to check up/down trend for current TF Optional: NRTR higher timeframes aligned Check
Detailed blog post explained: https://www.mql5.com/en/blogs/post/758457
Levels with Buffers available here: Golden MA Levels Indicator: https://www.mql5.com/en/market/product/119515 Note: Arrows/Scanner do
FREE

Săgețile giganților
Bun venit.
Indicatorul Arrows of Giants funcționează foarte bine pe M15, M30, H1 și H4.
Poate fi experimentat și pe M5.
Succes!
Notă Dacă indicatorul nu este afișat, adăugați indicatorul TMA+CG mladen NRP în folderul Indicatori.
Îl puteți descărca de pe linkul https://forex-station.com/app.php/attach/file/3311524
Dar lăsați-l să fie la prima descărcare.
Apoi atașați indicatorul Săgețile giganților la diagramă.
IMPORTANT! Verificați mai întâi indicatorul s
Semnale precise
Bun venit!
Indicatorul de semnale precise declanșează semnale perfecte pe intervalele de timp M15 și M30. Pe H1 la fel, dar semnalele sunt mai rare.
De asemenea, funcționează foarte bine pe M5 și chiar pe M1.
Noroc!
Notă Dacă indicatorul nu este afișat, adăugați indicatorii TMA+CG mladen NRP și TDI Red Green (mtf + alerte + săgeți) în folderul Indicatori.
Le puteți descărca de pe linkurile https://forex-station.com/app.php/attach/file/3311524 și TDI Red Green (mtf +

Predator Indicator - M5
Bun venit.
Predator Indicator - M5 este creat pentru intervalul de timp M5, după cum sugerează și numele.
Este un indicator scalping.
Videoclipul arată că a funcționat foarte bine pe EURUSD M5 și nu revopsește.
Succes!
Notă Dacă indicatorul nu este afișat, adăugați indicatorul TMA+CG mladen NRP în folderul Indicatori.
Îl puteți descărca de pe linkul https://forex-station.com/app.php/attach/file/3311524
Dar lăsați-l să fie la prima descărcare.
Apoi atașa

Moving Pivot Average The pivot indicator compares the selected period with its counterpart from the previous period. The indicator uses very flexible algorithm for pivot value calculating. It allows you to allocate in days a certain time intervals (custom bars) and calculate the average pivot value based on High, Low and Close prices of these bars. How many custom bars will be taken into account is determined by the "Days" setting. The pivot line can be considered an average trend line and us
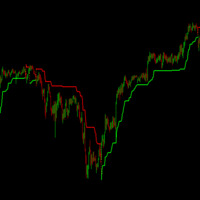
The classic SuperTrend indicator. The best indicator to define trends and small-scale trend changes in any pair and time frame. It is set up in exactly the same way as the TradinView indicator, and can be adjusted and complemented with other indicators to create profitable strategies or expert advisors, or used individually to profit from the market. Based on the average volatility of the last candles and the price movement, it draws a green line below the price if an bullish microtrend is ident
Probability emerges to record higher prices when CCi oscillator breaks out oscillator historical resistance level when exhibit overbought values. Since, oscillator breakout of support and resistance have similar effect as price breaks support and resistance levels, therefore, its highly advised to confirm price breakout with oscillator breakout; certainly, will have the same output in short trades. Concept is based on find swing levels which based on number of bars by each side of peak or trough
FREE

Determining the current trend is one of the most important tasks of a trader, regardless of the trading style. The Creative Trend indicator will help you do this with a fairly high probability. Creative Trend is a trend recognition indicator that uses the author's calculation algorithm. The indicator readings do not change under any conditions. The indicator is suitable for any currency pair, any timeframe, as long as there is enough historical data for calculations. Indicator Parameters
Main S
Semnal SOS
Indicatorul de semnal SOS funcționează foarte bine pe intervalele de timp H1, M30, M15. Poate fi încercat și pe intervalele M5, M1.
Studiu!
Succes!
Notă Dacă indicatorul nu este afișat, adăugați indicatorii TMA+CG mladen NRP și TDI Red Green (mtf + alerte + săgeți) în folderul Indicatori.
Le puteți descărca de pe linkurile https://forex-station.com/app.php/attach/file/3311524 și TDI Red Green (mtf + alerte + săgeți).mq4 (forex-station.com) .
Dar lăsați-le să fie la prima

M5 Omicron
Bună ziua!
Indicatorul M5 Omicron este creat special pentru M5. Este un indicator complex. Poate fi încercat și pe M1.
Noroc!
Notă Dacă indicatorul nu este afișat, adăugați indicatorii TMA+CG mladen NRP și TDI Red Green (mtf + alerte + săgeți) în folderul Indicatori.
Le puteți descărca de pe linkurile https://forex-station.com/app.php/attach/file/3311524 și TDI Red Green (mtf + alerte + săgeți).mq4 (forex-station.com) .
Dar lăsați-le să fie la prima descărcare.
Apoi ata

I made this RSI Indicator into multi time frame monitoring to monitor the occurrence of OverBuy and OverSell in real time on one monitor screen. My hope is that this indicator can help friends in the analysis process and also take trading moments with the system that friends have If this indicator is useful, friends can help me by giving likes to my channel and 5 stars on this indicator
Indicator RSI ini saya buat menjadi multi time frame monitoring untuk memantau terjadi nya OverBuy dan
FREE
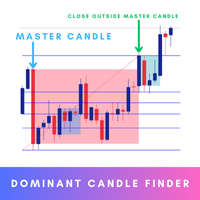
Dominant Candle Finder is a significant candlestick on a price chart that stands out due to its size, volume, or price movement compared to surrounding candles. It often indicates strong buying or selling pressure and can be used to identify potential reversal points, breakouts, or continuations in the market. Dominant candles can serve as key indicators for traders to make informed decisions, providing insights into market sentiment and potential future price movements. MT5 Version - https:
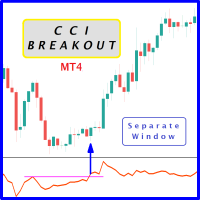
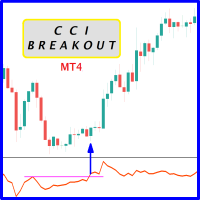
Probability emerges to record higher prices when Commodity Channel Index breaks out oscillator historical resistance level when exhibit overbought values. Since, oscillator breakout of support and resistance have similar effect as price breaks support and resistance levels, therefore, its highly advised to confirm price breakout with oscillator breakout; certainly, will have the same output in short trades. Concept is based on find swing levels which based on number of bars by each side of peak
FREE

When prices breakout resistance levels are combined with Larry Williams' Percentage Range "WPR" oscillator breaks out its historical resistance levels then probability emerges to record farther prices. It's strongly encouraged to confirm price breakout with oscillator breakout since they have comparable effects to price breaking support and resistance levels; surely, short trades will have the same perception. Concept is based on find swing levels which based on number of bars by each side
FREE
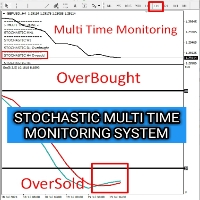
I made this Stochastic Indicator into multi time frame monitoring to monitor the occurrence of OverBuy and OverSell in real time on one monitor screen. My hope is that this indicator can help friends in the analysis process and also take trading moments with the system that friends have If this indicator is useful, friends can help me by giving likes to my channel and 5 stars on this indicator
Indicator Stochastic ini saya buat menjadi multi time frame monitoring untuk memantau terjadi nya
FREE
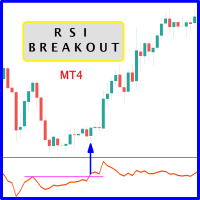
When prices breakout resistance levels are combined with Relative Strength Index "RSI" oscillator breaks out its historical resistance levels then probability emerges to record farther prices. It's strongly encouraged to confirm price breakout with oscillator breakout since they have comparable effects to price breaking support and resistance levels; surely, short trades will have the same perception. Concept is based on find swing levels which based on number of bars by each side to confi
FREE

Scalping M5
Indicatorul M5 Scalping este creat pentru intervalul de timp M5. Poate fi încercat și pe alte intervale de timp.
Este un indicator scalping.
Markerul nu revopsește și dă rezultate bune. Semnalele sunt rare, dar pot fi utilizate pe mai multe perechi.
Succes!
Notă Dacă indicatorul nu este afișat, adăugați indicatorul TMA+CG mladen NRP în folderul Indicatori.
Îl puteți descărca de pe linkul https://forex-station.com/app.php/attach/file/3311524
Dar lăsați-l să fie la prima
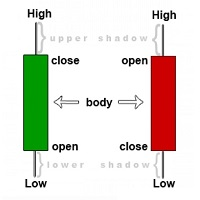
The indicator searches for candles on the price chart that are larger than those specified in the settings and marks them on the chart.
You can choose two types of candle size measurement (Units of Calculation): Points and Percentages. Points - size calculation will be in points. (for a five-digit quote point = 0.00001 and similarly for others)
Percentages - the candle size will be calculated as a percentage. You can also choose between which values to measure (Between Levels):
High/L

This indicator is based on the Cboe EuroCurrency Volatility Index, also known as Euro VIX and has a ticker symbol of EVZ . It basically measures volatility in the Eur/USD exchange rate but it can be used to track overall volitility in the Forex market. It's best usage is to add it to your system as a mandatory tool, when the value is above 7, you can expect some movement in the market, so you can trade at full risk, when the value is below 7, you trade with less risk or don't trade at all.

When prices breakout resistance levels are combined with Larry Williams' Percent Range oscillator "WPR" breaks out its historical resistance levels then higher chances emerges to record farther prices. It's strongly encouraged to confirm price breakout with oscillator breakout since they have comparable effects to price breaking support and resistance levels; certainly short trades will have the same perception. Concept is based on find swing levels which based on number of bars by each side to
FREE
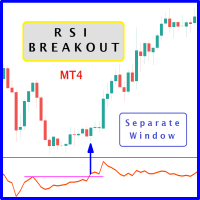
When prices breakout resistance levels are combined with Relative Strength Index oscillator "RSI" breaks out its historical resistance levels then higher chances emerges to record farther prices. It's strongly encouraged to confirm price breakout with oscillator breakout since they have comparable effects to price breaking support and resistance levels; certainly short trades will have the same perception. Concept is based on find swing levels which based on number of bars by each side to confir
FREE
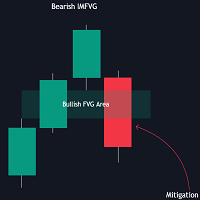
The FVG Instantaneous Mitigation Signals indicator detects and highlights "instantaneously" mitigated fair value gaps (FVG), that is FVGs that get mitigated one bar after their creation, returning signals upon mitigation.
Take profit/stop loss areas, as well as a trailing stop loss are also included to complement the signals.
USAGE Figure 1 Instantaneous Fair Value Gap mitigation is a new concept introduced in this script and refers to the event of price mitigating a fair value gap

The indicator defines the buy and sell arrows with high performance and consistent results. Suitable for trend trading or following the trend. Automatic analysis of market opportunities ; Help traders earn more from their investments;
Never repaints, recalculates or backpaints signals; This is FREE demo version of the indicator and works only on "EUR USD M5" . The demo version does not work on SUFFIX OR PREFIX brokers ! Forex Trend Commander All details about the indicator here :
FREE

Pipwise Indicators Multiple MAs Intro Please Note, this is a simpler version of the much more powerful version which you can find here: https://www.mql5.com/en/market/product/119947?source=Unknown The Pipwise Indicators Moving Averages indicator is a powerful tool for technical analysis in MetaTrader 4 (MT4). It allows traders to visualize and analyze moving averages from multiple periods on a single chart. Here are the key features:
Customizable Moving Averages: Traders can choose the numbe
FREE
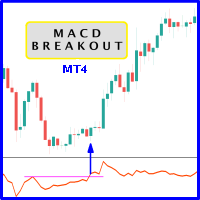
Probability emerges to record higher prices when MACD breaks out oscillator historical resistance level. It's strongly encouraged to confirm price breakout with oscillator breakout since they have comparable effects to price breaking support and resistance levels; surely, short trades will have the same perception. As advantage, many times oscillator breakout precedes price breakout as early alert to upcoming event as illustrated by 2nd & 3rd screenshot. Furthermore, divergence is confirmed
FREE
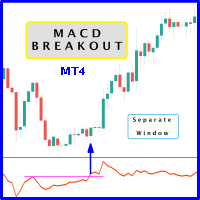
Probability emerges to record higher prices when MACD breaks out oscillator historical resistance level. It's strongly encouraged to confirm price breakout with oscillator breakout since they have comparable effects to price breaking support and resistance levels; surely, short trades will have the same perception. As advantage, many times oscillator breakout precedes price breakout as early alert to upcoming event as illustrated by 2nd & 3rd screenshot. Furthermore, divergence is confirmed
FREE
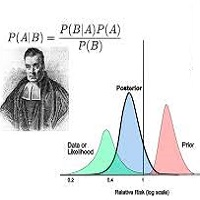
Bayesian methods can be effectively applied to predict price trends in financial markets, including Forex, stocks, and commodities. Here’s how Bayesian techniques can be used for trend prediction: 1. Bayesian Linear Regression Bayesian linear regression can be used to model the relationship between time and price. This method allows for the incorporation of prior beliefs about the trend and updates the trend as new data comes in. Example: Suppose you want to predict the price trend of a curren

Advance Currency Meter is a currency meter that detects strong market trends. This indicator is good for scalping, intraday trading and swing trading. The indicator will detect short term to long term market trends. This will give you good insight which currencies are best to trade as of the moment.
Note : Kindly contact me before you make any purchases. Works well with my MACD Currency Strength Meter
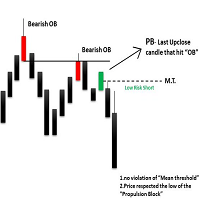
The ICT Propulsion Block indicator is meant to detect and highlight propulsion blocks, which are specific price structures introduced by the Inner Circle Trader (ICT).
Propulsion Blocks are essentially blocks located where prices interact with preceding order blocks. Traders often utilize them when analyzing price movements to identify potential turning points and market behavior or areas of interest in the market.
USAGE (fingure 1) An order block is a significant area on a pric
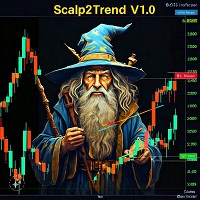
Introducing Scalp2Trend: The Ultimate MT4 Indicator for All Traders Scalp2Trend is a versatile tool that integrates multiple strategies to cater to the needs of all types of traders. Whether you're a scalper, day trader, or swing trader, Scalp2Trend is designed to help you maximize your trading potential. Key Features: Scalping: Ideal for scalpers who seek multiple trades daily without session limitations. Recommended timeframe: M5. Day Trading: Easily capture trends and close trades efficiently

It is an indicator which notifies via push notification when an order is closed by Take Profit/Stop Loss It indicates via pc alert and or mobile alert Psychologically you can hold order for long time If stop loss hunting happens you can re-enter with same direction If real break out happens you can reverse the position Overall it Alerts when position reach stop - loss or take-profit level
FREE
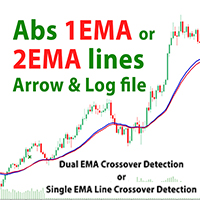
Product: 1 or 2 EMA Lines Crossover Indicator The 2 EMA Lines Crossover Indicator is a powerful and versatile tool designed for MetaTrader 4 (MT4) that helps traders identify potential buy and sell signals based on the crossover of two Exponential Moving Averages (EMAs). This indicator provides visual arrows on the chart to highlight trading opportunities, and it can also log these signals for further analysis. Whether you're a beginner or an experienced trader, this indicator can enhance your t

- Real price is 60$ - 50% Discount ( It is 30$ now )
Contact me for instruction, any questions! Introduction Triangle chart patterns are used in technical analysis , which is a trading strategy that involves charts and patterns that help traders identify trends in the market to make predictions about future performance.
Triangle Pattern Scanner Indicator It is usually difficult for a trader to recognize classic patterns on a chart, as well as searching for dozens of charts and tim

Contact me for instruction, any questions! Introduction Chart patterns are an essential tool traders and investors use to analyze the future price movements of securities. One such pattern is the triple bottom or the triple top pattern, which can provide valuable insights into potential price reversals. This pattern forms when a security reaches a low price level three times before reversing upward or reaches a high price level three times before reversing downward.
Triple Top Bottom

indicator is no repaint trend indicator. when red stars up to line that is probably end of long trades. when blue stars up to line that is probably end of down trades. indicator can use all pairs and lower than weekly charts, to use weekly chart need to at least 500 bars data on back.and lowering processing value 500. it is also suitable for 1m charts. indicator hold long way to go. there is not too many signals.
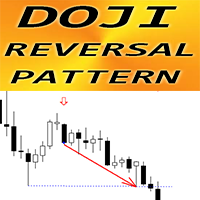
Forex Indicator " Doji Reversal pattern" for MT4 Indicator "Doji Reversal pattern" is pure Price Action trading: No repaint, No delays; Indicator detects Doji Reversal pattern on chart where Doji candle is in the middle of the pattern and the last candle is breakout one: Bullish Doji Reversal pattern - Blue arrow signal on chart (see pictures) Bearish Doji Reversal pattern - Red arrow signal on chart (see pictures) P C, Mobile & Email alerts are included Indicator " Doji Revers
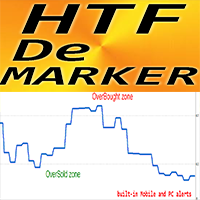
Forex Indicator HTF DeMarker for MT4 This indicator is a useful tool used by technical traders to find entry and exit points. H TF means - H igher Time Frame. DeMarker oscillator line indicates the current price position relative to previous highs and lows
DeMarker provides the most efficient regular divergence signals among other oscillators
OverBought zone is when the D eMarker is above 0.7 and OverSold one - when it is below 0.3
Indicator has built-in Mobile and PC alert

HURRY! The offer price of $89 is ACTIVE ONLY for next 4 PURCHASES, after which the price will increase to $129. William Delbert Gann, commonly known as W.D. Gann, was an exceptional market analyst renowned for his unique trading style in the early 20th century. His trading techniques were based on a blend of mathematics, geometry, astrology, and ancient mathematics. Gann believed that stock market movements followed specific patterns and cycles, rather than being random. His methodologies, cel

SMT (Smart Money Technique) Divergence refers to the price divergence between correlated assets or their relationship to inversely correlated assets. By analyzing SMT Divergence, traders can gain insights into the market's institutional structure and identify whether smart money is accumulating or distributing assets. Every price fluctuation should be confirmed by market symmetry, and any price asymmetry indicates an SMT Divergence, suggesting a potential trend reversal. MT5 Version - https:/

Vega indicator
The indicator is created for M1.
Rare and safe signals.
Success!
Notă Dacă indicatorul nu este afișat, adăugați indicatorul TMA+CG mladen NRP în folderul Indicatori.
Îl puteți descărca de pe linkul https://forex-station.com/app.php/attach/file/3311524
Dar lăsați-l să fie la prima descărcare.
Apoi atașați indicatorul Vega la diagramă.
IMPORTANT! Verificați mai întâi indicatorul sau expertul pe un cont DEMO, înainte de a-l cumpăra! Analizați-l bine!
Închiriați-l

Indicateur GoTrend Multi-Timeframe L'indicateur "GoTrend Multi-Timeframe" est un outil essentiel pour les traders à la recherche d'un moyen rapide et efficace d'évaluer les tendances générales et spécifiques d'une paire de devises sur différentes périodes. Cet indicateur permet aux traders d'obtenir une vue claire et complète de la direction du marché en un coup d'œil, optimisant ainsi la prise de décision et améliorant l'efficacité de leurs stratégies de trading. Caractéristiques Principales: A

-AUDUSD M15 - Every time there is any crossing of the RED lines , it means sell. - Every time there is any crossing of the GREEN lines , it indicates buy.
Discover the Future of Trading with Our Exclusive Indicator! In the dynamic world of financial markets, precision and the ability to anticipate movements are crucial for success. With this in mind, we have developed an exclusive indicator that combines cutting-edge technology with a sophisticated approach to offer you an indispensable to

Forex Indicator HTF Ichimoku for MT4 Ichimoku indicator is one of the most powerful trend indicators . H TF means - H igher Time Frame This indicator is excellent for Trend Traders as well as combination with Price Action entries. HTF Ichimoku Indicator allows you to attach Ichimoku from Higher time frame to your current chart. Up trend - red line above blue one (and both lines are above cloud) / Down trend - red line below blue one (and both lines are below cloud) Open BUY orders
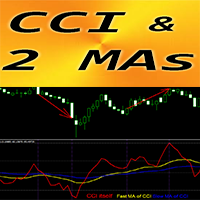
Forex Indicator "CCI and 2 Moving Averages" for MT4 Commodity Channel Index (CCI) is excellent for Momentum trading into the trend direction. " CCI and 2 Moving Averages" Indicator allows you to see Fast and Slow Moving Averages of CCI indicator Up trend - Fast MA is above Slow one; Down trend - Fast MA is below Slow one CCI is one of the most popular oscillators for trading - it measures the difference between the current price and the historical average price
Option#1 - Ope

Tired of navigating the sea of uncertainties in the financial market? Imagine having an experienced guide by your side, helping you decipher the mysteries of charts and leading you confidently toward financial success. With StakBank, you'll have more than just a simple indicator in your hands. You'll have a complete arsenal of tools to make assertive and profitable decisions. But what makes StakBank so special? Volume: Understand the driving force behind market movements, accurately identifying

The principle of this indicator is very simple: detecting the candlestick pattern in M30 timeframe, then monitoring the return point of graph by using the pullback of High-Low of M5 Candlestick and finally predicting BUY and SELL signal with arrows, alerts and notifications. The parameters are fixed and automatically calculated on each time frame. Example:
If you install indicator on XAUUSD, timeframe M5: the indicator will detect the reversal, pullback, price action on this timeframe (for ex
FREE

Indicateur Profil de Volume pour MT4 Obtenez un avantage en trading avec l'indicateur "Profil de Volume" pour MetaTrader 4 (MT4). Cet outil avancé d'analyse technique vous permet d'identifier avec précision les niveaux clés de support et de résistance basés sur le volume des transactions. Visualisez facilement les zones d'intérêt du marché, où les volumes d'échange sont les plus élevés, et utilisez ces informations pour prendre des décisions de trading plus éclairées. Caractéristiques principale
Présentation de l'"Indicateur de Plage de Couleur" L'"Indicateur de Plage de Couleur" est un outil puissant d'analyse technique conçu pour la plateforme MT4, parfait pour les traders qui souhaitent avoir une vue claire et immédiate des tendances du marché. Cet indicateur trace une ligne colorée en fonction de la tendance actuelle, facilitant l'interprétation des mouvements de prix. Description de l'indicateur : Ligne verte : Indique une tendance haussière. Utilisez ce signal pour envisager des o

The Accelerator Oscillator (AC) technical indicator measures the acceleration or deceleration of the current market strength. It is designed to identify potential trend reversal points and is used to determine the moment of buying or selling assets. The indicator helps traders make decisions based on changes in market dynamics. This implementation of the indicator is its creative version. Since the standard version is very limited by its built-in settings, this implementation has significantly
Semnal M1 fără pierderi A
Indicatorul este creat pentru M1.
Semnalele sunt relativ rare, dar de bună calitate.
Succes!
Notă Dacă indicatorul nu este afișat, adăugați indicatorul TMA+CG mladen NRP în folderul Indicatori.
Îl puteți descărca de pe linkul https://forex-station.com/app.php/attach/file/3311524
Dar lăsați-l să fie la prima descărcare.
Apoi atașați semnalul M1 fără pierderi la diagramă.
Mi-am creat indicatorul folosind indicatorul TMA+CG mladen NRP, creat de domnul Mlad
This indicator is a classic indicator of technical analysis - MACD. Unlike the classic MACD indicator, the presented indicator is calculated as follows: - the first smoothing signal is one of the standard methods used to create moving averages. - secondary smoothing method used in MAMA/FAMA indicators. - calculation of the difference between MAMA/FAMA values.
The indicator gives signals about a change in trend direction, as well as signals about weakening or strengthening of the trend. The ind
FREE
Darvas Flow is a revolutionary trading indicator that combines the classic Darvas Box method with modern market flow analysis. Developed for serious traders, Darvas Flow offers a powerful and intuitive tool for identifying trading opportunities. Key Features: Darvas Box Method Implementation : Darvas Flow automatically identifies Darvas boxes, allowing you to see crucial support and resistance levels. This helps in pinpointing optimal entry and exit points in your trades. Dynamic Flow Analysis :
FREE

Trend oscillator indicator for tracking microtrends and pullbacks. Determines even a minor change in trend . Allows you to open positions in a timely manner in accordance with market changes. Works on all timeframes, all currency pairs, metals, indices and cryptocurrencies. Can be used when working with binary options. Distinctive features Does not redraw after the candle closes; Accurately detects trend changes; Simple and clear setup; Works on all timeframes and all trading instruments; Suit

Similar to logic used in: Golden MA MTF TT Overview
"Golden MA" indicator for OB/OS levels. It's based on High/Lows of higher timeframe (HTF) previous bar. Only useful in swing trading or scalping. Best for at least M15+. For lower timeframes you'll need to change StartPips to lower value to get consistent lines. Because lower timeframes will have smaller pip distances. Features - Define Higher Timeframes for Current Timeframe: Use a comma-separated list to define the higher timeframe for t
FREE

The principle of this indicator is very simple: detecting the candlestick pattern in D1 timeframe, then monitoring the return point of graph by using the pullback of High-Low of D1 Candlestick and finally predicting BUY and SELL signal with arrows, alerts and notifications. The parameters are fixed and automatically calculated on each time frame. Example:
If you install indicator on XAUUSD, timeframe D1: the indicator will detect the reversal, pullback, price action on this timeframe (for exa
FREE
The x2 Smoothed RSI is an advanced modification of the classic Relative Strength Index (RSI) indicator. It aims to provide more reliable signals for identifying overbought and oversold market conditions. Here are the key features: Calculation : The x2 Smoothed RSI is derived from the standard RSI. It applies smoothing to the RSI oscillator, enhancing its accuracy. Smoothing Methods : The indicator uses a moving average of the RSI values. Traders can choose from various smoothing strengths C
FREE

Insight Pro is a comprehensive tool for market analysis. It offers various features such as trend analysis, resistance and support levels, and distribution analysis, suitable for both novice and experienced traders. Features Trend Analysis Detects and visualizes market trends. Suggests potential entry and exit points based on trends. Customizable trend lines for clear market direction. Displays extreme levels based on standard deviation. Positive slope indicates buy orders; negative slope indic

Pipwise Indicators Multiple MAs The Pipwise Indicators Moving Averages indicator is a powerful tool for technical analysis in MetaTrader 4 (MT4). It allows traders to visualize and analyze moving averages from multiple periods on a single chart. Here are the key features:
Customizable Moving Averages: Traders can choose the number of moving averages to plot (up to 9 MAs). Each Moving Average is customiseable.
Method Selection: The indicator supports various moving average methods, includin
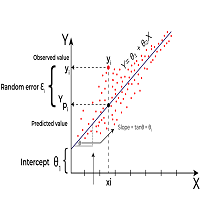
Linear Regression is a statistical method used to model the relationship between two or more variables. The primary goal of Linear Regression is to predict the value of one variable (called the dependent variable or outcome variable) based on the value of one or more other variables (called independent variables or explanatory variables) Linear Regression can be applied to technical analysis, and it is indeed one of the tools used by traders and analysts to make predictions and identify trends i
123456789101112131415161718192021222324252627282930313233343536373839404142434445464748495051525354555657585960616263646566676869707172737475767778798081828384858687888990919293949596979899100101102103104105106107108109110111112113114115116117118119120121122123124125126127128129130131132133134135136137138139140
Le MetaTrader Market est la seule boutique où vous pouvez télécharger un robot de trading de démonstration gratuit pour le tester et l'optimiser à l'aide de données historiques.
Lisez l’aperçu de l'application et les avis d'autres clients, téléchargez-la directement sur votre terminal et testez un robot de trading avant de l'acheter. Seul MetaTrader Market vous permet de tester gratuitement une application.
Vous manquez des opportunités de trading :
- Applications de trading gratuites
- Plus de 8 000 signaux à copier
- Actualités économiques pour explorer les marchés financiers
Inscription
Se connecter
Si vous n'avez pas de compte, veuillez vous inscrire
Autorisez l'utilisation de cookies pour vous connecter au site Web MQL5.com.
Veuillez activer les paramètres nécessaires dans votre navigateur, sinon vous ne pourrez pas vous connecter.