适用于MetaTrader 4的新技术指标 - 3

Percentage Profit/Loss Indicator for MetaTrader 4 The Percentage Profit/Loss Indicator for MetaTrader 4 (MT4) displays the percentage impact of open trades’ profit or loss in relation to the account balance. It provides a clear overview of how current open trades influence the overall account balance. Functionality Calculates the total profit or loss from all open orders. Computes the profit or loss percentage as follows: Profit Percentage = (Total Open Orders Profit or Loss / Account Balance)
FREE

向您介绍一款优秀的技术指标——Grabber,它是一套即开即用的“全包式”交易策略。
在一个代码中集成了强大的市场技术分析工具、交易信号(箭头)、提醒功能和推送通知。 每位购买该指标的用户还可免费获得以下内容: Grabber辅助工具:用于自动管理已开仓位 视频操作指南:逐步教学如何安装、设置和使用该指标进行交易 原创Set文件:可快速自动配置,帮助实现最佳交易效果 忘掉其他策略吧!只有Grabber能够真正激励你在交易中攀登新高峰! Grabber策略的主要特点: 交易周期:从M5到H4 适用资产:任意,但我推荐我亲自测试过的品种(GBPUSD、GBPCAD、GBPCHF、AUDCAD、AUDUSD、AUDSGD、AUDCHF、NZDUSD、NZDCAD、EURCAD、EURUSD、EURAUD、EURGBP、EURCHF、USDCAD、USDSGD) 交易时间:全天候 24/7 交易效果:我分享自己的真实交易结果,并在此教学如何操作: https://www.mql5.com/ru/market/product/134563?source=Site+Market+MT5+Indic

Linear Trend Predictor — 结合切入点和方向支撑线的趋势指标。按照突破高/低价通道的原理运作。该指标算法过滤市场噪音,考虑波动性和市场动态。
指示器功能
使用平滑方法,显示市场趋势和开立买入或卖出订单的切入点。 适合通过分析任何时间范围内的图表来确定短期和长期的市场走势。 输入参数可适应任何市场和时间范围,允许交易者独立定制指标。 设定的指示信号不会消失,也不会重新绘制——它是在蜡烛收盘时确定的。 几种类型的通知以箭头组合。 该指标既可以作为独立的交易系统使用,也可以作为其他交易系统的补充。 可供任何经验水平的交易者使用。
主要参数
Volatility Smoothing Level - 指标的主要参数,允许您配置指标以实现舒适的操作。
它的数字范围是 1 到 100,从而增加了您可以获得更长趋势运动的平滑度。
通过少量的数字,您可以获得短期走势并快速退出交易。
使用指标进行交易的时刻:
红线和箭头表示下降趋势和卖出开盘信号。止损应根据前一个上分形来设置。 黄线和箭头表示上升趋势和买入开盘信号。止损应根据前一个下分形来设置。
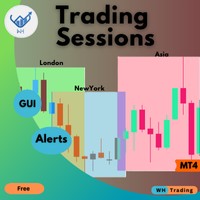
Mejore la precisión de sus operaciones con el Sesiones de trading de WH MT4 Indicador para MetaTrader 4. Esta potente herramienta te ayuda a visualizar y gestionar sesiones clave del mercado sin esfuerzo. Basado en: Indicador WH SMC MT4
Versión MT5: WH Trading Sessions MT5 Características principales: Panel GUI interactivo – Seleccione y alterne fácilmente entre Asia, Londres y Nueva York sesiones de negociación.
Alertas y configuraciones personalizables
FREE
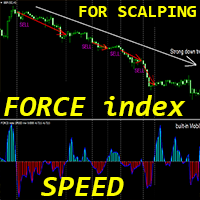
Crypto_Forex 指标“ Force index Speed ”适用于 MT4,无需重绘。
- 该指标的计算基于物理方程。Force index Speed 是 Force index 本身的一阶导数。 - Force index 是将价格和交易量数据合并为一个值的顶级指标之一。 - Force index Speed 适合在主要趋势方向上进行剥头皮交易:将其与任何合适的趋势指标结合使用。 - Force index Speed 指标显示 Force index 本身改变方向的速度 - 它非常敏感。 - 如果 Force index Speed 指标的值 < 0:速度为负;如果 Force index 指标的值 > 0:速度为正。 - 指标具有内置的移动和 PC 警报。
// 出色的交易机器人和指标可在此处获得: https://www.mql5.com/en/users/def1380/seller 这是仅在此 MQL5 网站上提供的原创产品。

Crypto_Forex 指标 Bears Power HTF 适用于 MT4。
- Bears Power HTF 振荡器是“卖出”条目的绝佳过滤器。HTF 表示 - 更高时间框架。 - 牛市和熊市力量指标用于交易,以衡量交易中相应趋势的强度。 - Bears Power 衡量卖方头寸的强度。 - Bears Power HTF 指标非常适合具有价格行动条目或与其他指标结合使用的多时间框架交易系统。 - 此指标允许您将更高时间范围内的 Bears Power 附加到当前图表。 - 指标具有内置的 0 级交叉移动和 PC 警报。
// 出色的交易机器人和指标可在此处获得: https://www.mql5.com/en/users/def1380/seller 这是仅在此 MQL5 网站上提供的原创产品。
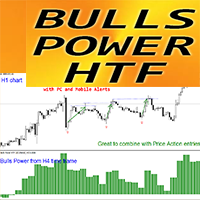
Crypto_Forex 指标 Bulls Power HTF 适用于 MT4。
- Bulls Power HTF 振荡器是“买入”条目的完美过滤器。HTF 表示 - 更高时间框架。 - 交易中使用 Bulls 和 Bears Power 指标来衡量交易中相应趋势的强度。 - Bulls Power 衡量买家头寸的强度。 - Bulls Power HTF 指标非常适合具有价格行动条目或与其他指标结合使用的多时间框架交易系统。 - 此指标允许您将更高时间框架的 Bulls Power 附加到当前图表。 - 指标具有内置的 0 级交叉移动和 PC 警报。
// 出色的交易机器人和指标可在此处获得: https://www.mql5.com/en/users/def1380/seller 这是仅在此 MQL5 网站上提供的原创产品。
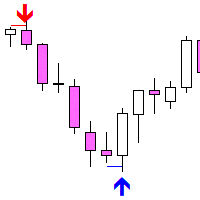
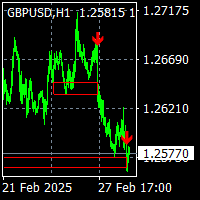
Fakey Detector — 假突破(Fakey)形态指标 Fakey Detector 是一个可以自动识别经典 Fakey(内部K线的假突破)形态的指标,并在图表上用箭头和突破水平线进行显示。 工作原理: Fakey 模式由三根K线组成: 母K线(Mother Bar) — 区间最大的K线 内部K线(Inside Bar) — 完全包含在母K线的范围内 Fakey K线 — 向上或向下突破,但又收盘回到范围之内 当满足设定条件时(包括可选的实体方向过滤器),指标会显示: 向下箭头 — 表示 Fakey Sell 信号 向上箭头 — 表示 Fakey Buy 信号 突破线 — 显示关键突破水平 ️ 参数设置: LookBackBars — 分析的K线数量 MinBreakoutPips — 最小假突破深度(点) UseBodyDirectionFilter — 启用对 Fakey 和 Inside K线实体方向的过滤 UseMotherBarBreakout — true 表示从母K线判断突破, false 表示从内部K线判断 特点: 不重绘 适用
FREE

Trend Risk Analyzer intelligently identifies trends, impulses, and corrections, calculating optimal trade volumes and safe levels for stop-loss and take-profit. Increase your accuracy, reduce risks, and boost your trading profits! This product is also available for MetaTrader 5 => https://www.mql5.com/en/market/product/134799 The key feature of Trend Risk Analyzer is its capability to calculate the average range of each market element, enabling traders to set justified stop-loss and take-profi
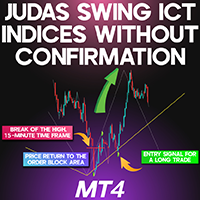
Judas Swing ICT Indices Without Confirmation MT4 The Judas Indices Indicator (Judas Indices ICT) for MetaTrader 4 is specifically designed to recognize deceptive price moves and liquidity manipulation occurring during the initial phase of the New York trading session. This tool identifies price traps set by institutional market participants between 09:30 and 09:45 EST , helping traders avoid false signals and poor trade executions. «Indicator Installation & User Guide»
MT4 Indicator Installatio
FREE
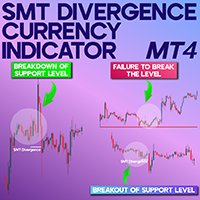
SMT Divergence EU-GU-DXY Indicator MT4 The SMT Divergence EU-GU-DXY Indicator for MetaTrader 4 is a powerful analytical tool designed to detect price divergence among three major Forex pairs. It identifies discrepancies between EUR/USD, GBP/USD, and the U.S. Dollar Index (DXY), highlighting potential trading opportunities through color-coded signals. «Indicator Installation & User Guide»
MT4 Indicator Installation | SMT Divergence Currency Indicator MT5 | ALL Products By TradingFinderLab
FREE
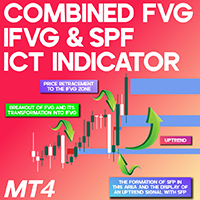
Combined FVG IFVG and SFP ICT Indicator MT4 The FVG-IFVG + SFP Indicator integrates three essential ICT trading elements: Fair Value Gap (FVG), Inverse Fair Value Gap (IFVG), and Swing Failure Pattern (SFP) . This tool is highly effective in identifying liquidity zones that are often manipulated by market makers. By detecting SFP formations within FVG and IFVG areas , the indicator helps traders recognize liquidity absorption points that may lead to potential price reversals. This feature enable
FREE

CISD and Price Gap Openings Indicator MT4 The CISD CSD + Price Gap Openings Indicator is designed to highlight price gaps while marking the CISD level, providing insights into potential market reversals. This MetaTrader 4 tool, based on ICT principles, utilizes arrow markers to assist traders in recognizing fresh price gaps and possible retracement zones. CISD – CSD + Price Gap Openings Indicator Specifications The following table outlines the features of the CISD – CSD + Price Gap Openings In
FREE

CISD High and Low ICT Indicator for MetaTrader 4 The CISD – CSD + High and Low Indicator is a liquidity-based tool for MetaTrader 4, designed following ICT trading principles to identify potential market reversals. This indicator utilizes the CISD (Critical Institutional Supply and Demand) methodology, marking trade entry points by tracking key high and low-price levels across various timeframes, such as daily, weekly, and monthly charts. CISD + High & Low Indicator Features Below is a breakdo
FREE
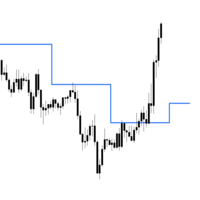
WapPrag is a powerful custom VWAP (Volume Weighted Average Price) indicator, adapted to a user-selected period, from 5 minutes to a year. It displays the (last) weighted average price for the previous period, based on candle price and volumes.
The indicator calculates the weighted average price (based on High, Low and Close) during the selected timeframe, and saves the last value as a constant level to display in the current chart. This allows traders to target the key level of the fair price

Contact me through this email address to download the FREE strategy PDF for this indicator tharindu999lakmal@gmail.com
Download MT5 version here -- >> https://www.mql5.com/en/market/product/119467
Introduction The "VIP Buy Sell Signals MT" is designed to provide BUY and SELL trade signals based on the current market conditions. A Trading Strategy (Chee sheet) has been provided for this trading indicator. (Read the description). This indicator has time tuned e ntry signals . so
The indicator gives signals to open/close a position and marks them on the price chart of the financial instrument. The signals differ in their potential, which allows you to decide on the amount of risk in each transaction. The principle of operation is to compare the current RSI value with the RSI value whose period is multiplied by the Cross_Factor value. The signal is confirmed when the price overcomes the maximum/minimum of the bar on which the indicator gave the signal. The open position i
The presented indicator is an original development based on the idea embedded in the classic technical analysis indicator - Fractals. The Fractals indicator allows you to determine a significant trough or peak for analysis on the price chart of the financial instrument in question. The fractal itself on the price chart consists of candles, the middle of which is either the highest (up fractal) or the lowest (down fractal) of all the candles taken for analysis. The original indicator uses five ca
FREE

Judas Swing with Confirmation Indices ICT MT4 The Judas Indicator with Confirmation is specifically designed to detect deceptive price movements on the chart. This tool helps traders recognize the true market trend by filtering out fake breakouts, reducing the risk of falling for false signals. By confirming the primary trend within a 1-minute timeframe , it minimizes the chances of traders making incorrect decisions. «Indicator Installation & User Guide»
MT4 Indicator Installation | Judas Sw
FREE
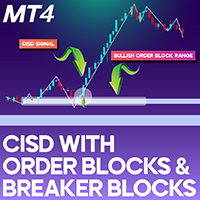
CISD with Order Blocks and Breaker Blocks ICT MT4 The CISD Indicator with Order Blocks and Breaker Blocks (CISD-CSD + OB & BB) is an ICT-based tool for MetaTrader 4 , designed to analyze changes in market delivery dynamics, order blocks, and breaker blocks. It automatically detects breakout signals at CISD levels , providing traders with clear entry points. This indicator assists in identifying both bullish and bearish order blocks , which play a significant role in market structure and trend an
FREE
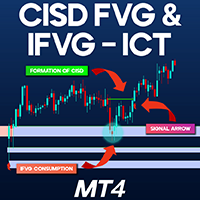
CISD FVG and IFVG ICT Indicator MT4 The CISD – CSD + FVG – IFVG indicator is an advanced ICT-based tool designed to identify CISD levels using Fair Value Gap (FVG) and Inverse Fair Value Gap (IFVG) .
Built for MetaTrader 4 , this liquidity indicator dynamically maps CISD zones with directional arrow signals. These Change in Delivery Price (CISD) levels help traders understand market shifts and trend developments in real time. CISD – CSD + FVG – IFVG Indicator Specifications Below is a summary
FREE

Microsoft Word - Installation - TrendFollower-1 Trend Follower 1 This indicator consists of three key components: an upper band, a lower band, and a middle line. A buy signal is generated when the price closes above the upper band, indicating strong bullish momentum and a potential trend continuation. Conversely, a sell signal occurs when the price closes below the lower band, signaling bearish strength and a possible downward move. The middle line serves as a dynamic support or resistance leve

Microsoft Word - Installation - TrendFollower-2 Trend Follower 2 This trend-following indicator with upper and lower bands is a powerful tool for identifying market momentum and generating trade signals. This indicator consists of three lines: the upper band, lower band, and middle line. A buy signal is triggered when the price closes above the upper band, indicating strong bullish momentum and a potential continuation of the uptrend. Conversely, a sell signal is generated when the price closes
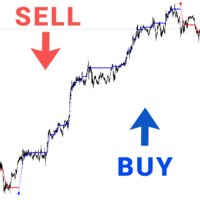
Golding Trend: 100% does not repaint its signals.
Designed specifically for Gold GOLD/XAUUSD Special offer - https://www.mql5.com/en/users/bossik2810/news
Golding Trend is designed to identify the most relevant trends in the financial market. If you are looking for a tool that accurately predicts movements, Golding Trend is your ally. Trading with this indicator is very easy. We wait for a signal from the indicator and enter the transaction according to the arrow (Blue arrow - Buy, Red - Sel
Daily Volatility Tracker is a practical and lightweight indicator designed to help traders monitor and analyze market volatility based on historical daily price movements. Whether you're a day trader, swing trader, or scalper, understanding how much a market moves per day is critical for: Choosing the right pairs to trade Setting accurate stop-loss and take-profit levels Adapting to changing market conditions MT5 Version - https://www.mql5.com/en/market/product/134960/ Join To Learn Market Dept
FREE

Dynamic Trading Dashboard for MT4 This powerful MT4 trading dashboard offers traders a comprehensive view of current and historical trading performance in an intuitive and visually organized format. With its precision-engineered design, the dashboard provides a seamless blend of real-time insights and historical analysis. This trading dashboard is perfect for meticulous traders who seek a precise, all-encompassing tool to manage open and closed positions while gaining insights into past perform
FREE

This is a true trend lines indicator for MT4/MT5.
This indicator draw real trend lines.
Usually the trend line is drawn as a solid line.
The next trend line that is likely to be valid is drawn as a dotted line.
The most recent invalidated trend line is drawn as a dashed line.
Three-touch lines is drawn as a bright colors.
If the starting point of the trend line is new, the blue line is displayed(call shortline),
if it is old, the gold line is displayed(call longline).
The number of bars border

https://youtu.be/evAJW38orgM?si=1-ec32TO29bnQV4q
️ Note to Clients: "Entry Maker" is not just an indicator — it's a complete, time-tested trading strategy.
You’re not buying signals. You’re getting a full system: precise entry logic, proven timing, stop loss & take profit management, and strategic filters — all designed to work together for consistent results.
If you buy this indicator and it doesn't help you make money — you’re covered. That’s my guarantee. Because I don’t just se

这段代码是一个用于 MetaTrader 4 (MT4) 平台的MQL4指标脚本,主要功能是在图表上实时显示以下信息: 当前K线的剩余时间 (格式为 X分Y秒 )。 本地时间 (格式为 HH:MM:SS )。 代码的主要组成部分包括: 初始化函数 OnInit : 创建文本对象用于显示时间和剩余时间。 计算并打印本地时间与服务器时间的差异。 初始化定时器,每1秒触发一次 OnTimer 。 反初始化函数 OnDeinit : 删除文本对象。 销毁定时器。 计算函数 OnCalculate : 计算当前K线的剩余时间。 获取本地时间并格式化。 更新文本对象的内容和位置,确保显示信息实时更新。 定时器函数 OnTimer : 每1秒调用一次 OnCalculate ,强制更新时间显示。 辅助函数 FormatRemainingTime : 将剩余时间(秒)格式化为 X分Y秒 的字符串。

Uncomplicated straightforward indicator that shows the maximum account drawdown since the indicator was added to the chart. The indicator does not take transaction history into account since it is impossible to calculate drawdown from historical entries en closures of trades. The indicator will be free in this basic form. Eventually it will be developed but the focus is to keep it plain and simple.
FREE

Parabolic SAR + Deviation [BigBeluga] is an enhanced Parabolic SAR indicator designed to detect trends while incorporating deviation levels and trend change markers for added depth in analyzing price movements. Key Features: > Parabolic SAR with Optimized Settings: Built on the classic Parabolic SAR, this version uses predefined default settings to enhance its ability to detect and confirm trends. Clear trend direction is indicated by smooth trend lines, allowing traders to easily visuali

Tired of being on the wrong side of the trend? MT4 ROADS puts the power of the Moving Average Channel in your hands. Dynamically plots buy and sell zones using a custom moving average Clearly identifies the current market trend for more confident trading Fully customizable settings to optimize performance for your strategy Visual signal potential trend changes before they happen The MT4 ROADS indicator is your personal market navigator, guiding you through the unpredictable ebb and flow of volat
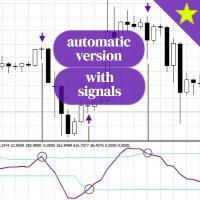
This is an advanced version of my free RSI Cyclic indicator. The free version is already a very powerful tool but it requires a manual change of the dominant cycle each time it is used and it is not obvious or easy to do and it does not offer signals. This version uses a Fast Fourier Transform (FFT) to automatically detect the current dominant cycle and uses it as new input for the indicator each tick which dynamically updates the chart. It can be used without the signals simply looking at the c

The LOWESS is a sophisticated trend-following indicator designed to help traders identify, analyze, and act on market trends with precision and minimal lag. Built around the LOWESS (Locally Weighted Scatterplot Smoothing) algorithm, it filters out market noise to reveal the underlying price direction. Enhanced with dynamic visuals, volatility-based bands, momentum insights, and features like alerts and trend strength analysis, this indicator offers a comprehensive toolkit for navigating today’s

The TMA Centered Bands indicator for MT4 draws bands on the chart and reports the overall price trend, as well as gives arrows signals to buy and sell when the bar closes outside the channel.
Unlike many TMAs, our version uses the calculation part of the algorithm without redrawing, and also adds the ability to select a symbol. The bands are made up of moving averages, and each of them has an MA period. The name TMA comes from triangular moving averages, as the indicator draws triangular bands
FREE

"Smart Panel" is a powerful tool for traders and analysts that combines convenience, speed, and functionality. The program allows you to instantly add popular indicators such as Moving Average and Bollinger Bands to your chart, as well as provides access to open order data and market information with just one click. Key Features: Instant Indicator Addition :
Click a single button to add Moving Average or Bollinger Bands to your chart. No more manual parameter setup—the program does it

跟随趋势是一种视觉指标,它将根据 RSI 算法为蜡烛着色,并为您提供推荐的 FVG 切入点和推荐的止损点。 不重绘!
确认箭头将出现在第一个新形成的公允价值缺口上!
最佳使用:
5 分钟或更长的时间范围!
趋势面板:
FVG:最后一个公允价值缺口。 跨度:在 Ichimoku 云的上方、下方或内部。 Rsi:RSI 算法部分 您可以轻松抓取和移动图表上的面板!通过查看面板,您可以轻松指出该对的趋势! 策略:
1. 可能的多头交易:
当出现新的绿色箭头时。将您的止损位置于公允价值缺口下方! 在 tp 或形成新的看跌公允价值缺口时退出交易。 2. 可能的空头交易:
当出现新的红色箭头时。将您的止损位置于公允价值缺口上方! 获利回吐或形成新的看涨公允价值缺口时退出交易。 警报:
创建新的公允价值缺口 所有公允价值缺口 打破的公允价值缺口 根据您的偏好!
https://www.mql5.com/en/users/gabedk/seller

蜡烛成交量强度是一种先进的成交量分析指标,可洞察买卖双方之间的持续竞争。它计算并可视化实时成交量变化,帮助交易者更准确地确认突破、趋势、回撤和反转。
主要特点: 基于成交量的确认—— 该指标监控成交量变化,并在市场力量在买家和卖家之间转移时发出警报。 趋势和突破验证—— 通过分析交易量分布,交易者可以确认市场趋势和突破信号的强度。 反转和回撤检测—— 成交量模式有助于识别价格走势中的潜在转折点。 支撑和阻力洞察—— 关键水平附近的成交量增加增强了对其可靠性的信心。 简单有效的可视化—— 以直方图形式显示买卖强度,以便于解释。 蜡烛图成交量强度可帮助交易者利用成交量分析确认市场走势,从而做出明智的决策。在突破期间,高交易量表明市场参与度高,从而增强了突破信号的有效性并降低了错误动作的可能性。理解趋势强度变得更容易,因为上升趋势中成交量的增加证实了持续的购买压力,而下降趋势中成交量的增加表明强劲的卖出活动,为交易者提供了对趋势延续的更大信心。此外,该指标通过识别价格变动和成交量活动之间的差异来帮助发现潜在的趋势逆转。例如,如果价格继续上涨而成交量下降,则可能表明趋势减弱并可能出现逆转。
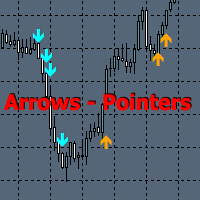
Arrows Pointers - 箭头指标,指示市场活动的方向。显示进行交易的连续入口点。
在趋势模式下工作,和非趋势模式下工作,显示价格方向的早期变化。
该指标基于价格通道算法,当蜡烛的收盘价突破该算法时,就会形成箭头。
100% 指标不会重绘。
指示器不会重新绘制,箭头出现在蜡烛的收盘处。 箭头一旦出现就不会消失,方便根据历史数据制定交易策略。 当信号发生时提供多种类型的警报。 可用于任何时间范围和金融工具(外汇、商品、股票、指数、加密货币、差价合约等) SL 应设置在最后一个箭头的水平,TP 应设置为前一个蜡烛的主体长度。 如果您有自己的趋势指标,则可以使用该指标而不使用内部趋势。
主要输入参数
Arrow generation sensitivity - 该参数决定价格通道突破的敏感度;随着数字的增加,敏感度增加,箭头的数量增加。
Use Trend - 使用趋势来引导箭头。
Trend Period - 趋势周期(如果使用)
时间框架的参数的近似选择,在独立选择参数时可能会有所不同。 M1: Arrow generation sensitivity - 5-

Title: 3 Trading Strategies to Exploit Market Structure (Without Overcomplicating It) Trading isn’t about predicting the future—it’s about spotting patterns, managing risk, and acting when odds favor you. Below are two timeless strategies (and one hybrid) that align with how markets actually move, not how we wish they would. Please ping me up for the strategy i have been using for last 8 years and the strategy that led me to leave my IT job. i am 100% sure that my strategy will blow your mi

SMC Venom 模型 BPR 指標是針對在智慧貨幣 (SMC) 概念內工作的交易者的專業工具。它會自動辨識價格圖表上的兩種關鍵模式: FVG (公平價值缺口)是三根蠟燭的組合,其中第一根和第三根蠟燭之間存在缺口。它在水平之間形成一個沒有成交量支撐的區域,這通常會導致價格調整。 BPR (平衡價格區間)是兩種 FVG 模式的組合,形成一個「橋樑」 - 當價格以低成交量活動移動時,突破並返回到水平的區域,從而在蠟燭之間產生間隙。 這些模式可協助交易者透過分析圖表上的交易量和價格動態(大型市場參與者和普通參與者之間的互動)來識別關鍵的支撐/阻力位、突破區域和切入點。 此指標以矩形和箭頭的形式可視化模式,也支援靈活的警報設定。 主要特點:
模式顯示模式:選擇顯示 BPR 模式(看漲和看跌)或 FVG 模式(看漲和看跌)。 可以隱藏所有圖表分析模式。 以條數過濾:BPR 結構中 FVG 之間的最小/最大距離。
訊號的附加視覺化:
箭頭有 9 種類型可供選擇(標準、細、分形等)或手動輸入 Wingdings 代碼,其表格可以選擇性地顯示在圖表上。 使用 ATR 配置顏色、尺寸及其相對於價格
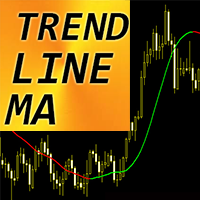
Crypto_Forex 指标“趋势线移动平均线”适用于 MT4。 趋势线 MA - 是下一代移动平均线!
- 使用先进的新计算方法。指标显示趋势无延迟。 - 它比标准 SMA、EMA 和 LWMA 指标更快、更清晰。 - 使用此指标有很多机会升级标准策略。 - 绿色表示看涨趋势。红色 - 看跌趋势。 ................................................................................................................. // 出色的交易机器人和指标可在此处获得: https://www.mql5.com/en/users/def1380/seller 这是仅在此 MQL5 网站上提供的原创产品。
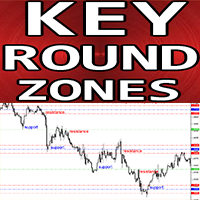
MT4 外汇指标“关键圆形区域”。
- 指标“关键圆形区域”是交易者考虑支撑/阻力时必备的辅助指标。 - 价格尊重 1000 和 500 圆形水平 - 价格经常从它们反弹。 - 主要 1000 水平周围也有强大的支撑/阻力区域(每边 100 点)。 - 1000 和 500 圆形水平也适合放置获利(圆形水平前面)和 SL(圆形水平后面)。 - 这些水平在价格横盘整理和市场持平时尤其强劲。 ................................................................................................................. // 出色的交易机器人和指标可在此处获得: https://www.mql5.com/en/users/def1380/seller 这是仅在此 MQL5 网站上提供的原创产品。
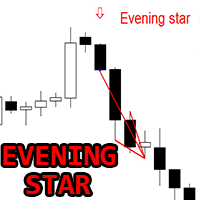
Crypto_Forex 指标“黄昏之星模式”适用于 MT4。
- 指标“黄昏之星模式”是价格行为交易的非常强大的指标:无需重绘,无延迟。 - 指标检测图表上的看跌黄昏之星模式:图表上的红色箭头信号(见图片)。 - 带有 PC、手机和电子邮件警报。 - 它的兄弟 - 看涨“晨星模式”指标也可用(请点击以下链接)。 - 指标“黄昏之星模式”非常适合与支撑/阻力位结合使用。 ................................................................................................................. // 出色的交易机器人和指标可在此处获得: https://www.mql5.com/en/users/def1380/seller 这是仅在此 MQL5 网站上提供的原创产品。

Crypto_Forex 指标“晨星模式”适用于 MT4。
- 指标“晨星模式”是价格行为交易的非常强大的指标:无需重绘,无延迟。 - 指标检测图表上的看涨晨星模式:图表上的蓝色箭头信号(见图片)。 - 带有 PC、手机和电子邮件警报。 - 还有它的兄弟 - 看跌“黄昏之星模式”指标可用(点击以下链接)。 - 指标“晨星模式”非常适合与支撑/阻力位结合使用。 ................................................................................................................. // 出色的交易机器人和指标可在此处获得: https://www.mql5.com/en/users/def1380/seller 这是仅在此 MQL5 网站上提供的原创产品。

Bomb Signal : 100% does not repaint
Special offer - https://www.mql5.com/en/users/bossik2810/news Bomb Signal is a powerful indicator for MetaTrader 4 designed to identify the most relevant trends in the financial market. If you are looking for a tool that accurately predicts movements, Bomb Signal is your ally. How does this work: This indicator combines three different methods – volume analysis, candlestick closing and symmetrical trend – to detect and signal buying and selling opportunities

Gold AMS - is a good technical stock indicator. The indicator algorithm analyzes the asset price movement and reflects volatility and potential entry zones. Special offer - https://www.mql5.com/en/users/bossik2810/news The indicator 100% does not repaint!!!
The best indicator signals: If a signal appears, it does not disappear! Unlike indicators with redrawing, which lead to loss of deposit, because they can show a signal and then remove it. Trading with this indicator is very easy. We wait

Our AI-Powered "Verve Ai Auto Fib" Indicator dynamically identifies market trends and price channels , then automatically plots Fibonacci levels based on real-time price action. This means no manual adjustments – just precise Fibonacci retracements and extensions tailored to market conditions! Key Features & Benefits: Automatic Channel Detection – AI-driven algorithm identifies key market structures.
Real-Time Fibonacci Levels – No need to manually draw or adjust Fib lines.
Works in All
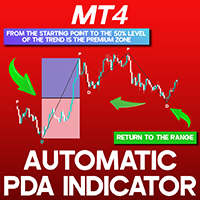
Automatic Premium and Discount ICT Indicator MT4 The Automatic Premium and Discount ICT Indicator MT4 is a crucial ICT tool in MetaTrader 4 , designed to help traders easily spot Premium and Discount zones within market trends. This indicator automatically detects Swing Highs and Swing Lows , mapping out Premium and Discount zones based on market movements. A "P" marker appears at highs, signaling Premium levels, while a "D" marker under lows represents Discount areas. Clicking these markers act
FREE

Simple QM Pattern is a powerful and intuitive trading indicator designed to simplify the identification of the Quasimodo (QM) trading pattern. The QM pattern is widely recognized among traders for effectively signaling potential reversals by highlighting key market structures and price action formations. This indicator helps traders easily visualize the QM pattern directly on their charts, making it straightforward even for those who are new to pattern trading. Simple QM Pattern includes dynamic
FREE
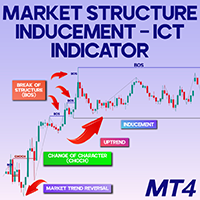
IDM-CHoCH-BOS (ICT) Indicator for MT4 The IDM-CHoCH-BOS Indicator is a sophisticated tool designed for MetaTrader 4, offering traders an in-depth approach to analyzing market structure.
Built upon the foundations of Inner Circle Trader (ICT) and Smart Money (SM) methodologies, this indicator identifies key trading signals such as Change of Character (CHOCH), Break of Structure (BOS), and Inducements (IDM).
By leveraging these insights, traders can make informed decisions regarding market entries
FREE
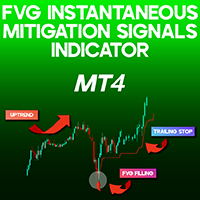
FVG Rapid Mitigation Signals Indicator MT4 The FVG Rapid Mitigation Signals indicator is designed to detect fair value gaps (FVGs) that are swiftly filled, marking them with arrows for easy identification.
Once these gaps are recognized, the indicator on MetaTrader 4 automatically generates a Trailing Stop , aligning with the trend direction for optimal trade management. FVG Rapid Mitigation Signals Indicator Specifications The following table presents the essential specifications of the FVG R
FREE

這是一款強大的高頻次嘀嗒分析工具,能自動處理海量的市場數據,並為交易者提供市場活動的準確畫面,以抓住交易機會。TickFlow易於適應任何交易風格,成為您的個人分析助手,瞬間回應市場變化,幫助識別關鍵的支撐位、阻力位和集群區域。 TickFlow 是一款現代化的分析平台,結合了智能大數據處理與直觀的可視化功能。該指標揭示隱藏的趨勢和價格動態,提供靈活的設置,快速適應您的策略。通過仔細聚合當前和歷史嘀嗒數據,它及時識別重要的市場區域。TickFlow 既可以作為獨立的分析工具,也可以用作您方法的補充,深入洞察市場微結構。 Meta Traider 5
TickFlow 為您提供: 方便的價格動態顯示。 理解供需平衡。 快速適應市場波動性。 對市場興趣顯著區域的獨特分析。 存取歷史數據以測試假設。 無噪音的當前水平動態可視化。 適用於任何工具和時間框架的通用設置。 無重繪、取消或延遲的加速水平顯示。 TickFlow 是一款有價值的工具,用於理解嘀嗒數據對價格變動的影響,並動態確定支撐位和阻力位。它揭示市場微結構與宏觀趨勢之間的聯繫,提供即時的市場活動可視化。與靜態水平不同,TickF
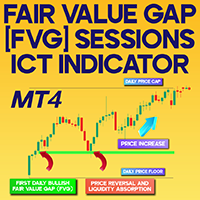
FVG Sessions ICT Indicator for MT4 The FVG Sessions ICT Indicator for MetaTrader 4 is designed to highlight daily Fair Value Gaps (FVG) using key principles from ICT methodology. It visually differentiates bullish and bearish FVG zones by marking bullish gaps in green and bearish gaps in orange. When an FVG zone is invalidated, the indicator automatically dims it, signaling that the price has broken through and reducing its importance. FVG Indicator Overview The table below provides a summary
FREE
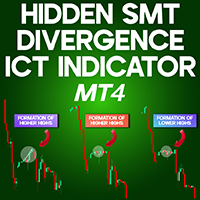
Hidden SMT Divergence Indicator for MT4 The Hidden SMT Divergence Indicator is a powerful analytical tool designed to detect divergences between three different trading instruments. Based on the Smart Money Trading (SMT) concept, this indicator helps traders identify potential price imbalances and liquidity shifts.
By marking divergences directly on the chart, it provides a visual representation of market inefficiencies, enabling traders to better understand institutional trading behavior. Hid
FREE

The indicator can be used with any time frame and forex pair. One easy to use parameter in the indicator will allow you to adapt the signals to any forex pair and time frame you want to trade.
The Arrows DO NOT REPAINT !
Information Panel: We've equipped this indicator with a user-friendly Panel. one side of the panel, the time frame is displayed, while on the other side, the currency pair is shown. Below that, the direction of the trend is identified, showing whether it is an uptrend or a d
FOREX FLIP ALERT - Show where the price will reverse with more than 95% probability. This information will help every trader to effectively open trades. The indicator on the chart draws arrows in which place and in which direction the price will reverse. The indicator does not redraw its arrows and shows price reversals for medium and long distances. This means that after the arrow appears, the price will go in the indicated direction for many points.
Benefits of the indicator: Gives sign
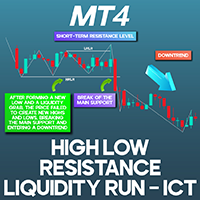
HRLR & LRLR ICT Indicator for MT4 The High Resistance Liquidity Run (HRLR) and Low Resistance Liquidity Run (LRLR) indicators are valuable tools for tracking price activity in liquidity zones, built on the ICT trading methodology . The HRLR indicator detects liquidity accumulation after the price establishes its lowest low. This phase initiates a sequence of higher lows and higher highs, indicating the start of an upward trend . Conversely, the LRLR indicator identifies price movements advancing
FREE
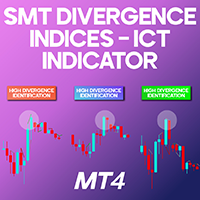
Smart Money Divergence ICT Indices MT4 The SMT Divergence Indices ICT indicator is a specialized tool available for MetaTrader 4 , designed to assist ICT traders in recognizing Smart Money Divergences across three major indices: Dow Jones (DJI), Nasdaq (NASDAQ), and S&P 500 . By using this indicator, traders can identify crucial SMT Divergence points , offering insights into potential price movements. Additionally, the indicator detects trendline divergences , as well as high and low price varia
FREE
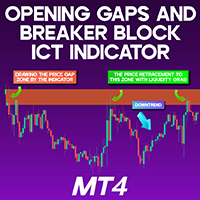
Opening Gaps and Breaker Block ICT Indicator MT4 The Opening Gaps and Breaker Block ICT Indicator MT4 is an advanced trading tool for MetaTrader 4, designed to detect daily price gaps that serve as dynamic support and resistance areas. This indicator is particularly useful for identifying key zones where price reversals may occur. Green markers indicate support gaps , while red markers highlight resistance gaps . If price moves through these zones and creates a Breaker Block (turning former supp
FREE
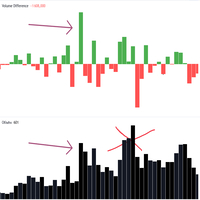
The Volume Difference indicator displays the difference in tick volume between the current and previous bars. It is designed to identify changes in market activity, which can signal important market actions.
Green bars show an increase in volume compared to the previous bar (positive difference).
Red bars indicate a decrease in volume (negative difference).
The indicator is built in a separate window and is suitable for use both independently and as part of more complex strategies for analyz

The Time_Price_SQ9_Degree indicator is based on the 9 Gann square. Using this indicator, you can identify strong time and price zones. The indicator displays the levels as a degree value. The degrees can be set in the settings. After launching, the MENU button appears. If it is highlighted, it can be moved to any point on the graph, and after double-clicking on it, it stops being highlighted and menu buttons appear. To hide the menu, just double-click on the button, it will become highlighted a

Currency Switcher Indicator
The "Currency Switcher" indicator is designed for MetaTrader 4 and allows users to quickly switch between different currency pairs and other trading instruments directly from the chart window. This indicator creates a series of buttons on the chart, each associated with a specific trading symbol. Users can click on these buttons to change the current chart symbol.
Key Features
- **Symbol Categories**: The indicator supports various symbol categories, including Maj
FREE

API BullBearPower mtf
Designed for traders who rely on BullBearPower, this tool provides a multi-timeframe (MTF) view of BullBearPower, helping you identify possible dominant trends.
Key Features: Multi-Timeframe Analysis – Analyze BullBearPower across different timeframes in real time. Dynamic Color Changes – Identify possible BullBearPower per individual timeframe with color changes. Volume Integration – Get a picture of possible trend strength with BullBearPower volume of each timefra
To get access to MT5 version please click here . This is the exact conversion from TradingView: "Breakout Finder" by "LonesomeTheBlue". The screenshot shows similar results from tradingview and Metatrader when tested on ICMarkets on both platforms. This is a medium-load processing indicator and updates are done per bar closure. It is a non-repaint indicator. Major input options are available. Buffers are available for processing in EAs. You can message in private chat for further changes you n
FREE
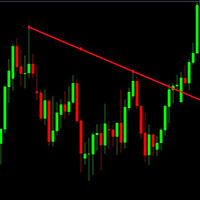
This is just a simple indicator that show Alert when the Current candle Close Above the Trendline. Previous candle do not affect the Alert. The indicator is tied to the Trendline so if the Trendline is accidentally deleted, the Alert will not work. The indicator will draw another Trendline if the current Trendline is deleted. Removing the indicator will removed the Trendline. There are 4 type of Alert to set: Popup Alert, Signal Alert, Push Notification, Comment.
FREE
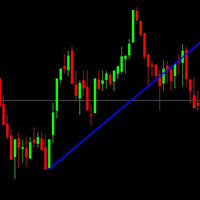
This is just a simple indicator that show Alert when the Current candle Close Below the Trendline. Previous candle do not affect the Alert.
The indicator is tied to the Trendline so if the Trendline is accidentally deleted, the Alert will not work. The indicator will draw another Trendline if the current Trendline is deleted.
Removing the indicator will removed the Trendline.
There are 4 type of Alert to set: Popup Alert, Signal Alert, Push Notification, Comment.
FREE

CFN - Multi MA & EMA Indicator for MT4 – with Alerts Enhance your technical analysis with the Multi MA & EMA Indicator – a powerful tool designed for traders who rely on Moving Averages and Exponential Moving Averages to spot trends, entries, and exits. Key Features: Supports up to 5 Moving Averages (MA) & 5 Exponential Moving Averages (EMA):
Plot multiple MAs and EMAs simultaneously on your chart, fully customizable with individual periods. Custom Colors & Styles:
Each MA and EMA l
FREE
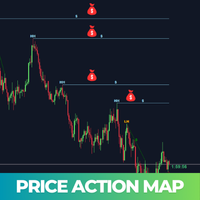
Price Action Map is an advanced trading indicator meticulously designed to provide clear visual insights into market structure by precisely labeling Higher Highs (HH) , Higher Lows (HL) , Lower Highs (LH) , and Lower Lows (LL) . Traders who find it challenging to accurately identify higher highs, lower lows, or understand different market phases will find this tool exceptionally valuable. Price Action Map significantly simplifies the analysis process, enabling traders at all skill levels to con

GO Multi Oscillator Divergence Entry is a unique divergence indicator that is different from all other divergence indicators on the market.
After purchase, leave a review, a comment or make a screenshot of your purchase and contact me to receive for free the Trade Entry Manager utility !
The uniqueness of the indicator consists of two key elements :
unlike other divergence indicators, this indicator does not use an oscillator subwindow, thus you can search for divergence of multiple oscilla
MetaTrader市场是独有的自动交易和技术指标商店。
阅读MQL5.community用户备忘更多地了解我们提供给交易者的独特的服务:复制交易信号,自由职业者开发的自定义应用程序,通过支付系统完成的自动付款和MQL5云网络。
您错过了交易机会:
- 免费交易应用程序
- 8,000+信号可供复制
- 探索金融市场的经济新闻
注册
登录