适用于MetaTrader 4的新技术指标 - 14

This non-repainting indicator, inspired by Larry Williams’ renowned "VIX Fix", replicates the power of the VIX (Volatility Index) but works across all asset classes—making it a versatile tool for traders. Originally designed for stock indices, this version adapts to any market, including forex, commodities, and crypto, providing valuable insights into potential market bottoms.
For more details, check out this pdf: https://www.ireallytrade.com/newsletters/VIXFix.pdf
Key Features: Based on the w
FREE
To get access to MT5 version please click here . This is the exact conversion from TradingView: "VolATR" by "barrettdenning" The screenshot shows similar results from tradingview and Metatrader when tested on ICMarkets on both platforms. This is a light-load processing. This is a non-repaint indicator. All input options are available. Buffers are available for processing in EAs. You can message in private chat for further changes you need.
Here is the source code of a sample EA operating base
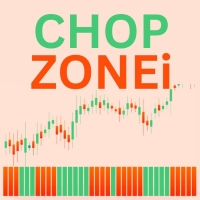
ChopZonei is a custom technical analysis indicator built to help traders identify trend strength and market conditions by calculating the angle of a chosen moving average (MA) over a specified period. The resulting angles are used to classify price action into various "chop zones," which are color-coded based on the direction and magnitude of the angle.
Key Features:
Multi-Timeframe Support: ChopZonei allows the user to calculate the indicator based on a higher timeframe (HTF) while avoiding
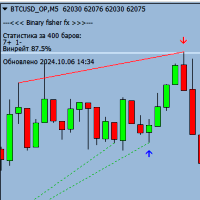
二元 Fisher FX 是一款功能强大的二元期权指标,适用于任何时间范围和任何货币对。该指标旨在识别趋势走势,并在当前蜡烛收盘前以箭头的形式指示进入点。
该指标的主要特点:
适用于任何时间范围(M1、M5、M15、M30、H1、H4、D1) 支持任何货币对 到期时间从 1 到 3 根蜡烛(默认 1 根蜡烛) 以箭头形式指示当前蜡烛收盘前的入场点 根据趋势工作,让您能够识别强劲的移动市场 重要信息:
为了使指标正常工作,您需要在终端文件夹中下载并安装“MQL5”文件夹。您可以从以下链接下载带有指标的文件夹: https://disk.yandex.ru/d/DPyo0ntaevi_2A 使用二元 Fisher FX 指标的优点:
通过准确识别趋势走势来增加盈利交易的可能性 适用于任何时间范围,这使您可以将其用于各种交易策略 支持任何货币对,扩大交易机会 立即尝试二元 Fisher FX 指标,增加您在二元期权交易中成功的机会!
FREE
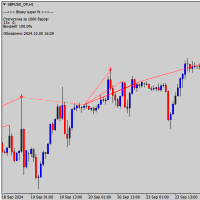
MetaTrader 4 的 Binary Super FX 是用于二元期权交易的强大振荡器。它可以用于任何时间范围和任何货币对。
二元超级外汇指标在关闭蜡烛之前以缓冲箭头的形式提供精确的入场信号,到期时间为 1 个蜡烛。这使得交易者能够就进入交易做出快速且明智的决定。
需要注意的是,在购买指标之前,建议在模拟账户上进行测试,以确保其有效性和信号的准确性。这将帮助您评估指标的性能并就其在二元期权交易中的使用做出明智的决定。
二元超级外汇指标的主要优点:
信号的准确性:该指标基于对市场趋势和模式的分析,提供非常准确的进入交易信号。 视觉显示:信号显示为缓冲箭头,使交易者能够快速轻松地识别信号。 灵活性:该指标可用于任何时间范围和任何货币对。 对于想要增加二元期权交易成功机会的交易者来说,二元超级外汇指标是一个强大的工具。
注意,为了使指标正常工作,您需要将“MQL5”文件夹放置在您的终端文件夹中,您可以从以下链接下载它: https://disk.yandex.ru/d/DPyo0ntaevi_2A
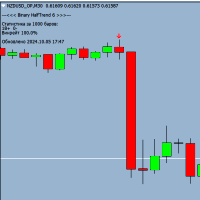
Binary HalfTrend 6 is a powerful trend indicator designed for binary options trading, providing accurate buy and sell signals. The expiration time is only 1 candle, you can trade on any timeframe. The Binary HalfTrend 6 indicator analyzes market trends and generates reliable signals in the form of arrows on the chart for profitable trades. Before using it in live trading, I recommend testing it on a demo account to choose the most profitable currency pairs for work.
Attention, for the indicato
FREE

MASTER MA 者,移平均线之指标也,用 3 异期之移平均线以成信号,策非常简单,然指标有计仪表板,见有用者回溯试之,如胜率/赢之总利...... 当指标以点数为 TP SL ,故君可以绿点文 TP 、 SL 之赤点 x 示所欲 TP SL,当指标将用此值来计赢/输百分比。
其指标于新柱开盘时严给信号。 信号永无重画迟。
议 : 用 m5 或益高版本... 有日者... 尝试用指标期以得其善。
参数:
3 移平均线期
警
TP/SL 直与每号打印图表,并据之
仪表板色位输之
-------------------------------------------------------------------------------------------

Simple ATR Stop Loss :您的市场波动性指南针,帮助您在交易的险恶水域中航行,设置更智能的 止损 ,让您看起来像个交易忍者(不包括斗篷)。 注意了,所有交易爱好者和市场专家! 看这里, Simple ATR Stop Loss 指标 - 您在疯狂交易世界中的新好朋友。 它比两块拼图还简单,但比瓷器店里喝了咖啡的公牛还强大。 ATR交易秘笈(或如何在市场浪潮中冲浪而不翻船)️: ATR:您的市场情绪解码器 ️️ 把ATR想象成市场的推特feed。高数值?它正在疯狂发推。 低数值?它处于静音模式。 使用这些情报来决定是否要入场或在岸边观望。️ 正确调整规模和瞄准 让ATR成为您的交易裁缝和目标练习教练。 它会帮您避免那些感觉像穿着弟弟妹妹衣服的仓位,和那些像在后院找独角兽一样不切实际的目标。 变色龙交易者宣言 更新您的ATR要比查看手机还频繁。认真的。 当市场曲折时,您要直行。当它直行时,您要...好吧,您明白了。要像迪斯科舞厅里的变色龙一样适应。 乘数:您的秘密武器
FREE
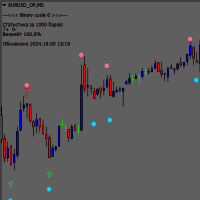
二元 Cucle 6 指标是 MetaTrader 4 平台上二元期权交易的强大振荡器,它设计用于 M5 及更高的时间范围,也可用于任何货币对。
二元 Cucle 6 指标以蓝色和红色箭头的形式提供了进入交易的精确信号,这些箭头在当前蜡烛收盘之前出现在图表上。这使得交易者能够就进入交易做出快速且明智的决定。
值得注意的是,不应考虑圆圈和粗箭头形式的信号,因为它们不准确并且可能会被重新绘制。仅应主要注意屏幕截图中圈出的箭头,它们是进入交易的可靠且准确的信号。
二元 Cucle 6 指标的主要优点:
信号的准确性:该指标根据对市场趋势和模式的分析,提供进入交易的准确信号。 视觉显示:信号显示为蓝色和红色箭头,使交易者能够快速轻松地识别信号。 灵活性:该指标可用于任何货币对以及 M5 及以上的时间范围,并且还允许您选择 1 到 3 个蜡烛的到期时间。 二元 Cucle 6 指标对于想要增加二元期权交易成功机会的交易者来说是一个强大的工具。
注意,为了使指标正常工作,您需要将“MQL5”文件夹放置在您的终端文件夹中,您可以从以下链接下载它: https://disk.yandex.
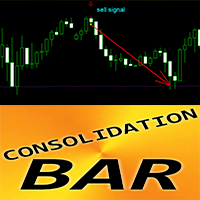
Crypto_Forex 指标整合条形图模式适用于 MT4。
- 指标“整合条形图”是针对价格行为交易的非常强大的突破重点指标。 - 指标在 1 条期间检测窄区域内的价格整合并显示:突破方向、挂单位置和 SL 位置。 - 看涨整合条形图 - 图表上的蓝色箭头信号(见图片)。 - 看跌整合条形图 - 图表上的红色箭头信号(见图片)。 - 无需重绘;无延迟;高 R/R 比率(回报/风险)。 - 具有 PC、移动和电子邮件警报。 - 指标“整合条形图”适合与支撑/阻力位结合使用。 ................................................................................................................... // 出色的交易机器人和指标可在此处获取: https://www.mql5.com/en/users/def1380/seller 这是仅在此 MQL5 网站上提供的原创产品。

Fxcycle 趋势指标 - 精确交易,持续盈利
版本: 1.00 版权属于 Fxcycle
Fxcycle Trend Indicator 是一款功能强大的趋势跟踪工具,旨在帮助交易者轻松识别市场方向。该指标基于先进的趋势分析,为各种经验水平的交易者提供精确的买入和卖出信号,是任何希望在外汇市场上实现利润最大化的人的理想工具。
主要功能 准确的趋势检测: 基于先进的移动平均线算法,Fxcycle 可高精度识别看涨和看跌趋势。 自定义警报和通知: 当检测到买入或卖出信号时,直接接收即时桌面提醒和手机推送通知。 多时间框架支持: 专为不同时间框架(M15、H1、H4 等)而设计,适合您的交易风格和策略。 可视化信号: 该指标可在图表上显示清晰的箭头买入和卖出信号,帮助您更快、更自信地做出决策。 时尚现代的设计: Fxcycle 的趋势线和信号显示设计时尚,极具视觉吸引力,让您的图表看起来更专业、更易读。 为什么选择 Fxcycle? 节省时间:无需花费数小时分析图表--Fxcycle 通过精确定位进入或退出市场的最佳时机,为您完成繁重的工作。 经过验证的准确性:该指标基于多年的市

### **外汇周期波浪信号指标**
**FxCycle WaveSignal Indicator(**外汇周期波浪信号指标)是交易者利用**波浪形态**与**指数移动平均线(EMA)**相结合的方法来识别强劲而准确的交易机会的完美解决方案。 该指标旨在根据**上波浪线**和**下波浪线**周围的价格走势提供明确的**买入和**卖出信号,并直接在图表上显示极具吸引力的视觉效果。
#### **主要功能:**
1. **准确的买卖信号检测:** 1. - 该指标使用**EMA**计算来形成**上波浪线**和**下波浪线**。当价格突破波浪线时,就会检测到**买入**或**卖出**信号,并以清晰的箭头直接显示在图表上。 - 买入信号**在价格下方以**蓝色箭头**显示,卖出信号**在价格上方以**红色箭头**显示。
2. 2. **吸引人的信号视觉显示:** - 信号状态始终显示在图表中央,文字清晰,字体美观。当没有信号时,会显示 “等待进入市场 ”状态,当检测到新信号时,该状态会自动更新为 “检测到买入信号 ”或 “检测到卖出信号”。
3. 3. **实时通
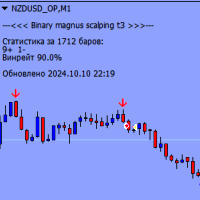
二元Magnus Scalping T3 是一种二元期权指标,适用于任何时间范围和任何货币对。使用聚类分析来识别入场点,并在当前蜡烛收盘前以弹出窗口和红色或蓝色图表上的缓冲箭头的形式发出警报。
该指标的主要特点:
适用于任何时间范围(M1、M5、M15、M30、H1、H4、D1) 支持任何货币对 到期时间从 1 到 3 根蜡烛(默认 1 根蜡烛) 进行聚类分析以确定切入点 在当前蜡烛收盘之前,以弹出窗口和图表上红色或蓝色缓冲箭头的形式发出警报 重要信息:
为了使指标正常工作,您需要在终端文件夹中下载并安装“MQL5”文件夹。您可以从以下链接下载该文件夹: https://disk.yandex.ru/d/DPyo0ntaevi_2A 我建议使用策略测试器来选择货币对和每种资产的到期日。请记住,历史上的成功交易并不能保证未来会产生积极的结果。 立即尝试二元马格努斯倒卖 T3 指标,增加您在二元期权交易中成功的机会!

ATR Pyramid ️:您的门票,助您堆积利润高过打了兴奋剂的叠叠乐塔 ,将市场波动转化为趋势冲浪 ️和加仓派对 ,只有第一笔交易有翻船风险 ,而您通过像电梯一样上移止损 来保护其余交易,创造一个舒适区,这是让您的外汇账户增长速度超过喝了浓缩咖啡的兔子的唯一真正途径!!! 注意了,所有利润堆积者和趋势冲浪者! ️ 这个 ATR Pyramid 指标是为那些喜欢建立金融金字塔的人准备的(我们保证是合法的那种 )。 你知道人们怎么说ATR只显示市场波动性吗? 好吧,情节转折 – 这不是全部! 这个巧妙的小工具实际上能比咖啡因上头的猎犬还快地嗅出趋势方向。 猜猜怎么着?我们用它来堆积利润,就像在自助餐厅一样。 ️ 但等等,还有更多! 要建立一个像吉萨金字塔一样宏伟,甚至更高的金字塔,我们建议您查看最大的做市商在做什么。怎么查?使用来自 glimpz.net 的 Glimpz 指标! ️️ 这就像有一个秘密窗口,可以洞察市场巨头的想法。不要逆流而上,要和大鱼一起乘风破浪!
FREE

The Area of Interest (AOI) Indicator is a powerful tool designed to help traders identify key market zones where price reactions are highly probable. This indicator specifically highlights two critical zones: Seller AOI (Area of Interest) : This zone represents areas where sellers are likely to enter the market, often acting as resistance. When the price approaches or touches this zone, it signals that a potential sell-off could occur. Buyer A OI (Area of Interest) : The BOI zone identifies re
FREE

Advanced Reversal Hunter Pro (ARH) is a powerful, innovative volatility-based momentum indicator designed to accurately identify key trend reversals. Developed using a special algorithm that provides a clear construction of the average volatility range, without redrawing its values and does not change them. The indicator adapts to any market volatility and dynamically adjusts the width of the band range, depending on current market conditions. Indicator advantages: Advanced Reversal Hunter Pro

Alpha Trend sign
Alpha Trend sign 是我么长期以来非常受欢迎的交易工具,它可以验证我们的交易系统,并且明确的提示交易信号,并且信号不会漂移。 主要功能: • 根据市场显示活跃区域,根据指标可以很直观的判断当前行情是属于趋势行情,还是震荡行情。 并根据指标的指示箭头切入市场,绿色箭头提示买入,红色箭头提示卖出。
• 建议使用5分钟以上的时间周期进行交易,避免因为小周期波动出现频繁的交易信号。
• 您也可以开启信号提示,以免错过最佳的交易时机。
• 本指标不但可以很好的预测趋势行情,也可以在宽幅震荡行情中获利。
• 本指标本着大道至简的原则,适合不同阶段的交易者使用。 注意事项: • Alpha Trend sign 有明确的进出场信号,不建议逆势操作,以免造成损失。 • Alpha Trend sign 是特别成熟的指标,我们团队人手一个,使用它可以实现稳定盈利。

Have you ever wondered why most systems are not effective in live trading? My answer is that it's all the fault of the so-called "Smart Money" or the institutional ones,, they constantly create spikes first up then down and vice versa to screw all the retail investors by tearing away their capital, confusing them and making the markets move randomly without any rules. But in all this there is a famous strategy, which in 2009 won the world championship, exploiting and rowing against the instituti

The indicator is designed to display key price ranges on the graph and analysis of market dynamics within the established limits. It uses the parameter Period = 1200 , which means the calculation of data based on 1200 candles or bars to form and display the range. This period is suitable for long -term trends and allows you to identify important levels of support and resistance.
The Alert = True function activates a sound or visual notice when reached the price of the boundaries of the range o

About:
Looks for price making a trend flip pattern. Importance of this pattern is that after it happens, price tends to range a bit and then breakout right after.
Features:
Looks for trend flip pattern Num of bars creating pattern Extend lines to right to wait for breakout Bull/Bear Strength for candles making the pattern Filter using Halftrend/NRTR
How it Works:
Use this technique for scalping. After a pattern happens, you will see a red/green rectangle. Red means a Bearish pattern and green

THE PRICE ACTION INDICATOR! This program finds candlestick absorption patterns and a false breakdown, after which it draws the entry points with arrows.
Input parameters:
1. PPR_Arrow The On parameter/Off display of the absorption model arrows. By default, it is set to true.
2. FB_Arrow Everything is the same as the first parameter, only for false breakdown models. By default, it is set to true.
Sincerely, Novak Production.
FREE

指标描述: Ratel Strength 指标主要用于判断多空趋势强弱趋势并给出买卖点参考信号,适用于黄金、外汇、数字货币等。 当指标 出现"B"信号为买入做多信号,出现"S"为卖出做空信号,同时, 当 柱体在0轴上面,多头较为强势, 当 柱体在0轴下面,空头较为强势;
指标参数:
Proid: 14 B/S signal reversal deviation value: 1.00
Display B/S signal: TRUE Up trend signal color: clrLightSeaGreen Down trend signal color: clrRed 指标用法:
柱体在0轴上面,多头较为强势;
柱体在0轴下面,空头较为强势; 出现"B"信号为买入做多信号,出现"S"为卖出做空信号; 祝您投资顺利!

The Trend Bomer indicator can be used alone or as an addition to your strategy. Does not repaint and causes no delay. Customizable SL and TP setting. It provides alerts as well as signals and when an alert is received orders are placed after waiting for the candle to close. The red arrow indicates the sell signal and the blue arrow indicates the buy signal. It can be optimized for all currencies, commodities or cryptocurrencies. You can change and optimize the settings using the "indicatorPeriod
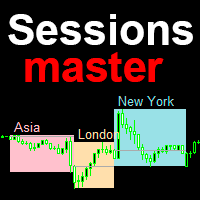
Session master - индикатор торговых сессий с расширенными возможностями. По умолчанию отображает Азиатскую, Лондонскую и Нью Йоркскую сессии, с возможностью самостоятельно настроить каждую сессию индикатора под свою торговлю. Описание Отображает прямоугольной областью заданный период в часах дня Максимум и минимум сессии соответствуют максимам и минимумам прямоугольных областей сессий Индивидуальная настройка для каждой сессии, имя, цвет, период в часах Автоматически переводит время сессий зада

TitanVision indicator is a versatile technical analysis tool that helps traders identify market trends and potential entry and exit points. It features a dynamic Trend Catcher Strategy, adapting to market conditions for a clear visual representation of trend direction and various trend reversal points. Traders can customize the parameters according to their preferences. The indicator helps in identifying trends, signals possible reversals, acts as a trailing stop mechanism and provides real-tim
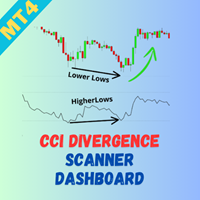
Welcome to the CCI Divergence Multicurrency Scanner Dashboard , an advanced tool designed to help traders efficiently detect CCI (Commodity Channel Index) divergence patterns across multiple currency pairs. This scanner enables quick identification of potential reversal opportunities, giving you a significant edge in your trading strategy. Key Features: Effortless Multicurrency Scanning Monitor multiple currency pairs in real-time and receive instant alerts when significant CCI divergence patter

Bank Levels Institutional MT4 Indicator Overview The Bank Levels Institutional MT4 Indicator is a powerful trading tool designed to enhance your trading strategy by identifying key bank levels in the financial markets. This indicator helps traders to visualize significant price levels that institutional players are likely to monitor, providing valuable insights for making informed trading decisions. Key Features Dynamic Bank Levels : Automatically plots critical bank levels based on historical p

This indicator is based on the strategy shared by TheMas7er on his youtube channel.
The IDR/DR range will help you identify the high and low of the day once a candle closes above or below the the DR levels.
The IDR/DR range is determined 1 hour after session open, 09:30 am est.
I have incorporated the fibonacci tool to help you mark the retracement for a good entry in the premium or discount zone.
Important
This indicator is designed for the indices and M5 timeframe, but you are welcome to

L'indicatore QuantumBlocks è uno strumento avanzato progettato per i trader che desiderano identificare con precisione zone di accumulazione o distribuzione nel mercato, comunemente note come "Order Blocks". Questi livelli rappresentano aree chiave dove istituzioni finanziarie o trader di grande volume piazzano i loro ordini, influenzando pesantemente il movimento dei prezzi. Funzionalità principali: Identificazione automatica dei blocchi di ordini rialzisti e ribassisti : L'indicatore scansion

Unveil Market Secrets with Sneaky Busters on MetaTrader 4! Delve deeper into the intricate world of trading with the Sneaky Busters indicator, specifically crafted to spotlight the sophisticated maneuvers of smart money and uncover hidden market trends. Comprehensive Features: 1. Smart Money Accumulation & Distribution Detection: Accurate Analysis: Identify key zones where smart money collects and disperses assets. These insights help you understand market sentiment and potential turning points.
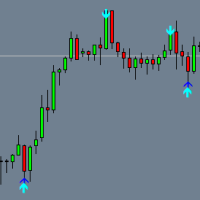
Binary DUNKS はバイナリーオプション取引用に設計されたツールで、 M5以上 のタイムフレームに最適化されています。このインジケーターは、どの通貨ペアでも動作し、潜在的なエントリーポイントを特定するのに役立ちます。 主な特徴 エクスピレーション:
デフォルトでは 1本のローソク足 に設定されており、インジケーター設定で調整可能です。 シグナル:
インジケーターは矢印を生成します: 赤い矢印 — 売りシグナル。 青い矢印 — 買いシグナル。
シグナルは、ローソク足の上または下に 2つの矢印が確認された場合 に最も効果的です。 インストールと使用方法 要件:
正常に動作させるには、 "MQL5" フォルダーをターミナルディレクトリにコピーしてください。 フォルダーをダウンロードする: ダウンロードリンク 。 インストールガイド:
設定手順のチュートリアル動画を見る:
動画 を見る 。 追加機能:
シグナルが表示されたときにポップアップ通知を受け取るには、 追加インジケーター をインストールしてください:
インジケーター を ダウンロード 。 Binary D
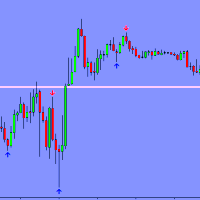
Binary crater 是 MetaTrader 4 的一个强大且多功能的指标,专为二元期权交易而设计。它在任何时间范围和任何货币对上都能有效工作,使其成为交易者极其灵活的工具。
主要特点:
趋势分析:该指标自动判断市场当前的趋势,帮助交易者顺着趋势的方向进行交易,从而增加交易成功的可能性。
发出信号:该指标产生缓冲箭头,指示可能进入交易。向上箭头表示买入信号,向下箭头表示卖出信号。
1 根蜡烛到期:该指标非常适合短期交易,因为其信号可用于单根蜡烛到期。
多功能性:该指标可以应用于任何时间范围和任何货币对,这对于具有不同策略和偏好的交易者来说非常有用。
易于使用:该指标易于安装和使用,任何级别的交易者都可以使用。
请记住,尽管有这么多好处,二元期权交易总是涉及风险。在开始交易之前,请确保您完全了解这些风险。
注意,为了使指标正常工作,您需要将“MQL5”文件夹放置在您的终端文件夹中,您可以从以下链接下载它: https://disk.yandex.ru/d/DPyo0ntaevi_2A
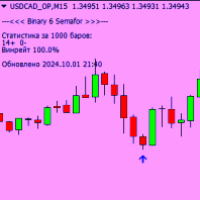
Binary 6 Semafor 是 MetaTrader 4 的通用二元期权指标。
- 适用于任何时间范围和货币对
- 准确检测入口点
- 信号在当前蜡烛收盘前出现在图表上
- 到期 1 蜡烛
- 用于输入的缓冲区箭头
-显示当前资产的统计数据
测试结果:
该指标已通过测试并获得了令人印象深刻的回报,证明了其在各种市场条件下的有效性。对于想要最大化利润并最小化风险的交易者来说,它是理想的选择。
注意,为了使指标正常工作,您需要将“MQL5”文件夹放置在您的终端文件夹中,您可以从以下链接下载它: https://disk.yandex.ru/d/DPyo0ntaevi_2A
笔记:
该指标不是利润的保证,应与适当的风险管理结合使用。建议在真实账户上使用该指标之前先在模拟账户上测试该指标。

The Fast flat indicator can recognize and notify you of short flats after the price rises or falls. Where the price can rush further or reverse. ++ The indicator is open to arbitrary flat settings. You will probably have to conduct quite a few tests, approaching the best results. I will be very grateful if you share in the comments your tests, parameters and advice to other users, who may also be able to improve your results. Should I use it for entry signals, order stops, hedging...? - The indi

趋势振荡器 - 是一种高级自定义 Crypto_Forex 指标,高效的交易工具!
- 使用高级新计算方法 - 参数“计算价格”有 20 个选项。 - 有史以来最平滑的振荡器。 - 绿色表示上升趋势,红色表示下降趋势。 - 超卖值:低于 5,超买值:超过 95。 - 使用此指标,有很多机会升级标准策略。 - 具有 PC 和移动警报。 .................................................................................................................... // 出色的交易机器人和指标可在此处获取: https://www.mql5.com/en/users/def1380/seller 这是仅在此 MQL5 网站上提供的原创产品。

Gann Box 指标是一个强大且多功能的工具,旨在帮助交易者识别和利用市场的关键水平。该指标允许在图表上绘制一个矩形,该矩形会自动划分为多个区域,并带有战略水平 0, 0.25, 0.50, 0.75, 1 。当价格触及其中一个水平时,会触发警报,从而为交易决策提供宝贵的帮助。您可以即时了解市场相对于您绘制区域的变化情况。要绘制一个区域,只需绘制一个简单的矩形并将其命名为 GannBox 。 该指标适用于所有类型的交易者,无论是使用 支撑和阻力 概念、 供需 理论的交易者,还是 ICT 技术或 公平价值缺口 (FVG) 专家。 无论您是 日内交易者 、 波段交易者 还是 趋势交易者 , Gann Box 都可以帮助您更好地理解和预测市场走势,同时提高您的反应能力和交易表现。 MT5 版本
Gann Box 是一个 多时间框架 指标:它可以绘制在更大的时间框架上,比如 H1,同时允许在较小的时间框架(如 15 分钟图表)上进行更精确和快速的交易。 除了其灵活性之外,该工具还可以通过直观的 管理面板 在图表上进行全面自定义。此面板允许根据您的偏好激活或禁用每个级别,并启用或禁用相关的警

支撑阻力耳语器 是一款功能强大的工具,旨在帮助交易者识别市场中的关键支撑位和阻力位。该指标利用价格行为在图表上动态绘制红色阻力线和绿色支撑线,清晰直观地表示可能发生市场逆转或突破的关键价格区域。与依赖分形的传统方法不同,该指标通过根据可自定义的回溯期内的最高价和最低价计算支撑位和阻力位来避免滞后。 主要特点: 回溯期: 使用 LookbackPeriod 参数自定义指标以分析特定数量蜡烛的价格数据。这允许交易者微调支撑位和阻力位的敏感度。 历史数据分析: 该指标最多可以扫描 500 个历史条形图(可通过 历史 参数调整),以确保全面分析市场价格走势。 SR Continuation Filter: 启用或禁用 SRContinuationFilter 以优化线条的绘制方式。此过滤器可确保仅当当前蜡烛的最高价格与前一个蜡烛的最高价格匹配时才绘制支撑线或阻力线,从而创建虚线效果,以更好地显示关键区域。 警报系统: 使用多功能警报系统随时掌握市场动向。每当价格触及支撑位或阻力位时,您都可以激活弹出警报 ( PopupAlert )、移动通知 ( MobileAlert ) 或

外汇剥头皮指标 – 您在金融市场中赚钱的精确工具
MT4的外汇剥头皮指标是所有希望以最高精度进行市场剥头皮交易的交易者的完美助手。借助于对精确数据的分析,该指标为您提供及时且准确的信号,非常适合快速做出交易决策。
量身定制的精确度 图表上显示的每一个箭头都基于缜密的计算,提供最佳的进出机会。这些不是随机信号,而是基于实时市场分析的精确指示。
精准识别反转点 该指标能够高精度地识别价格潜在的反转点,使其成为您交易的必备工具。依靠可靠数据生成的信号,即使在市场最动荡的时期,您也能最大化利润。
简洁易读的界面 正如您在截图中所见,外汇剥头皮指标在图表上清晰地显示箭头,使得信号的读取和解释更加容易。无论您是捕捉微小波动还是等待更明确的信号,该指标都能保证您获得精确且即时的见解。
为什么选择外汇剥头皮指标?
基于精确数据的准确和可靠的信号
适合低时间框架的剥头皮策略
易于安装和配置到MT4上
适合各级交易者
立即获取外汇剥头皮指标,提高您的交易精确度!不要错过基于精确数据进行更明智操作的机会。

发现纳斯达克100市场的高级交易机会,使用NASDAQ Smart Indicator。 NASDAQ Smart Indicator是一个用于纳斯达克100市场交易的强大且有效的工具。该指标专为1分钟和5分钟的时间框架设计,具有高精度和专业性。您可以轻松激活它并享受其带来的各种优势。 主要特点: 在1分钟和5分钟时间框架内的最佳表现 :此指标特别为这两个时间框架设计,以提供最佳的交易结果。虽然它也适用于其他时间框架,但主要关注1分钟和5分钟,这对交易者尤为重要。 与纳斯达克100策略兼容 :此指标是我们纳斯达克100策略的重要组成部分,帮助您识别适合的交易机会。 此指标在上线之前经过了一年的测试,并表现出令人满意的效果;但在使用此指标之前,用户应先进行回测并熟悉其功能。 振荡器结构 :NASDAQ Smart Indicator作为振荡器运行,并显示在图表下方的单独窗口中。这种结构使您可以轻松观察交易信号。 使用指南: 激活指标 :首先激活指标,确保它正确显示在您的图表上。 利用颜色信号 :注意直方图中的颜色变化,这些变化显示了交易信号。绿色直方图表示买入信号,而红色则提醒您是卖出信

Trading System Double Trend - an independent trading system consisting of several indicators. Determines the direction of the general trend and gives signals in the direction of price movement.
Can be used for scalping, intraday or weekly trading.
Features
Works on any time frames and trading instruments (forex, cryptocurrencies, metals, stocks, indices.) Simple visual reading of information that does not load the chart The indicator does not repaint and does not complete signals Works only wh

Introducing Order Blocks Breaker , a brand-new way to identify and leverage order blocks in your trading strategy. After developing multiple order block tools with unique concepts, I’m proud to present this tool that takes things to the next level. Unlike previous tools, Order Blocks Breaker not only identifies order blocks but also highlights Breaker Order Blocks —key areas where the price is likely to retest after a breakout. MT5 - https://www.mql5.com/en/market/product/124102/ This tool inco
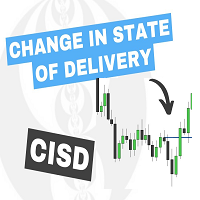
The Change In State Of Delivery (CISD) indicator detects and displays Change in State Of Delivery, a concept related to market structures.
Users can choose between two different CISD detection methods. Various filtering options are also included to filter out less significant CISDs.
USAGE Figure 2 A Change in State of Delivery (CISD) is a concept closely related to market structures, where price breaks a level of interest, confirming trends and their continuations from the resulting
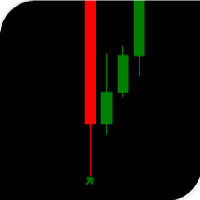
The arrow indicator without redrawing shows potential entry points into the market in the form of arrows of the appropriate color: the up arrows (usually green) suggest opening a purchase, the red down arrows suggest selling. The appearance of arrows may be accompanied by beeps. It is usually assumed to enter at the next bar after the pointer, but there may be non-standard recommendations. Arrow indicators visually "unload" the price chart and save time for analysis: no signal – no deal, if ther

ADX Shark Scalper – The Ultimate Hybrid Indicator for Precision Scalping Dive into the markets with the ADX Shark Scalper , a powerful and versatile tool designed for traders who seek precision in every trade. This cutting-edge indicator seamlessly combines multiple advanced technical signals into one streamlined system, allowing you to spot good buy and sell opportunities with ease. At its core, the ADX Shark Scalper leverages the power of trend and momentum detection through the integration of

the indicator presents three supertrends that identify a possible trend for the day and places possible entry flags when they are aligned, audible and visual alarms available, usable on all timeframes, ability to customize trends, colors, and time filter.
each asset needs its own specific supertrends, indicator has standard trends that can be used on M5

The script tries to determine the overall direction of the market, using smoothed Heiken Ashi candles. The coloring system (using bright and dark colors) is an attempt to detect strong market and weak market conditions. There's also an oscillator within the script
These are the features: Alert condition Features: You can now set alerts in the alert dialog for events like trend switch, trend strengthening and weakening; all for both Bullish and Bearish trend.
I also added the code for custom a
FREE

This dashboard shows you the 3MA Cross Overs current status for Multi-currency multi-timeframes. Works for Metatrader 4 (MT4) platform. Detailed Post:
https://www.mql5.com/en/blogs/post/759238
How it Works:
MA Cross Signals It will show “S” Green/Red Strong Signals and “M” or “W” Green/Red Medium or Weak signals. We have 3 types of MA: Faster, Medium and Slower MA. A strong signal is when FasterMA and MediumMA are both above/below SlowerMA. A medium signal is when only FasterMA is above/below

Detailed post explained:
https://www.mql5.com/en/blogs/post/759269
This is a slope indicator for Bollinger Bands indicator. It provides slopes for BB top band, center band (main) and Lower Band. You can also set a threshold value for Center line to control Red/Green slope histogram lines. Settings:
You can choose which line you need the slope and Threshold Alerts for in Drop down.
Slope Thresholds: for Alerts. Please note that Alerts only happen when Threshold is crossed. e.g.: If Threshold
FREE

The indicator is a histogram for scalping the lower timeframes
When the hill behind appears go short and when it disappears go long
The indicator has only sound alerts
The colors can be adjusted as preferred
Suitable for lower timeframes - 1 - 5 minutes
Test in demo before purchase
Enjoy -----------------------------------------------------------------------

Unlock the Power of Multi-Market Insights with Our Cutting-Edge Dashboard Indicator
Are you tired of juggling multiple charts and indicators just to stay on top of the markets? Introducing the "RSI & EMA Cross Dashboard" - a revolutionary trading tool that consolidates critical signals across your favorite currency pairs and timeframes into a single, easy-to-read display.
Meticulously coded by our team of seasoned developers, this indicator harnesses the power of RSI and EMA crossover analysi
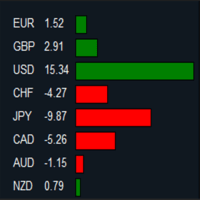
MT5 Version: https://www.mql5.com/en/market/product/124136 Imagine you’re at the helm of your trading terminal, scanning charts of various currency pairs, trying to figure out which ones are strong, which ones are weak, and where the real opportunities lie. It’s a lot to process—flipping between charts, calculating movements, and comparing performance. But what if all of that could be done for you, neatly displayed in one place? That’s where this Forex Strength Dashboard comes in. Picture thi
MT5 Version: https://www.mql5.com/en/market/product/124107 A Day in the Life of a Trader: Discovering the Forex Matrix Dashboard In the fast-paced world of forex trading, keeping track of multiple currency pairs can feel overwhelming. That’s where the Forex Matrix Dashboard comes in, making the life of a trader much easier. Imagine opening the dashboard and instantly seeing all your favorite currency pairs, like EUR/USD, GBP/USD, and USD/JPY, displayed clearly with their latest prices. No mo

MT5 Version: https://www.mql5.com/en/market/product/124150 You’re sitting in your trading room, sipping coffee as the markets start their day. The screen in front of you is alive with numbers, price movements, and endless charts. Each one demands your attention. But you don’t have time to dive into every single detail. You need a quick, reliable way to read the market’s mood. That’s when you glance at your Sentiment Dashboard—a custom-built tool designed to simplify your trading decisions. This
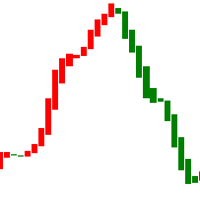
这是一个跟踪价格趋势的指标,当市场出现异常时可以向交易者发出警报。
指标图又红绿两色标记,图表背景颜色为白色,不能修改为背景其他颜色。 当指标颜色由红色变为绿色时,代表市场价格出现了暂停甚至反向,这是一个提醒交易者存在空单的可能。当指标颜色由绿色变为红色时,代表市场价格可能会出现上涨,这时提醒交易者这是一个潜在做多的时机。 交易者应该注意到,该指标是由数值构成的,数值有大小,因此选择在较大的数值且信号由红变绿时去做空,或者在较小数值且信号由绿变红时去做多,是一个明智的选择,而不是在靠近0轴时去做空或者做多。 何时出场是一个难题,它考验了交易者的交易水平也考验了交易者的心态是贪婪还是谨慎。在这一方面,我认为每一个都有不一样的特征,选择最适合你的才是最好的,而不是大众化。
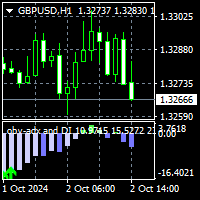
To get access to MT5 version please click here . This is the exact conversion from TradingView: "OBV ADX and DI" by " kocurekc ". This is a light-load processing and non-repaint indicator. All input options are available. Buffers are available for processing in EAs. You can message in private chat for further changes you need. I removed the background coloring option to best fit into MT platform graphics.

Scopri l'Indicatore Avanzato di Zone di Offerta e Domanda Sei pronto a portare il tuo trading al livello successivo? L'indicatore "Advanced Supply and Demand Zone" è lo strumento definitivo per identificare con precisione le zone chiave di supporto e resistenza sul mercato, permettendoti di prendere decisioni informate e tempestive. Come Funziona Questo indicatore innovativo analizza il mercato utilizzando frattali veloci e lenti per individuare i punti di inversione del prezzo. Si basa sui prin

Advancing in NASDAQ 100 Trading with the Smart "Candle Color" Indicator The indicator we offer is one of the good tools for trading in the NASDAQ 100 market, especially in the 1-minute and 5-minute timeframes. This indicator is designed with precision and scientific rigor and can also be used in other timeframes. All you need to do is activate it and leverage its power. Unique Features: Optimized Performance in 1-Minute and 5-Minute Timeframes: This indicator is specifically designed for these

Magic Moving AI The Magic Moving AI indicator is one of the best tools for trading in the NASDAQ 100 market. This tool is specifically designed for the 1-minute and 5-minute timeframes and operates with high precision. You can easily activate this indicator and benefit from its advantages. Unique Features: Specialized Performance in 1-Minute and 5-Minute Timeframes: While this indicator is capable of working in other timeframes, its primary focus is on these two timeframes to deliver optimal re

The indicator now available to you is one of the best tools for trading in the NASDAQ 100 market, particularly in the 1-minute and 5-minute timeframes. This tool is designed with precision and can also be used for other timeframes. All you need to do is activate it. Key Features: Specialized Performance in 1-Minute and 5-Minute Timeframes: While this indicator can work in other timeframes, it delivers optimal results in these two timeframes. Compatibility with the NASDAQ 100 Secret Strategy: Th

Want to create an Expert Advisor (EA) using an indicator that doesn’t store the required data in a buffer (visible in the Data Window) and only draws objects on the chart? This solution captures chart objects and places them into buffers, allowing you to create an EA—whether you're using EA Builder Pro or writing code with iCustom—by selecting the correct values using those buffers (modes). It works with any object visible in the Object List that has a unique Name or Description, such as: Trend
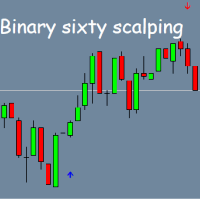
Binary Sixty Scalping – MT4平台二元期权指标 Binary Sixty Scalping是专为MT4平台二元期权交易设计的指标。该指标适用于任何时间周期,但为了更高的准确性,建议使用M5或更高的时间周期。该指标兼容所有货币对,可以适应各种市场。 主要特点: 默认到期时间为1根K线 ,可在设置中调整; 基于趋势交易 :该指标分析趋势方向,找到最佳入场点并给出信号; K线收盘前的准确信号 :图表上会显示箭头–蓝色表示买入,红色表示卖出; 信号统计 :显示信号成功率统计,有助于评估指标的效果; 无重绘 :确保信号的可靠性和稳定性。 安装指南: 为了使该指标正常运行,请将“MQL5”文件夹复制到终端的根目录。下载文件: Yandex Disk 。详细安装说明请参见 视频指南 。 该指标是寻找二元期权可靠信号的交易者的宝贵工具,基于趋势跟踪策略和精确的入场信号。

FVG 区域指标是一种强大的工具 ,旨在识别市场中的公允价值缺口 (FVG),突出公允价值和市场价格之间的价格不平衡。这种对缺口的精确识别使交易者能够发现潜在的市场进入点和退出点,从而大大增强他们做出明智交易决策的能力。
FVG 区域指标具有直观且用户友好的界面,可自动扫描图表中的公允价值缺口,并在价格图表上实时标记这些区域。这使交易者能够快速轻松地识别可能预示即将到来的价格调整或趋势延续的潜在价格不平衡。
主要功能包括: 实时缺口检测 :自动识别并标记出现的 FVG。 以点为单位显示缺口大小 :该指标以点为单位显示每个已识别缺口的大小,帮助交易者了解缺口的重要性。 与当前价格的点差 :即时计算并显示当前价格与已识别的公允价值缺口之间的点差。 清晰的可视化: 视觉上不同的 FVG 区域采用颜色编码以便快速参考,帮助交易者专注于关键市场领域。
无论您是经验丰富的交易者还是技术分析新手,FVG 区域指标都能提供对市场价格不平衡的重要见解,帮助您准确而自信地完善交易策略。
参数 缺口参数 缺口填补检测百分比 - 设置将缺口视为已填补的百分比 以点为单位显示缺口 - 启用或禁用以点为
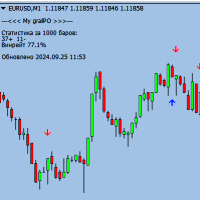
Attention, for the indicator to work correctly, you need to put the "MQL5" folder in your terminal folder, you can download it from the link below: https://disk.yandex.ru/d/DPyo0ntaevi_2A
Binary Scalper 7 is a powerful tool designed to identify and predict the next candle, allowing traders to make informed decisions when trading binary options. This indicator works on any time frame and with any expiration, making it a versatile and reliable tool for traders of all levels.
How it works:
The

过滤掉小的价格波动,专注于更大的趋势 . Renko 图表指标将帮助您过滤掉小的价格波动,以便您可以专注于整体趋势。 价格必须移动指定距离才能创建一个 Renko 砖块。 这使得识别当前价格移动的方向变得更加容易。 多功能工具 : 包含 66+ 项功能 | 如有任何问题请联系我 | MT5 版本 在指标设置中,您可以配置: 计算设置: 块大小,以点为单位; 指标样式:
块颜色; 程序文件应放置在 " Indicators " 目录中。 //--------------------- 多功能工具 : 包含 66+ 项功能 | 如有任何问题请联系我 | MT5 版本
//----------------------------------------------------
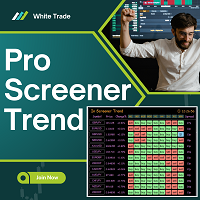
專業篩選器趨勢 Pro Screener 趨勢交易指標旨在使用現代機器學習演算法來確定金融市場趨勢的方向。此指標可以為新交易者和經驗豐富的交易者提供清晰的開倉和平倉訊號,從而大大簡化交易。
主要特點: 1. 多幣種儀表板: 此指標提供了一個互動式儀表板,可同時顯示 10 多種貨幣對的趨勢。這使得交易者能夠快速評估市場的當前狀態,而無需在圖表之間切換。
2. 多時間框架分析: 「Pro Screener Trend」支援對所有主要時間範圍(從分鐘到每日)的分析,使交易者能夠看到短期和長期的趨勢。這對於在不同時間範圍之間使用收斂策略的人特別有用。
3.機器學習演算法: 該指標基於機器學習的最新進展,使其能夠分析歷史數據並檢測標準技術分析方法無法獲得的模式。這使得該指標更能適應市場變化。
4.輸入輸出訊號: 在圖表上,「Pro Screener Trend」直觀地顯示了進入點和退出點。這些訊號是基於對當前形勢和歷史趨勢的分析。交易者可以利用這些訊號來優化策略並降低風險。
5.使用方便: 該指標的介面直觀,即使是新手交易者也可以輕鬆使用。所有數據均以人類可讀的格式呈現,促進決策

Китайский (Chinese): Binary Scalper 6 – 强大的二元期权MT4指标
Binary Scalper 6 是一个专为 MetaTrader 4 (MT4) 设计的高级趋势分析和二元期权交易工具。此指标适用于任何货币对和时间框架,为所有水平的交易者提供清晰的交易信号和统计数据。 主要特点: 趋势检测 :精准识别趋势市场,为交易者提供明确的交易方向。 支持任意货币对 :适用于任何货币对,让您轻松选择最熟悉的市场。 兼容所有时间框架 :从 1 分钟到月线图灵活使用。 1 根蜡烛到期信号 :快速明确的交易机会。 内置统计数据 :显示当前资产的关键性能数据。 缓冲箭头 :清晰的可视化信号,助您精准下单。 如何使用:
下载 MQL5 文件夹并将其放置于您的 MetaTrader 4 目录中。下载链接: 点 击 此处 。

Trend StarteR — это индикатор на основе нескольких RSI, который подает сигналы восходящего и нисходящего тренда в виде стрелок. Индикатор был создан для прогнозирования возможного тренда и помощи трейдерам в торговле по этим трендам. Этот индикатор не перерисовывает обратную краску руды, сигнал этого индикатора не задерживает. ================= Рекомендации: брокер с низким спредом, любой таймфрейм, но лучше придерживаться M5 и выше, чтобы побить спред. ================================= Парамет
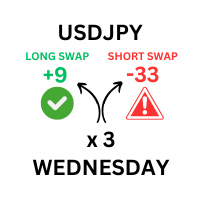
该工具旨在显示交易平台上所有可用货币对的详细掉期汇率。 它允许交易者在一个单独的、视觉增强的窗口中快速查看多头和空头掉期价值。 该工具提供用户定义的手数输入,确保根据当前掉期利率和交易量进行精确计算。 此外,它还提供了考虑标准利率和周末调整利率的情况下应用掉期费用的时间。 注意:交换信息每天都会根据您的交易平台而变化。 ------------------------------------------------------------------------------------------------------------------------------------------------------------- 该工具旨在显示交易平台上所有可用货币对的详细掉期汇率。 它允许交易者在一个单独的、视觉增强的窗口中快速查看多头和空头掉期价值。 该工具提供用户定义的手数输入,确保根据当前掉期利率和交易量进行精确计算。 此外,它还提供了考虑标准利率和周末调整利率的情况下应用掉期费用的时间。 注意:交换信息每天都会根据您的交易平台而变化。

Attention, for the indicator to work correctly, you need to put the "MQL5" folder in your terminal folder, you can download it from the link below: https://disk.yandex.ru/d/DPyo0ntaevi_2A
One of the best arrow indicators for Binary Options, which can also be used in the Forex market. Any time frame from M1 to MN, any currency pair, can also be used on stocks - the indicator is universal. Expiration from 1 to 5 candles. Displays traffic statistics on a graph. The indicator gives signals along th
FREE

Detailed blog post with extras downloads: https://www.mql5.com/en/blogs/post/759154
About: Price ranges most of the time in forex… Like 70-80% of the time. And then it breaks out of the range to continue in a trend. Even in a trend, price makes smaller ranges all the time. Range Breaker Scalper is a tool to find the times when price breaks out of a range. A sudden break means that price will continue on for next few bars towards the breakout. So, these areas are best for scalping. Especially if
MetaTrader 市场 - 在您的交易程序端可以直接使用为交易者提供的自动交易和技术指标。
MQL5.community 支付系统 提供给MQL5.com 网站所有已注册用户用于MetaTrade服务方面的事务。您可以使用WebMoney,PayPal 或银行卡进行存取款。
您错过了交易机会:
- 免费交易应用程序
- 8,000+信号可供复制
- 探索金融市场的经济新闻
注册
登录