适用于MetaTrader 4的新技术指标 - 36

Uses a trend filter to plot the lines and arrows. Great for scalping. Settings: TrendPeriod: change to your preference. Alerts. How to use: Can be used on any time frame. Attached to chart, and wait for arrow to appear on multiple timeframes. Buy : - Blue arrow and blue line cross below price on multiple time frames; e.g., on D,W,M or H1,H4,Daily or M30,H1,H4 Sell : - Yellow arrow and red line cross above price on multiple time frames; e.g., on D,W,M or H1, H4, Daily or M30,H1,H4
**Best r

Innovative Max Min swing This is a really different indicator for drawing Max and Min on the charts. This indicator draws Min and Max levels in a innovative way, based on a volatility proprietary calculation. In this way you will be able to draw trendlines in an objective way and also to see the break of Max and Min levels. You have three paramaters you can play with, in order to suite the volatility to your trading style. The indicator works on every time frame. Added: - Sound Notification
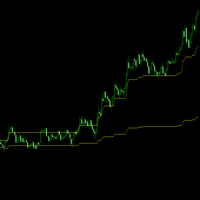
Is the market ranging (balance) or trending (Imbalance) ? This indicator exports a huge concept used in volume analysis (value area) into the price action. It makes it on Intraday level. How to read it? Simple! But you need to make practice. Making profit in market is more than a 2-rule system.
When the price inside the lines, the market is in "range mode".
If the price is above the upper line, the market is trending up.
If the price is below the lower line the market is trending down

Clear trend filter This is a filter-trend indicator. From the settings you can select to use more filter or less. The very interesting part of the indicator comes out using with all the filter. In this way you can follow the trend easily even when the market is without a strong trend, but is instead more flat. I personally use it on 1 minutue timeframe with MORE FILTER (you can select it from the input setting) in order to have an overlook of trend in the market. Added: - Sound Notificatio
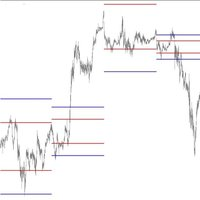
Equilibrium Levels support resistence Intraday indicator --> it means it works on lower TimeFrames , from 1minute to 4hours. This indicator is able to calculate and draw 2 levels (1 support and 1 resistence) representing the Barycenter's levels for a specific day session. From the setting you can choose only one parameter, that's the lenght of Barycenter's orbit. I personally attach the same indicator 2 times on the same chart, inputting as orbit: 0.15 and 0.30. Then what you will no
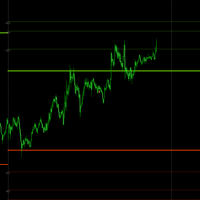
This indicator draws the projections of Fibonacci above the yesterday high and below the yesterday low. Why?
1) First of all, in this you can take the pulse of the market (trend or range). For instance If the price runs above yesterday's high the trend is UP.
2) In this way you will have automatic targets for the trend
3) you can wait the market on excess levels for contrarian and low risk trades.
If you buy the product feel free to contact me for additional tips or info.
I wish you
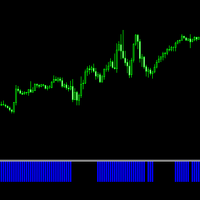
This is a clear and simple filter I've created based on a Ichimoku strategy and setup. I personally like to use the indicator in a multi timeframe approach. It can be used in a double way:
1) Every time the indicator change the colour, you can use the this first change as your trigger point.
2) You can follow the indicator for the trend direction and trade with your other signals.
Added: - Sound Notification - PopUp Notification - Mobile Push Notification (To make it work follow
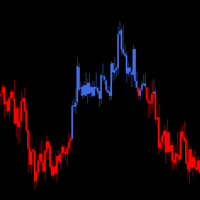
Never aginst the trend This is a really top indicator indicating the main trend in a clear and easy way. I reccomend you to use it on multiple timeframe in order to create a powerful view and strategy. It works on every market in the same way. If you trade against the trend you will work more for less, so stick with the trend. I hope you will find it useful. All the best with your trading! Keep it simple stupid, is the way! Added: - Sound Notification - PopUp Notification - Mobile Push Noti
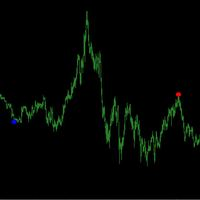
Semi automatic system John Bollinger bands Entry Bollinger Excess with Filter.With this indicator you can build your own semi-automatic strategy based on bollinger bands excess. You can play with the settings to find the best solution for your style and trading attitude. The indicator shows a signal whenever it finds a trigger-entry(coded inside) based on bollinger bands excess and an additional trend-filter(moving average). This tool will support your manual trading in order to easily spot
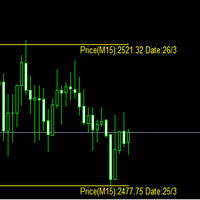
This indicator can spot strong volume levels on different timeframes. Everything is customised from the setting. You can hide by the colour the leveles you don't need. In this way you will map the market with reaction zone and you can use them as target levels or entry levels depending on your strategy. Hope you will find it useful and all the best with your trading. Added: - Sound Notification - PopUp Notification - Mobile Push Notification (To make it work follow the instructions: htt

'Zig Zag Percentage strenght' This indicator is awesome. Why? It's able to show the percentage of the last leg, compared with the previous leg. In this way you have a better understanding of the forces in play in that moment. In fact, for example, if you see that the up extensions are, in percentage, greater of the down legs, that means that there is more bullish pressure or maybe the market is starting to reverse from downtrend to uptrend. Hope you will ind it useful !
Based on Trend Following Strategy, QCAFE SUITE was built to get more accurate signal for Traders to decide whether to enter trades, included in the SUITE is QCAFE+ filter to eliminate false signals. The Signals are generated based on formula of Hull Moving Average ( HMA ) to minimize the lag of a traditional moving average - developed by Alan Hull in 2005 Setting: Limited Bars of back test Fast Period Low Period Fast/Low period to generate Buy/Sell signal
Based MA Period B ased Moving Averag
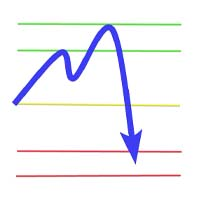
To measure the daily range, sell when above 30 pips in the European or US session, buy when below 30 pips in the European or US session. Take profit only around 30 pips because this is only an indicator for daily trading. FEATURES : Sum Range, max 30 Show Rectangle
Show Level
OC SR Line Width OC SR Line Color Show Label
Custom Label Position
Custom Font Label
Custom Font Size
Custom Mark Session
Show Line Break Event Point
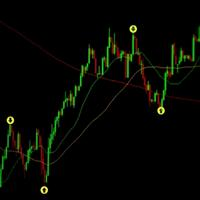
Indicator with 95% Assertiveness
Average of 2% to 3% per day of the value of your capital
Indicator that directs buy and sell entries based on bullish and bearish price targets.
Here are some settings to make it operational:
Currency pair: XAUUSD Timeframe: 15 Minutes Do not operate with news Better nighttime performance
Easy setup Full support
Schedule Take Profit to 100 pips
Entry only on the second candle
Any further queries, please get in touch. Support via WhatsApp.

Please send me Direct message on MQL5 CHAT after purchasing the Indicator for Training and Installation Support There are some additional files that is important to use with the Indicator . So be sure to contact me after purchasing the Indicator So that I can add you for training and support .
If you find any difficulty with installation then send me Direct message here So that I can connect with you via Anydesk or Teamview for the product installation. " Smart Order Block Indicator " to find

TradeMo 是一個 100% 準確的信號指標,僅響應價格行為。 因此,當 8 條線性移動平均線穿過 10 條線性移動平均線時,預期買入信號,當 8 條線性移動平均線低於 10 條線性移動平均線時,預期賣出信號。 而已! 看我在這裡解釋我是如何使用它的。
該指標會針對所有時間範圍進行調整,但我建議使用更高的時間範圍,例如 1 小時時間範圍,以最大化您的點數。 我有一種獨特的方式來解釋為什麼更高的時間框架在這裡使交易變得如此容易。
我不使用止損,但如果您必須使用,我建議您只使用 5 點止損。
指標說明: 為避免虛假信號,只有在出現信號警告框時才開始交易。 聲音通知可用。 為獲得最佳結果,我建議在 1 小時時間範圍內進行交易。 箭頭也將出現在圖表上,向下表示賣出交易,向上表示買入交易如果出現箭頭但沒有發出警報,則這是一個錯誤信號,因此可以防止重新繪製。
幾個月前,當我終於完成了這個指標的開發時,我製作了這個視頻來展示我的新指標的功能,直到今天它仍然完美運行。 在這裡使用我的課程僅 1 週後,聽聽一個完全陌生的人不得不說的話。 您可以在下面視頻的設置中關閉字幕您的語言。

Real Trade 在 1 小时以下的时间范围内进行交易。 在上升趋势和下降趋势方向上交易。 与更高的时间趋势方向交易并交易第一根蜡烛。 使用相反的比例退出或使用比率退出 1:1 或更高以及追踪止损。 在活跃时间和更高的趋势方向交易真实趋势以获得最佳结果。 在测试仪中加载指示器以研究结果和潜力。 使用顺势交易的剥头皮箭头或使用斐波那契目标或两者兼而有之。 推荐用于 5 或 15 分钟图表。
将 FIb 用于目标和止损: https://www.mql5.com/en/code/12813
Real Trade 在 1 小时以下的时间范围内进行交易。 在上升趋势和下降趋势方向上交易。 与更高的时间趋势方向交易并交易第一根蜡烛。 使用相反的比例退出或使用比率退出 1:1 或更高以及追踪止损。 在活跃时间和更高的趋势方向交易真实趋势以获得最佳结果。 在测试仪中加载指示器以研究结果和潜力。 使用顺势交易的剥头皮箭头或使用斐波那契目标或两者兼而有之。 推荐用于 5 或 15 分钟图表。
将 FIb 用于目标和止损: https://www.mql5.com/en/code/128

What is a Point of Interest? Traders who follow Smart Money Concepts may call this a Liquidity Point, or where areas of liquidity have been built up by retail traders for for Big Banks to target to create large price movements in the market. As we all know, retail traders that use outdated and unreliable methods of trading like using trendlines, support and resistance, RSI, MACD, and many others to place trades and put their stop losses at keys points in the market. The "Big Banks" know these me

用箭頭顯示價格反轉點。 適用於所有時間範圍和所有貨幣對。 適用於剝頭皮交易和長期交易。 當藍色箭頭出現時,您需要開一個買單。 當紅色箭頭出現時,您需要開賣單。 推薦時間框架 M5、M15、H1、H4。 該指標顯示 GBPUSD、XAUUSD、EURUSD、USDJPY、AUDUSD、USDCHF、EURGBP、EURJPY、EURCHF 和其他主要貨幣對的最佳結果。
該指標非常適合日內剝頭皮,因為它每天在較小的時間範圍 M5 和 M15 上顯示許多切入點。 也就是說,使用這個指標,我們可以在一天之內收到很多進場信號。
該指標的好處: 適合剝頭皮交易 在一天之內提供許多有效的入口點。 適用於所有時間範圍 適用於所有貨幣對
建議: 出現藍色箭頭時打開買單 出現紅色箭頭時打開賣單
指標設置: Averaging_Period - 指標的工作平均數。 此參數設置信號的數量和精度。 Send_Email - 發送信號到電子郵件和電話 width - 信號箭頭的大小
獎金: 購買指標 發表評論。 誠實的評論。 不一定好。 審查必須是誠實的。 獲得機器人作為禮物 https:/
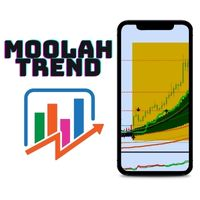
The Moolah Trend is a proven trading method that enables one trade the ranging market and the trend all on the right side of the market. The entire trading strategy is comprised of basically 5 mt4 plugins to support it. Send me a direct massage after purchase so I can forward you the bonus plugins and template file with a video for installation and how to trade the strategy.

Calculating the number of lots needed so as to make sure you are risking a specific percent of account balance can be tedious. Luckily, there are websites that make this task a lot easier. This indicator takes things to the next level as it ensures you don’t have to leave the metatrader platform to perform these calculations.
The lot-size calculator is a simple calculator that works in all forex currency pairs, BTCUSD, US500, HK50 and XTIUSD. For more free stuff: http://abctrading.xyz
FREE

VaviStar is an indicator based on trend retracements determined by ZigZag segments. It is theorized, and statistics confirm, that stocks react to certain retracement levels. Many use Fibonacci retracement levels (23.6%, 38.2%, 61.8%). It is assumed that once the price goes beyond the 61.8% retracement, we can already speak of a trend reversal. This indicator allows you to comfortably chart a segment of the ZigZag with the relative operating levels chosen. With a reversal mindset , you can use it

"Pattern 123" is an indicator-a trading system built on a popular pattern, pattern 123.
This is the moment when we expect a reversal on the older trend and enter the continuation of the small trend, its 3rd impulse.
The indicator displays signals and markings on an open chart. You can enable/disable graphical constructions in the settings.
The indicator has a built-in notification system (email, mobile terminal, standard terminal alert).
"Pattern 123" has a table that displays signals from

The indicator returning pivot point based trendlines with highlighted breakouts . Trendline caculated by pivot point and other clue are ATR, Stdev. The indicator also includes integrated alerts for trendlines breakouts and foward message to Telegram channel or group if you want. Settings · Lookback bar: Default 200 is number of bar caculate when init indicator. · Length: Pivot points period · Slope Calculation Method: Determines how this lope is calcula

X-axis lines prevail in grid manner, ruled by Average True Range. There’s an inevitable change in specific periods of time of this matter! The Average True Range (ATR) indicator is not directly based on volume. Instead, it measures volatility in price movements. It’ll stretch, expand, shrink, and evolve with 4 timely choices of grid states! MATR means “multiplying average true range” in which grandeurs the grid pip-distant levels, seeming to grasp a wave of perfectly synched parameters in ac
FREE
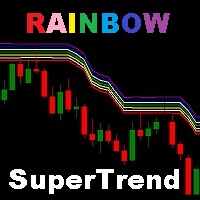
Super Trend is one of the most popular custom indicators that it doesn't provided in metatrader 4 (MT4) platform. Rainbow SuperTrend has some advantages, there are can display the trend direction and stop loss line based on Average True Range (ATR). This indicator is good to used for trailing stop trading style, because when the price direction is trending the stop loss point can adjust based on supertrend line. It is the high recommended to using this indicator combined with oscillator indicat
FREE

Double top and bottom indicator is a pattern scanning indicator which scans the tops and bottoms using zig zag pattern. When it find price bouncing back from the same point twice after a long trend then it generate arrow signals whenever the last resistance points is broken for double bottom and last support price broken for double top. Unlike other top bottom scanner it does not give only 1 signal. it alerts user when ever the last support /resistance is broker from double top/bottom pattern un
FREE
SYSTEM INTRODUCTION: The Binary Options Channels System Is Specifically Designed For Binary Options Trading. Unlike Other Systems And Indicators That Were Adopted From Other Trading Environments For Binary Options. Little Wonder Why Many Of Such Systems Fail To Make Money . Many End Up Loosing Money For Their Users. A Very Important Fact That Must Be Noted Is The Fact That Application Of Martingale Is not Required. Thus Making It Safer For Traders Usage And Profitability. A Trader Can Use Fi
SYSTEM INTRODUCTION: The Binary Options Momentum System Is Specifically Designed For Binary Options Trading. Unlike Other Systems And Indicators That Were Adopted From Other Trading Environments For Binary Options. Little Wonder Why Many Of Such Systems Fail To Make Money . Many End Up Loosing Money For Their Users. A Very Important Fact That Must Be Noted Is The Fact That Application Of Martingale Is not Required. Thus Making It Safer For Traders Usage And Profitability. A Trader Can Use Fi

The MP Andean Oscillator is used to estimate the direction and also the degree of variations of trends. It contains 3 components: Bull component, Bear component and Signal component. A rising Bull component indicates that the market is up-trending while a rising Bear component indicates the presence of down-trending market. Settings: Oscillator period: Specifies the importance of the trends degree of variations measured by the indicator. Signal line per: Moving average period of the Signal line
FREE
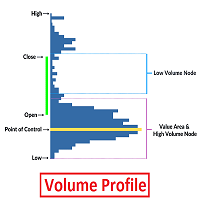
Volume Profile is an advanced charting study that displays trading activity over a specified time period at specified price levels. The study (accounting for user defined parameters such as number of rows and time period) plots a histogram on the chart meant to reveal dominant and/or significant price levels based on volume. Essentially, Volume Profile takes the total volume traded at a specific price level during the specified time period and divides the total volume into either buy volume or s

Traditional RSI is one of the most popular and must-known indicator that every traders would use. In this combination, we use two RSI period with smoothed factor to smooth the RSI lines for better results. Besides, bottom of Indicator is the Trend-filter display in different colors in order to let Traders identify the trends much easier Grey : Sideway market Light-Blue : Weak UP-Trend Blue : Strong UP-Trend Light-Red : Weak DOWN-Trend Red : Strong DOWN-Trend Signal: Blue-Arrow
FREE

MP Gradient Adaptive RSI oscillator uses AMA with the basic RSI to cover the retracements with minimum lag. Trigger line crossing the oscillator will provide an entry point for trader.
Settings: RSI period: period of the oscillator Sensitivity of the oscillator: controls the sensitivity of the oscillator to retracements, with higher values minimizing the sensitivity to retracements. RSI applied price: source input of the indicator Number of bars to draw: is used when the Fill Type option is n
FREE

QCAFE+ Trend Filters is a simple but useful for Traders to eliminate false signal from all kinds of Buy/Sell signal indicators. With QCAFE+, Traders can identify UP Trend/DOWN Trend or SIDEWAY period of Market to decide whether Enter a Trade or Not. With 5 Elements of Filters which are shown the Momentum and Strength of the Market; Each element has 3 types of arrows to show Uptrend (Blue UP arrows), Down Trend (Orange Down arrows) or Sideway (Grey Arrows). The Top Element is the main signal tha
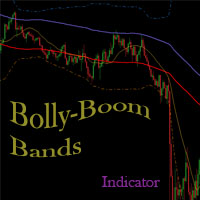
Bolly Boom Bands is an indicator which identifies when a Trend is strong and when it is not, hence it is just a lateral oscillation of the price which can push you to waste money opening inconsistent positions. It is so easy to use and similar to kind-of Bollinger Bands with Fibonacci ranges, it will be useful to find those channels where you should wait if price is inside or when these are broken to start operating into the trend area... As you can imagine it is recommended for opening position

MAD - Moving Average Distance The MAD Indicator uses ATR and the distance to a moving average to determine if price has the potential for mean reversion. Works on all time frames and pairs. It will only check for the condition at the beginning of a new candle so it doesn't repaint. A signal will include an arrow on the chart, alert popup and cell phone notification.
Settings: ATR_Multiplier: Multiplier of ATR for the calculation. (Recommended: 5)
MA_Period: Moving Average Period to use (EMA
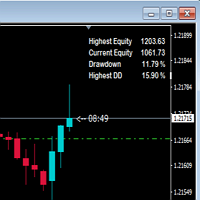
This indicator shows drawdown based on highest equity. Usually drawdown is used to show performance of a trading account especially when someone participate in a trading contest. If drawdown exceed a determined number, the contest account will be disqualified. So, I hope, this indicator will warn us in maintaining the drawdown and the account still be saved.
FREE

MMD 的鑽石
MMD 的鑽石是一種高級指標,可識別對價格行為重要的位置。 該指標 - 在任何時間範圍內 - 檢測並標記圖表上的價格反應區域。 鑽石 - MMD 方法中知識金字塔的元素之一 - 是滿足非常嚴格條件的蠟燭。 鑽石主要有兩種類型: - 標準鑽石 - 逆轉癡呆症。 這兩種型號都會自動識別並標記在圖表上。 該指標可以標記鑽石,例如從 M5 區間到 H1 區間。 該指標的默認設置在您當前打開圖表的時間範圍內顯示菱形。
指標參數說明。 使用標準鑽石 - 顯示/隱藏模型 00100 中的鑽石 使用反轉鑽石 - 顯示/隱藏模型 0010100 中的鑽石 Diamond Time Frame - 一個選項,允許您指示顯示鑽石的時間間隔。 例如,可以使用 M1 或 H1 蠟燭圖在圖表上顯示 M5 區間的鑽石。 Diamond Look Back Bars - 指定蠟燭的數量 - 在給定的時間間隔內 - 將掃描 - 以搜索滿足為鑽石選擇的參數的蠟燭。 Min Diamond Range Points - 最小鑽石大小(以點為單位)。 Max Diamond Range Points

The most crucial price level in any "Volume Profile" is the "Point of Control" . Is the price level with the highest traded volume. And mainly, is the level where the big guys start there their positions, so it's an accumulation/distribution level for smart money.
The idea of the indicator arose after the "MR Volume Profile Rectangles" indicator was made. When creating the "MR Volume Profile Rectangles" indicator, we spent a lot of time comparing the volumes with those from the volume profil

The Magic SMMA indicator is of great help in determining trend direction. It can be an excellent addition to your existing strategy or the basis of a new one. We humans can make better decisions when we see better visually. So we designed it to show a different color for rising and falling trends. Everyone can customize this in the way that suits them best. By setting the Trend Period, we can optimize it for longer or shorter trends for our strategy. It is great for all time frames.
IF YOU NE

The Magic SMA indicator is of great help in determining trend direction. It can be an excellent addition to your existing strategy or the basis of a new one. We humans can make better decisions when we see better visually. So we designed it to show a different color for rising and falling trends. Everyone can customize this in the way that suits them best. By setting the Trend Period, we can optimize it for longer or shorter trends for our strategy. It is great for all time frames.
IF YOU NEE

The Magic EMA indicator is of great help in determining trend direction. It can be an excellent addition to your existing strategy or the basis of a new one. We humans can make better decisions when we see better visually. So we designed it to show a different color for rising and falling trends. Everyone can customize this in the way that suits them best. By setting the Trend Period, we can optimize it for longer or shorter trends for our strategy. It is great for all time frames.
IF YOU NEE

The Magic LWMA indicator is of great help in determining trend direction. It can be an excellent addition to your existing strategy or the basis of a new one. We humans can make better decisions when we see better visually. So we designed it to show a different color for rising and falling trends. Everyone can customize this in the way that suits them best. By setting the Trend Period, we can optimize it for longer or shorter trends for our strategy. It is great for all time frames.
IF YOU NE
Thank you for your interest in "Goldfish Indicator". I have been trading since 2008. I usually trade on Renko chart in reversal pattern with Goldfish Indicator. If you share your vps details with me, I will connect your account (Live/Demo). To get proper results copy my trades for at least 30 days. Minimum Deposit: $1000 Leverage: 100:1 Profit Target: Monthly average profit target is 10% to 20%+/- Draw-down: The average drawdown is 10% to 20% Risk
Warning: Trading financial products on margin
FREE

Analyzing multiple time frames of a currency pair in one window can make you confused. To analyze multiple time frames, you need reliable indicators. One of them is using 9TF MACD Limited Bar . I've been working day and night to create code that is simple but reliable and covers all nine time frames in just one indicator . Attention! When first installed, the indicator does not look intact. Changing the timeframe will solve the problem. Let's look at some of the advantages of this indicator: C

Analyzing multiple time frames of a currency pair in one window can make you confused. To analyze multiple time frames, you need reliable indicators. One of them is using 9TF STOCH RSI LIMITED BAR . I've been working day and night to create code that is simple but reliable and covers all nine time frames in just one indicator . Attention! When first installed, the indicator does not look intact. Changing the timeframe will solve the problem. Let's look at some of the advantages of this indicat
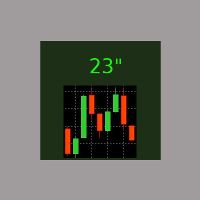
It is the simplest indicator in existence. It has only one function: report the seconds elapsed since the last minute end in a very convenient way, with a label that can be moved in the chart, so that the trader does not have to take his eye off the forming candle. It is used on M1, but also on larger intervals, for those interested in opening/closing positions at the best time. Sometimes an intense movement in the last 10" of the minute gives indications of future trend, and can be used for sc
FREE

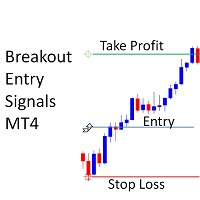
!! FLASH SALE !! Over 80% off !! For ONE week only. Now only $47 - normally $297! >>> Ends on 30 June 2023 - Don't miss it!
Buy and Sell Alerts when price breaks out following strict price action. Sends Alerts – On MT4 To Your Phone To Your Email
Does not repaint .
Works on any Forex pair, any timeframe.
10 Activations allowed so you are free from limitations >> MT5 Version Here For spreads from a tiny 0.1 pips RAW/ECN Accounts, click here . Check out my Waka Esque EA sig
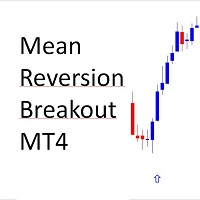
!! FLASH SALE !! Over 80% off !! For ONE week only. Now only $47 - normally $297! >>> Ends on 30 June 2023 - Don't miss it!
Buy and Sell Arrows when price breaks away from mean price. Sends Alerts – On MT4 To Your Phone To Your Email
Does not repaint .
Works on any Forex pair, any timeframe.
10 Activations allowed so you are free from limitations >> MT5 Version Here
For spreads from a tiny 0.1 pips RAW/ECN Accounts, click here . Check out my Waka Esque EA signal here: >
Track your overall trades! Monitor New Fox is an excellent indicator, which displays your current profits, being them monthly, weekly, and daily, that is, all profits obtained when you opened the mt4. Our brand new Monitor New Fox indicator is able to unlock all advanced features of MetaTrader 4. This indicator can graph with simple data key meta trader account data (Balance, Equity, Free Margin, Current Profit/Loss, Profit/Loss total, amount of open position(s) and size, etc.) and all this in a
FREE

Based on famous and useful indicator - Super Trend, we add some features to make this Indicator much easier to use and powerful. Ease to identify the trend of any chart. Suitable for both Scalping & Swing Better to use in the trending market be careful in sideway market, it might provide some fake signals Setting: ATR Multiplier ATR Period ATR Max Bars (Max 10.000) Show UP/DOWN node Nodes size Show Pull-back signals Pull-back filter ratio Period of MA1 Mode of MA1 Period of MA2 Mode of MA2 A
FREE
The Ichimoku indicator is an entire system by itself with an amazing win rate many traders feel that the chart looks like a mess when we add the indicator to the chart this is because there are too many elements present in the indicator we have a solution for that now "TT Ichimoku on off button indicator" ABOUT THIS INDICATOR This is an Ichimoku indicator that has the toggle feature separately for every element ie. Kumo cloud button, kijun button, etc... you can also hide/show the indicator

Updates
9/12/2023 - If you are looking for the Spock EA, I don't sell it anymore. DM me for more info.
24/10/2023 - Check out my other products. Starting to roll out some EAs & indicators based on this range.
Currently there is no MT5 version. I am using MT4 myself.
So I will spend my time mostly to develop more extensive stats for the Stats version and maybe even an EA. But I might develop a MT5 version.
All depends on the demand. Meaning, the more people request it, the bigger the
FREE

Dear Traders this is my another tool called " Swing Master Indicator ". As the name above the indicator is designed to help you in swing trading by capturing the low and highs of the price. You may us this tool with any trading strategy and style from scalping to position trading. It is made for level of traders including newbies and advanced traders even prop-firms, hedge funds and banks to help them make sold market analysis. I create tools for serious traders who want to make a difference in

Key Price Levels Indicator Indicator that shows the highs and lows for the significant price levels for past periods that could be potentially considered as reaction levels. The indicator displays the following price levels: Yesterday high and low The day before yesterday high and low Two days back high and low Last week high and low Last month high and low Last three month high and low (Quarter) Last year high and low
FREE

Hercules is a trend indicator which is a very powerfull tool to enter into the position at right time. it also indicates the the rangebound areas very easyly. Its visual representation is same like supertrend . But it is more advanced then super trend . If you combine the entry signal of multiple time frame it would give 98% accuracy in most of the symbols. Additional Features Notification Alerts Email Arrow for buy and sell signals Easyly accesible buffers for EA development
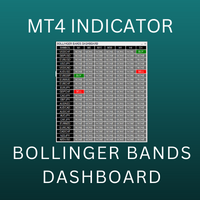
Bollinger Bands Multi Dashboard MT4 uses the value of Bollinger Bands indicator. This dashboard will monitor all symbols in the market watch. We can set up to receive an alert, notification or an email when the buy/sell signal appear on each timeframe. You can check all symbols via only 1 chart. This dashboard will check almost popular time frame (M1,M5,M15,M30,H1,H4 and D1). The colors can be customized. We can have a look at many pairs and many time frames without opening the chart. In additio
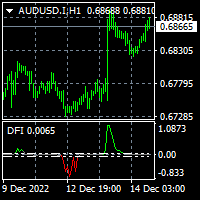
To download MT5 version please click here . - This is the exact conversion from TradingView: "Trend Direction Force Index - TDFI [wm]" By "causecelebre". - This indicator uses multiple levels of averaging to detect trend strength. - You can optimize filter low and filter high levels to achieve best results. - You have access to buffers to use in EAs. - This is a light-load processing and non-repaint indicator. - You can message in private chat for further changes you need.
Track your overall trades! Monitor New Fox is an excellent indicator, which displays your current profits, being them monthly, weekly, and daily, that is, all profits obtained when you opened the mt4. Our brand new Monitor New Fox indicator is able to unlock all advanced features of MetaTrader 4. This indicator can graph with simple data key meta trader account data (Balance, Equity, Free Margin, Current Profit/Loss, Profit/Loss total, amount of open position(s) and size, etc.) and all this in a
FREE

PLEASE LEAVE US A 5-STAR REVIEW LDS Scalper User Manual+ Extra LDS CSDIF INDICATOR + Training Videos ABOUT LDS SCALPER INDICATOR STRATEGY Built on 15+ years of trading experience. LDS Scalper is a very powerful trading indicator for scalping strategy, returns very high accuracy rate in forex, futures, cryptocurrencies, stocks and indices. This indicator displays arrow signals based on price action information with high accuracy. The LDS Scalper Indicator strategy when applied can turn a ne
This indicator will help you a lot to caculate all of your orders ( Both real current orders and pending orders) for all of your charts ( Calculation separately in each charts). And it will show you the direction of each chart (Settlement lot) that it's BUY, SELL or HEDGING with how many lot. For example, your EURUSD is 0.6 lots BUY (totally), but GBPUSD is 1.5 lots SELL (totally) and BTCUSD is HEDGING with total BUYs 0.5 lot and total SELLs 0.5 lot. (including summar

Apollo BuySell Predictor 是一个包含多个模块的专业交易系统。该指标为交易者提供价格突破区、基于斐波那契的支撑和阻力位、趋势反转线、交易量信号、回调和任何交易者每天都需要的其他有用功能。该系统将适用于任何一对。推荐的时间框架是 M30、H1、H4。尽管该指标可以与其他时间范围一起使用,但 H4 以上的时间范围除外。 该系统是通用的,因为它提供了任何交易者成功交易所需的一切。该系统可以多种方式使用。该指标可用于日内交易、波段交易甚至剥头皮交易。无论您喜欢哪种交易方式,系统都会帮助您以真实的形式看待市场。所有系统信号都不会被重绘! 您可以根据您的交易偏好和任务启用/禁用各种系统模块。系统提供所有类型的通知,包括PUSH通知。您可以打开/关闭您需要的通知。 购买后请给我发电子邮件。我将与您分享交易说明和重要的红利指标,它们将使您的交易更加有利可图!

该指标筛选每个柱的买入或卖出压力,并识别 4 种具有最高交易量的蜡烛形态。然后使用多个线性过滤器过滤这些蜡烛以显示买入或卖出信号。结合更高的时间框架方向以及在高交易量时段进行交易时,信号效果最佳。所有过滤器都是可定制的并且独立工作。单击按钮即可查看单个方向的信号。 该指标还包含最重要的价格行为和智能货币概念,可以帮助您的决策过程。 信号和交易教育集于一工具之中。
特征 : 信号不会重新绘制。 识别吞没蜡烛、拒绝蜡烛、扩展范围蜡烛和 Pinbar 蜡烛。 显示每个有效信号的多个入场点、止损和多个止盈水平。 按高容量会话进行过滤。 按支撑/阻力位和蜡烛结构过滤。 按 MACD 柱状图过滤。 ICT 买方和卖方流动性水平(亚洲突袭/伦敦突袭/犹大摇摆)。 洁净空间或间隙检测。 识别停止搜寻级别。 基于纯粹的价格行为自动绘制支撑/阻力位。 前一日高点和前日低点。 心理数字和整点、半点和四分之一点的图表水平。 显示基于动态移动平均线的价格交叉和回调。 每日开盘价。 识别 HH、HL、LL 和 LH 点。 内置蜡烛倒计时和符号传播。 内置损益信息面板。 私人导师小组访问。 包括教育、分析和支
蜡烛结束前的时间指标。显示蜡烛结束前的时间,以及服务器时间。文本可以显示蜡烛的趋势或方向,内置声音通知 特点:
显示到当前蜡烛结束的时间以及其他可以根据需要调整或禁用的时间范围 AW Candle Time 可以用 AW Super Trend 指标选择当前蜡烛或趋势的方向 趋势策略以所选颜色突出显示 更换蜡烛前的内置声音通知和额外的时间着色 显示可配置在当前价格旁边或图表任意一角,在输入设置中灵活调整 Instruction -> 这里 / 更多产品 -> 这里 输入变量:
主要的 Candle_Time_Location - 蜡烛时间戳的位置。可以位于图表的角落或当前价格旁边 Trend_Strategy - 使用彩色蜡烛时间戳。可以使用 AW SuperTrend 指标在趋势方向上着色。可以根据当前蜡烛的方向着色。或者不考虑趋势策略 Show_Server_Time - 显示或隐藏服务器时间 Current_Time_Location - 选择一个位置来显示服务器时间。可以显示在图表的角落 蜡烛时间 Show_used_trend_mode_in_thi
FREE

该算法根据指标 UPD1 Trend Direction 找到波动性降低的区域,并根据指标 UPD1 Volume Box 建立最大水平交易量。 通常,退出累积时会发生强烈的趋势运动。 如果价格已经离开积累,那么它可以测试其最大水平量(POC)。 智能警报可在设置中使用。
输入参数 。
基本设置 。 Bars Count – 指标将工作的历史柱数 。 Timeframe Flat - 选择正在搜索单位和正在构建集群的时间框架。 默认情况下,它始终是当前的。 Data Source - 报价时间范围的选择。 自动检测(最佳) 。 Vertical Step - 影响密度和垂直精度 。 Period - 选择振荡器周期 。 Start Flat After Bar - 趋势结束后忽略多少支蜡烛开始画平 。 Minimal Flat Bars - 单位内最少蜡烛数目 。 ID - 指标编号。 选择不同的标识符以多次在图表上设置指标。 例如,具有不同时期的平坦。
视觉设置 。 Cluster Width - POC/簇线厚度 。 Cluster UP / DN Color - 线
FREE

该指标用于显示平面和趋势位置。 该设计基于振荡器。 它被用作一个额外的过滤器,既用于常规图表上的交易,也用于二元期权。 平的地方用于指标 UPD1 Volume Cluster 按照智能货币的概念进行交易 。 内置的警报信号最大的超买/超卖的地方。
输入参数 。
基本设置 。 Bars Count - 指定指标将显示在其上的条数 。 Period - 选择振荡器的周期 。 Start Flat After Bar - 趋势结束后要忽略多少条才能开始平图 。
视觉设置 。 Color - 自动或手动 。 Floor Color - 如果颜色是"手动"设置的,那么您可以设置自己的颜色 。 Histo Width (0 - Auto) - 选择直方图的厚度或设置自动模式 。
Alert Settings 。 Alert - 启用/禁用通知设置 。 Alert Work Time - 指定警报将处于活动状态的时间段 。 Alert Pop Up - 启用/禁用警报弹出 。 Alert Push - 启用/禁用手机通知 。 Alert E-mail - 启用/禁用电子邮件通
FREE
该指标根据指定的系数找到一个低,高,极端的体积,并用指定的颜色绘制它们。 它取代了metatrader终端中的标准体积绘制功能。 蜡烛也可以在体积的颜色着色。 在具有极端体积的烛台上,确定最大水平体积(cluster/POC)。 根据它的位置(推动,中立,停止),集群也有自己的颜色。 如果集群在阴影中,并且蜡烛有一个极端的体积,那么我们得到一个逆转的箭头。 您可以在设置中启用警报。 此外,指示器中还有一个单独的选项,以阴影显示群集。
输入参数 。 (一些与颜色和视觉设置相关的跳过) 。
基本设置 。 Bars Count – 指标将工作的历史柱数 。 Data Source - 报价时间范围的选择。 如果您认为您认为过去的历史被截断和不完整,那么为您正在研究的仪器下载更多M1报价。 Vertical Step - 影响密度和垂直精度 。 Calc Bars - 用于体积计算的平均蜡烛数 。 Low Volume Factor - 我们固定最小音量的系数。 如果不需要,请将值设置为0 。 High Volume Factor - 我们固定大体积的系数 。 Extreme Vol
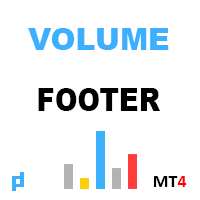
指示器显示垂直体积. 在设置中,有2个系数用于确定高和极值,1个用于确定低音量。 类似的算法也用于指示器 UDP1 Volume Pixel 。 当检测到指定的体积时,直方图以适当的颜色着色。 直方图的宽度会根据比例自动选择。 作为一项规则,价格反应的最大和最小体积。 但有必要使用确认信号。
输入参数 。
基本设置 。 Bars Count - 指标将显示在其上的蜡烛数 。 Calc Bars - 确定体积偏差的平均蜡烛数 。 Low Volume Factor - 我们定义低容量的系数 。 High Volume Factor - 我们定义大体积的系数 。 Extreme Volume Factor - 我们定义极值体积的系数 。
视觉设置 。 Histo Color - 根据蜡烛的体积和方向选择颜色来着色直方图 。 Width Histo (-1 auto) - 规则直方图的厚度 。 Width Color Histo (-1 auto) - 颜色直方图的厚度。 默认情况下,自动选择厚度。
电线杆 。 Draw Polus - 显示两极。 极点被定义为逆分形。 左
FREE

指标显示所选时间帧上的最大水平交易量。 基于指标 UPD1 Volume Box 。 线可以连接或分离。 在设置中,您可以启用智能触摸通知。 这个指标对于那些使用市场概况和智能货币概念进行交易的人来说非常有用。
输入参数 。
基本设置 。 Bars Count - 表示将在其上绘制TF POC的条数 。 Data Source - 使用蜱虫的时间范围。 Vertical Step - 影响密度和垂直精度 。 TimeFrame Period - 应用最大水平交易量的时间段 。 ID - 指标标识号。 选择不同的值以在同一图表上多次使用指标 。
视觉设置 。 Current POC - 显示出现的POC 。 Crop Line To Current Bar - 这条线不会超过最后一条 。 Link POC - 用垂直线连接POC线 。 POC Width - POC线厚度 。 POC Color ID - 所选指标ID的poc线颜色 。 Extend Line Multiplier - POC线的延续,乘数。 等于1。 该线由相同数量的条形扩展 。 Extend Line
FREE
学习如何在MetaTrader AppStore上购买EA交易,MetaTrader平台的应用程序商店。
MQL5.community支付系统支持通过PayPay、银行卡和热门付款系统进行交易。为更好的客户体验我们强烈建议您在购买前测试EA交易。
您错过了交易机会:
- 免费交易应用程序
- 8,000+信号可供复制
- 探索金融市场的经济新闻
注册
登录