Смотри обучающее видео по маркету на YouTube
Как купить торгового робота или индикатор
Запусти робота на
виртуальном хостинге
виртуальном хостинге
Протестируй индикатор/робота перед покупкой
Хочешь зарабатывать в Маркете?
Как подать продукт, чтобы его покупали
Новые технические индикаторы для MetaTrader 4

Индикатор сессий SMC — это точный инструмент, созданный для трейдеров Smart Money , которые полагаются на концепции ИКТ, охоту за ликвидностью и стратегии на основе сессий . Он плавно отображает критические торговые зоны на основе сессий, используя самые проверенные и популярные концепции, используемые трейдерами институционального уровня. Этот индикатор сессий «все в одном» накладывает на ваш график самые эффективные и высоковероятностные стратегии диапазона, включая: ICT Asian
Индикатор Теории Волн Эллиотта для Meta Trader 4 Индикатор Теории Волн Эллиотта основан на одном из профессиональных концептов на рынке Форекс. Этот индикатор рисует структуру рынка в виде волн и считает пики как восходящие и нисходящие волны от 1 до 5. Пользователь может видеть волны Эллиотта и получать уведомления о новых номерах. Индикатор содержит две волны: Основную волну и Волну-Лет, отображая большие и маленькие волны разными цветами. Пользователь также может включать или отключать каж
FREE
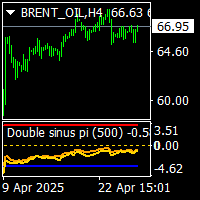
on back test use date.and not set too much back date. double sinus waves pi indicator is no repaint moving average and levels indicator. it works all timeframes and all pairs. it is combined with sinus wave and smoothed sinus wave indicator. and indexed to pi number over bought and oversell levels. it is easy to to use and suitable for experienced traders and beginners. cnt value has been set to 1000 bars.it can be increased acording to charts bar numbers. minimum cnt value mast be higher than

Индикатор стратегии прорыва сессии в Лондоне предназначен для трейдеров, которые следуют ICT (Inner Circle Trader) и концепциям Smart Money (SMC) , фокусируясь на охоте за ликвидностью на основе сессии, зонах поражения и поведении маркет-мейкеров во время лондонской сессии. Этот инструмент фиксирует самые высокие и самые низкие уровни цен между 00:00 и 07:00 по Гринвичу , которые обычно определяются как London Killzone или диапазон маркет-мейкеров . Он помогает
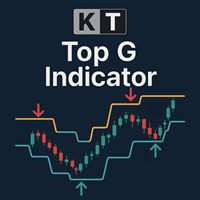
KT Top G — это индикатор, основанный на ценовом действии, который сочетает в себе умный анализ каналов для выявления потенциальных вершин и оснований рынка. Когда обнаруживается возможный разворот, он отображает четкие и крупные стрелки на графике, предупреждая вас до того, как рынок развернется. Крупные стрелки: Обозначают высоковероятные рыночные вершины и основания, выявляя истощение цены и смену импульса. Мелкие стрелки: Показывают менее вероятные точки разворота, которые часто пробиваются д
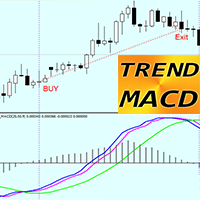
Индикатор TREND MACD для MT4 — отличный и эффективный торговый инструмент!
— Этот индикатор хорош для трейдеров, торгующих по тренду, которые нацелены на ловлю больших ценовых движений. — TREND MACD состоит из 3 линий: зеленая линия — показывает основное направление тренда, а синяя и пурпурная линии — для входа и выхода. — Индикатор позволяет максимизировать прибыль — не выходить из прибыльной сделки слишком рано. — Индикатор имеет встроенные оповещения для мобильных устройств и ПК.
КАК ИСПОЛ
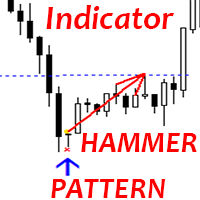
Индикатор Crypto_Forex "Молот" для MT4.
- Индикатор "Молот" - очень мощный индикатор для торговли по ценовому действию: без перерисовки, без задержки. - Индикатор обнаруживает бычьи модели Молот на графике: синяя стрелка на графике (см. изображения). - С оповещениями на ПК, мобильных устройствах и электронной почте. - Индикатор "Молот" отлично сочетается с уровнями поддержки/сопротивления.
// Отличные торговые роботы и индикаторы доступны здесь: https://www.mql5.com/en/users/def1380/seller Эт
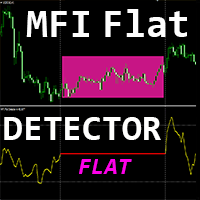
Crypto_Forex Индикатор "MFI FLAT Detector" - эффективный вспомогательный инструмент в торговле! Не перерисовывается. Предлагаю вам усовершенствовать свои методы торговли с помощью этого замечательного индикатора для MT4.
- Индикатор показывает на графике области флэта цены. Он имеет параметр "Flat Sensitivity", который отвечает за обнаружение флэта. - "MFI FLAT Detector" очень полезен для обнаружения дивергенции и отлично сочетается с Price Action. - Вы можете использовать его для систем следо

Индикатор диапазона Нью-Йорка — это инструмент анализа на основе сессии, разработанный для трейдеров, применяющих концепции ICT (Inner Circle Trader) , торговлю Smart Money и институциональные методы ценового действия . Разработанный специально для сессии Нью-Йорка, этот индикатор фиксирует ценовой диапазон между 12:00 и 14:00 по Гринвичу , критический период, который совпадает с закрытием Лондона и открытием Нью-Йорка . Он определяет максимумы и минимумы сессии ,
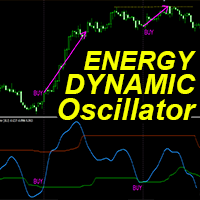
"Dynamic Energy Oscillator" - это продвинутый пользовательский индикатор Crypto_Forex - эффективный торговый инструмент для MT4!
- Новое поколение осцилляторов - см. изображения, чтобы узнать, как им пользоваться. - Dynamic Energy Oscillator имеет адаптивные зоны перепроданности/перекупленности. - Это технический индикатор импульса, который очень полезен на трендовых рынках. - Осциллятор - это вспомогательный инструмент для поиска точных точек входа из зон перепроданности/перекупленности. - Зн
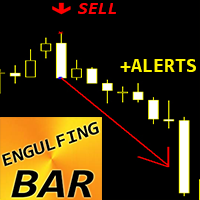
Индикатор Crypto_Forex ENGULFING Bar Pattern для MT4.
- Индикатор "ENGULFING Bar" - очень мощный индикатор для торговли по ценовому действию: без перерисовки, без задержки. - Индикатор обнаруживает паттерны поглощения на графике: - Бычий поглощение - сигнал синей стрелки на графике (см. рисунки). - Медвежий поглощение - сигнал красной стрелки на графике (см. рисунки). - С оповещениями на ПК, мобильных устройствах и электронной почте. - Индикатор "ENGULFING Bar Pattern" отлично сочетается с уро

Индикатор ICT London Open Killzone — это торговый инструмент на основе Smart Money , разработанный для трейдеров форекс, которые следуют институциональным концепциям, таким как ICT, SMC (Smart Money Concepts) и стратегиям рыночной структуры на основе ликвидности . Этот индикатор выделяет London Open Killzone, в частности, с 06:00 до 08:00 GMT , сессию, известную своей волатильностью и смещением цен из-за перекрывающихся потоков ликвидности между азиатской сессией и откры
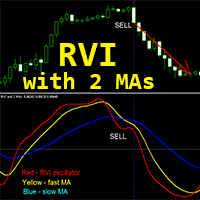
Crypto_Forex Indicator "RVI and 2 Moving Averages" для MT4, без перерисовки.
- Relative_Vigor_Index (RVI) сам по себе является техническим индикатором импульса, который очень полезен на трендовых рынках. - Индикатор "RVI and 2 Moving Averages" позволяет вам видеть быстрые и медленные скользящие средние осциллятора RVI. - Индикатор отлично подходит для торговли импульсом, особенно на больших таймфреймах: D1, H4, H1, M30. - Этот индикатор очень легко настроить с помощью параметров, его можно исп
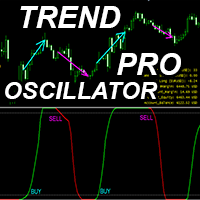
Trend Oscillator Pro - это продвинутый пользовательский индикатор Crypto_Forex, эффективный торговый инструмент!
- Используется новый продвинутый метод расчета - 20 вариантов для параметра "Цена для расчета". - Самый плавный осциллятор из когда-либо созданных. - Зеленый цвет для восходящих трендов, красный цвет для нисходящих трендов. - Значения перепроданности: ниже 5, значения перекупленности: выше 95. - С этим индикатором есть множество возможностей для модернизации даже стандартных стратег
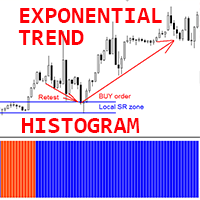
Crypto_Forex Индикатор "Экспоненциальная трендовая гистограмма" для MT4, без перерисовки.
- Индикатор экспоненциальной трендовой гистограммы очень эффективен для определения тренда. - Лучший способ его использования - это сочетание с уровнями поддержки/сопротивления и техникой повторного тестирования (см. рисунки): - Как только индикатор обнаруживает новый тренд - найдите локальный уровень поддержки и установите соответствующий отложенный ордер, ожидая повторного тестирования этой зоны. - Если
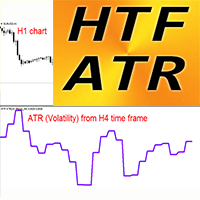
Индикатор волатильности Crypto_Forex HTF ATR для MT4.
- Средний истинный диапазон (ATR) сам по себе является одним из важнейших индикаторов - он показывает волатильность рынка. - HTF ATR - это индикатор волатильности рынка, используемый в техническом анализе. HTF означает - более высокий таймфрейм. - ATR отлично подходит для планирования динамических положений Take Profit / SL: - Например, наиболее оптимальные значения SL находятся в диапазоне значений 1,2-2,5 ATR. - Этот индикатор - полезный
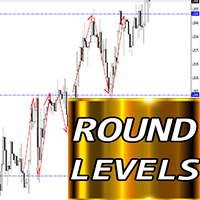
Индикатор Форекс "Круглые уровни" для MT4.
- Индикатор "Круглые уровни" - это обязательный вспомогательный индикатор для трейдеров, которые учитывают поддержку/сопротивление. - Круглые уровни очень уважаются ценой - цена очень часто отскакивает от круглых уровней. - Используйте шаг 1000 пунктов для таймфреймов H4, D1. - Используйте шаг 500 пунктов для таймфреймов H1 и более низких (для внутридневной торговли). - Также круглые уровни хороши для размещения Take Profit (перед круглым уровнем) и S

Cycle Trend Indicator для MetaTrader 4 представляет собой продвинутый технический инструмент, специально разработанный для анализа, распознавания и точного определения рыночных циклов и ключевых точек разворота в рамках тренда, будь то восходящий или нисходящий. Как четко видно на графике, индикатор элегантно интегрирует сглаженные кривые, плавно и гармонично следующие за общим движением цены, в сочетании с четкими и мгновенно узнаваемыми визуальными сигналами — красными и зелеными стрелками —
Trend Reversal Indicator для MetaTrader 4 — это профессиональный индикатор нового поколения, тщательно разработанный для точного определения точек разворота рынка без использования статических паттернов, повторяющихся моделей или устаревших жестких правил. Он основан на сложной и продвинутой алгоритмической структуре, динамически адаптирующейся к изменениям волатильности и ликвидности, обеспечивая надежные и своевременные сигналы, полностью соответствующие реальному поведению финансовых рынков

Осциллятор Trend Finder – это продвинутый технический индикатор, разработанный специально для платформы MetaTrader 4 , который предоставляет трейдерам надежный и точный инструмент для определения не только начала, но и силы, а также зрелости текущих трендов. Он основан на комплексном и глубоком анализе двух ключевых компонентов рынка: волатильности и моментума . В отличие от классических осцилляторов, которые лишь указывают на состояния перекупленности или перепроданности через фиксиро

IMPULSE HUNTER Impulse Hunter — это профессиональный динамический индикатор, разработанный для выявления ключевых ценовых импульсов во время наиболее активных торговых сессий — Азия , Лондон и Нью-Йорк . Он предоставляет трейдерам четкую визуальную структуру: зоны пробоя по сессиям , многоуровневые цели Take-Profit и адаптивные уровни Stop-Loss , индивидуально подобранные под каждую валютную пару. Присоединяйтесь к нашему каналу: чтобы получать обновления, новости и эксклюзивные релизы пер

1- The indicator operates on a one-minute frame.
2- The indicator provides buy and sell alerts.
3- Capital management and risk calculations must be adhered to.
4- One of the indicator's advantages is that it can identify the general trend over multiple time periods.
5- The indicator requires no settings...just place the indicator and wait for the signals.

GoldStrike Momentum Trend Indicator - The Ultimate Forex Trading Tool Description: Introducing the GoldStrike Momentum Trend Indicator , a powerful and intuitive tool designed for traders seeking precision in their Forex strategies. Using a combination of momentum analysis and the RSI (Relative Strength Index) , this indicator provides buy and sell signals that help you identify optimal entry and exit points, improving your trading decisions. Perfect For: Day traders who need quick, precise sign

Индикатор подтверждения отката определяет точки разворота с высокой вероятностью, используя модели отклонения цены (пин-бары). Основные особенности:
- Работает на всех таймфреймах (оптимизирован для 5/30 минут) - Четкие визуальные сигналы со стрелками и текстовыми метками - Встроенные рекомендации по управлению рисками - Лучшие результаты по Gold/XAUUSD и EURUSD
Стратегия торговли: 5-минутные графики: - Идеально для скальпинга 10-20 пунктов (EURUSD) - Для золота требуются более широкие стопы
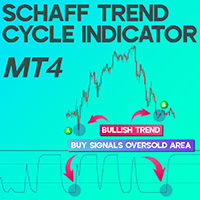
Schaff Trend Cycle Indicator for MetaTrader4 The Schaff Trend Cycle Indicator for MetaTrader4 merges the core functionalities of two widely used indicators—MACD (Moving Average Convergence Divergence) and the Stochastic Oscillator. This tool is engineered to identify trend reversals and momentum extremes with enhanced sensitivity. Readings below 25 often signal an oversold market, while values above 75 highlight overbought conditions. This makes the STC highly reliable for early trend recognitio
FREE
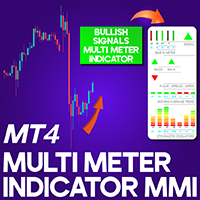
Multi Meter Indicator (MMI) for MetaTrader 4
The Multi Meter Indicator (MMI) on the MetaTrader 4 (MT4) platform is an advanced visual tool that integrates nine technical indicators into one compact panel, including a 14-period Moving Average displayed in the upper right corner. With MMI, traders can evaluate market momentum and buyer-seller dynamics with a consolidated data view on their charts. «Indicator Installation & User Guide»
MT4 Indicator Installation | Multi Meter Indicator MMI MT5
FREE
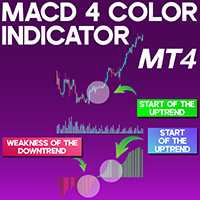
MACD 4 Color Indicator for MetaTrader 4
The MACD 4 Color Indicator for MetaTrader 4 (MACD 4C) is a refined upgrade of the traditional MACD, designed to not only indicate trend direction but also visualize the strength of the trend using four distinct color codes. These color variations are derived from the gradient of the moving average lines. It is particularly effective for identifying when a trend begins or starts to fade. The tool also incorporates divergence and convergence principles, mak
FREE
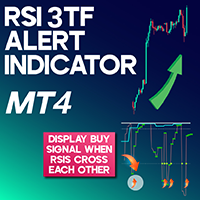
RSI 3TF Alert Indicator for MetaTrader 4 The RSI 3TF Alert Indicator for MetaTrader 4 (MT4) is designed around the RSI indicator utilizing a 2-period configuration. The RSI 3TFA integrates 3 distinct RSI indicators into a single chart view, making market analysis more streamlined for traders. When all 3 RSI indicators move above the 50 threshold, the RSI 3TFA generates a buy signal, and conversely, when they cross below the 50 level, it issues a sell signal. The yellow dots (blue in default conf
FREE
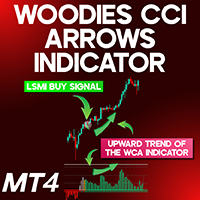
Woodies CCI Arrows Indicator for MetaTrader 4
The Woodies CCI Arrows Indicator for MetaTrader 4 (WCA) is a momentum-based tool that relies on a 14-period Commodity Channel Index (CCI) within the MT4 platform. This custom indicator blends multiple components, including the standard CCI and the Least Squares Moving Average (LSMA). When the CCI maintains an upward slope for six consecutive candles, the indicator highlights this in green. Conversely, a sustained downtrend for six bars is marked in
FREE
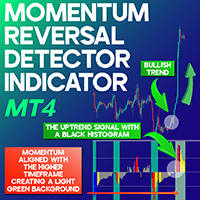
Momentum Reversal Detector Indicator for MetaTrader 4 The Momentum Reversal Detector Indicator for MetaTrader 4 is designed to detect potential trend reversals by evaluating price momentum shifts. It utilizes a black histogram to monitor momentum changes and highlights possible entry and exit points at critical turning zones. When the indicator detects positive momentum on a higher timeframe, the background color shifts to light green. It also marks Up Divergence (purple) at the exhaustion of up
FREE
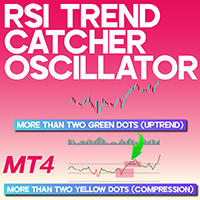
RSI Trend Catcher Oscillator for MetaTrader 4 The RSI Trend Catcher Oscillator for MetaTrader 4 is a customized MT4 indicator that works based on principles similar to the classic RSI. It detects overbought and oversold conditions and provides optimal entry and exit points. The RSI Trend Catcher uses three distinct colors to visualize trends: green for bullish movements, red for bearish trends, and yellow for neutral phases. Its design integrates Bollinger Bands to enhance signal generation accu
FREE
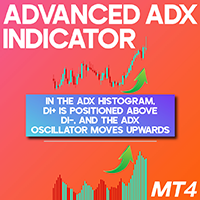
Advanced ADX Indicator for MetaTrader 4 The Advanced ADX Indicator for MetaTrader 4 (MT4) is designed to gauge the intensity of prevailing price movements in the market. This tool visualizes the strength of the trend using a histogram that spans from 0 to 100, using green bars to indicate bullish strength and red bars for bearish momentum. A taller histogram bar reflects a more dominant trend. The oscillator typically uses a 13-period setting as its default configuration. «Indicator Installation
FREE

Welcome to the free Combiner Professional Bull Vs Bear Binary Options and Forex Indicator project, with the most powerful free AI on the market for MT4, with 16 strategies, 27 filters, support for 10 external indicators and 16 external Bots, designed to operate in the Forex market and Binary Options.
Combiner Indicator Combiner EA Forex
Download https://t.me/bullvsbearcombiner
FREE
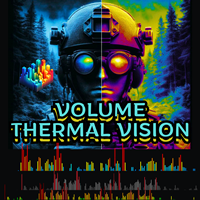
Volume Thermal Vision - Advanced Volume Analysis for MetaTrader 4 Unlock the power of volume analysis with Volume Thermal Vision, a sophisticated indicator designed to enhance your trading decisions. Developed by Jean Roso, this tool provides a dynamic visualization of volume intensity through a customizable heatmap, empowering traders to identify market trends and potential reversals with precision. Key Features: Multi-Protocol Visualization: Choose from five distinct protocols—Tactical, Steal
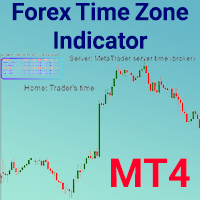
Forex Time Zone Indicator for MetaTrader 4 The Forex Time Zone Indicator for MetaTrader 4 is a fundamental resource for traders working in the global currency markets. No matter the trading methodology—scalping, intraday, or day trading—knowing when specific financial centers are active can significantly enhance trade timing and execution. As liquidity and trading volume flow across regions such as Asia, Europe, and North America, monitoring the timing of market activity becomes vital for capita
FREE
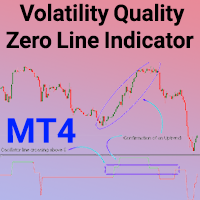
Volatility Quality Zero Line Indicator (VQZL) for Meta Trader 4 The Volatility Quality Zero Line (VQZL) Indicator is designed to evaluate market direction by utilizing moving average calculations alongside ATR (Average True Range) to measure price volatility. Displayed as an oscillator within the Meta Trader 4 terminal, it offers visual signals through two colors: green, signaling bullish momentum, and red, indicating bearish momentum. A trend confirmation occurs once the oscillator crosses the
FREE

Candle Pattern Finder
Candle Pattern Finder is a powerful MT4 indicator designed to help traders easily detect key candlestick patterns in real-time. Whether you're trading trends, reversals, or consolidations, this tool highlights important price action signals directly on the chart — helping you make faster and more confident trading decisions. Detects popular candlestick patterns: Bullish/Bearish Engulfing Hammer & Inverted Hammer Shooting Star & Hanging Man Three White Soldiers Three Black
FREE
Индикатор "Время до закрытия свечи" (TimeToBarEnd)
Этот технический индикатор предназначен для точного отслеживания времени до закрытия текущей свечи на графике. Он отображает обратный отсчет в формате минуты:секунды, что особенно полезно для внутридневных трейдеров и скальперов, которым важно знать точное время закрытия текущей свечи. Индикатор обновляется в режиме реального времени и позволяет гибко настроить его внешний вид. В настройках доступны: выбор расположения из четырех углов графика,
FREE

Индикатор нейтральной свечи — это инструмент технического анализа, который автоматически определяет зоны нейтральных свечей (neutral candlestick), появляющихся на ценовом графике. Эти зоны, как правило, указывают на неопределённость среди участников рынка и помогают заранее определить возможное направление дальнейшего движения цены. Основные функции: Определяет зоны, где появляются нейтральные свечи. Показывает вероятность движения цены вверх или вниз от этих зон. Помогает трейдеру более точн
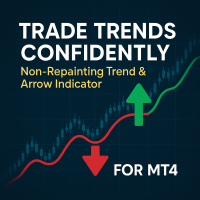
Trade Trends Confidently with the Non-Repainting Trend & Arrow Indicator for MT4! Stop missing profitable moves! This powerful indicator helps you: Clearly See the Trend: Easy-to-follow Green/Red lines instantly show you the current market direction (Uptrend/Downtrend). Get Reliable Entry Signals: Accurate Buy/Sell arrows appear precisely when the trend potentially changes. Crucially, these signals are NON-REPAINTING – they appear on bar close and never change afterwards, giving you dependable s
WeisWaveScouter is a powerful and accurate indicator designed to help traders detect key market movements based on price and volume waves. Built for the MetaTrader 4 platform, WeisWaveScouter provides detailed analysis of bullish and bearish waves, as well as highlighting volume spikes, giving you a clear view of market conditions.
Key Features: Bullish and Bearish Waves: Easily identify bullish and bearish movements with waves clearly differentiated by customizable colors.
Volume Spikes: Det
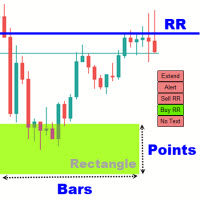
Rectangle Trading Custom is a powerful technical analysis tool designed for price action and range-based traders. It allows users to define consolidation zones and receive alerts when the price breaks out of these zones or approaches trendlines drawn on the chart. Rectangles and Trendlines will be extended into future with one click. Rectangle point size, name and prices will be displayed around rectangle. Key Features: Draw Trading Zones (Rectangle Zones)
Users can manually draw rectangles t

Удобный дешборд для стратегии торговли по пересечениям скользящих средних. На панели числами отображается сколько свечей назад был сигнал. Цифра 0 означает сигнал на текущей свече(является нулевой свечой, может пропадать, если пересечение не происходит). Цифра 1 означает, что сигнал был на предыдущей свече(стрелки не пропадают, так как скользящие закрепились). По желанию можно добавить скользящие средние, но индикатор работает и без них. Преимущества индикатора:
Автоматические сигналы — стр
Semnale M1 - H1
Bine ați venit pe pagina noastră!
Semnalele M1 - H1 sunt un super indicator pentru MetaTrader 4, pentru o tranzacționare confortabilă și profitabilă.
Este un indicator sofisticat și precis conceput pentru comercianții activi de pe piețele financiare.
Este ușor de utilizat, ceea ce îl face un instrument esențial pentru comercianții de toate nivelurile de experiență.
Acest indicator are un potențial foarte bun.
Detectează inversările, astfel încât obțineți un rezultat aproap
Pair Trading Strategy Based on Spearman Correlation and Stationary Z-Score : A Revolutionary Trading Indicator for Precision and Profit Pair Trading Strategy Based on Spearman Correlation and Stationary Z-Score is a cutting-edge MetaTrader 4 (MT4) indicator designed to empower traders with advanced pairs trading strategies. Built with precision, this tool leverages Spearman Rank Correlation, Z-Score analysis, and stationarity testing to uncover profitable trading opportunities in correlated cur
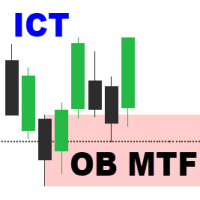
Order Block Multi Timeframe The Order Block Multi Timeframe is a powerful tool for Smart Money Concept (SMC) traders, combining high-accuracy Order Block detection with real-time Break of Structure (BOS) and Change of Character (CHoCH) analysis across multiple timeframes. Smart Money Insight, Multi-Timeframe Precision This indicator automatically identifies institutional Order Blocks —key price zones where large players have entered the market—and plots them directly on your ch

CHoCH & EQH/EQL: Market Structure and Liquidity Zones Indicator Overview: This versatile indicator is designed to help traders identify potential shifts in market structure and pinpoint key liquidity zones directly on their MetaTrader 5 charts. It automatically detects and visualizes two crucial price action concepts: Change of Character (CHoCH) for potential reversals, and Equal Highs/Lows (EQH/EQL) for significant support/resistance levels. Key Features: Change of Character (CHoCH) Detection:

Pairs Trading Dashboard - Spearman Correlation and Stationary Z-Score : Your Ultimate Trading Dashboard for Precision Pairs Trading Pairs Trading Dashboard - Spearman Correlation and Stationary Z-Score is a state-of-the-art MetaTrader 4 (MT4) dashboard indicator crafted to revolutionize pairs trading. This powerful tool combines Spearman Rank Correlation, Z-Score analysis, and stationarity testing into an intuitive dashboard, empowering traders to identify and act on high-probability trading opp

The indicator defines the buy and sell arrows with high performance and consistent results. Automatic analysis of market opportunities ; Help traders earn more from their investments;
Never repaints, recalculates or backpaints signals; This is FREE demo version of the indicator and works only on "EUR USD M5". ProTrading Arrow - All details about the indicator here : Works in all symbols and TF + free EA and Multi Currency Scanner + SPECIAL BONUS .
FREE
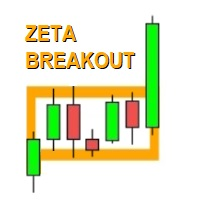
The Zeta Breakout Indicator MT4 is a powerful trading breakout strategy custom indicator. It can help traders determine the level of breakout (support and resistance levels) simple, easily and accurately. Zeta Breakout Indicator MT4 is a custom indicator that created by MQL4 programming language that based on the results of our breakout trading strategy research. It uses a proven strategy with excellent result, good win rate, good risk to reward ratio and few false break out. You can proof how
RD Range System V2 About the indicator You have price range limit (red lines) that is calculated based on previous range. You have signal (yellow star) that indicates the end of swing. When price hits the price range upper or lower limit and generates swing end signal (yellow star) then you trade for reversal. Now there are rules, you can't just simply trade, read the manual i have attached in the comments. Note that, Indicator works with all pairs and with every timeframe. While testing in st
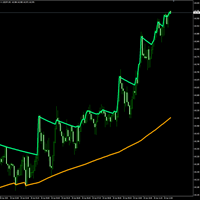
Dynamic Structural High/Low Indicator for MetaTrader This advanced MetaTrader indicator dynamically tracks price movements and plots key structural highs and lows in real-time, offering traders a clear visual representation of market structure. By identifying crucial support and resistance levels, the indicator helps traders make informed decisions across various trading styles—from scalping fast breakouts to swing trading pullbacks . Key Features: Adaptive Structural Levels: Automatical
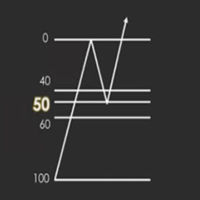
Automated Fibonacci Levels Indicator for MetaTrader Smart, Dynamic Fibonacci Retracements – Automatically Applied to Any Candle! This powerful MetaTrader indicator instantly plots Fibonacci retracement levels (38.2%, 50%, 61.8%) from a user-selected candle , saving you time while enhancing precision. Whether you trade breakouts, pullbacks, or reversals , it adapts to your strategy by letting you choose: Timeframe (M1 to MN) Candle Index (0 = current candle, 1 = previous, etc.) Wh

The Neural Adaptive MACD is a customized MACD indicator for MT4 that visually represents momentum strength using four color-coded histogram bars: strong bullish, bullish, strong bearish, and bearish.
It features neural adaptive signal smoothing and integrates optional real-time alerts, notifying traders of new momentum shifts along with the symbol and timeframe.
This tool enhances decision-making by highlighting trend strength and change dynamics.
Can be used any forex, crypto....
Any timefr

Simple. Informative. Instantly Visible on Your Chart. Alwinson Active Trades Info (MT4 Version) is a lightweight custom indicator that displays a real-time summary of your currently open trades —right on your chart. No more switching tabs just to see what pairs are active and how much lot size is in play.
Alwinson Active Trades Info is also available for the MetaTrader 5 (MT5) version .
Key Features: Displays a list of all symbols with open positions in your trading account. Shows th
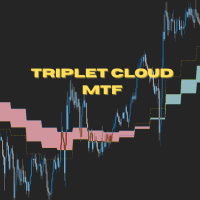
Triplet Cloud MTF is an indicator for trend-following strategy. It presents the trend in HTF from the LTF Chart that allows traders focus on looking for trade entry in the right direction and increase striking rate. It comes with simple input setup. You will only need to choose HTF you want to follow its trend and set the alert setup, then all is set. Here are the mostly selected HTF setup for each of entry timeframe: M1 Entry : M15 Trend M5 Entry : H1 Trend M15 Entry : H4 Trend H1 Entry : D1 Tr

M5 EURUSD Only Scalper Please note this It works with all FOREX pairs but i have a lot of experience in trading this strategy with EURUSD only, so it is very well tested with EURUSD pair. NO XAUUSD or Crypto should be traded with this strategy. Go through the manual i have attached in the comments, without the manual this indicator is just a structure-based indicator and some white boxes you would not understand. After making the purchase, I will help you setup the exact framework I use to util
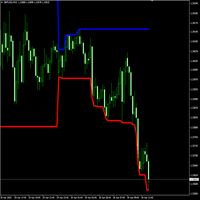
Zero-Based High/Low Indicator for MetaTrader Track Price Expansion from a Custom Starting Point! This innovative MetaTrader indicator dynamically plots high and low levels starting from zero (your chosen reference point) based on the selected timeframe . Whether you're analyzing intraday breakouts or long-term trends , this tool adapts to your preferred chart period, giving you a clear view of price expansion from any starting moment. Key Features: Multi-Timeframe Fle

Pairs Trading Z-Score Optimized Pairs Trading Z-Score Optimized is a sophisticated MetaTrader 4 (MT4) indicator designed to revolutionize pairs trading with a focus on precision and profitability. This indicator combines advanced Z-Score analysis, stationarity testing, and a visually intuitive subwindow dashboard to help traders identify high-probability trading opportunities in correlated currency pairs. Whether you’re a seasoned forex trader or a newcomer, this tool offers a seamless blend of
One of the advantages of the Arrow Tracker indicator is its vivid visual representation: Histogram Display: Situated beneath the main price chart, the indicator showcases a histogram. This allows for easy identification of market trends. Color-Coded Bars: Uptrends are demarcated with blue bars, whereas downtrends are depicted with pink bars. This differentiation assists traders in swiftly gauging the market’s directional momentum. Signalling Peaks and Bottoms: The histogram employs yellow

Fibo Bollinger Indicator – MT4 Version Indicator Overview Fibo Bollinger is an advanced technical indicator that combines the dynamic behavior of Bollinger Bands with the power of Fibonacci ratios.
It is specially designed for traders who seek more precise support and resistance zones based on volatility and historical price behavior. Main Features Draws 6 Upper Bands and 6 Lower Bands based on Fibonacci levels. Provides a more detailed view of price volatility compared to traditional B

Indicator using Zero Length Moving Average and Smooth Heiken Ashi counting (non visual) to help looking the trend is bullish or bearish. Have been tried on XAU/USD pairs and showing when to enter market, BUY or SELL. Have option to showing Arrow if it is good to BUY or to SELL Also have option to give Alert.
Please do not consider this as 100% correct signal. This is just a tool to help trade.
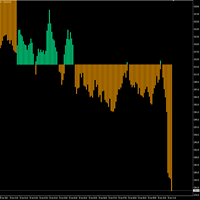
Overview This MetaTrader Histogram Indicator transforms the main candlestick chart into a clean, easy-to-read histogram , using the selected timeframe's opening price (Open) as the zero line . This unique visualization helps traders quickly assess the current price direction without the noise and potential manipulation effects caused by traditional candlestick patterns. Key Features: Histogram Format – Converts price action into bars above/below the zero line for instant trend
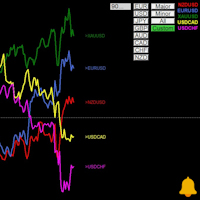
Multi Symbol RSI with alert indicator gives you overall overview of all symbols at once allowing you to compare, and contrast market for broader and simultaneous analysis of various assets at once. You can select categorized pairs from Major, Minors, All or from specific currency like all EUR pairs, USD pairs etc, You can even add your own custom list of symbols is case you want to monitor specific symbols . All of this can be done from the user friendly chart buttons.
Indicator helps in vari

How TrendMaster Works
TrendMaster is a cutting-edge trading indicator designed to simplify and elevate your trading experience. Using advanced algorithms, it analyzes thousands of historical price points on your chart to generate a dynamic predictive line. When the price moves above this line, a "BUY" signal appears on your chart. Similarly, when the price dips below the line, a "SELL" signal is displayed. It’s straightforward, intuitive, and eliminates guesswork – empowering you to trade with

Этот индикатор отображает канал Relative Strength Index. Когда вы видите, что цена касается красной линии и много раз от нее отступает, то вы будете знать, что общий тренд - нисходящий. Когда она отступает от синей линии много раз, это означает, что общий тренд - восходящий. Эти линии выражают значения RSI, относящиеся к значениям цены на основном графике. Вы можете добавить этот индикатор в свою стратегию, он вам поможет. У вас будет шанс войти на рынок, когда цена коснется линий, но это не сил
FREE

Вы внутридневной трейдер? Свинг-трейдер? Этот индикатор подходит для свинговой торговли на старших таймфреймах: H1, H4 и D1. Одной из наиболее важных особенностей индикатора является то, что он не перерисовывает свои сигналы
Содержание Индикатор очень прост в применении: Всего одна синяя и одна красная линии в качестве канала. Фиолетовая центральная линия, в качестве целевой линии. Трендовые линии, меняющие цвет при изменении тренда.
Использование в торговле При продаже ждать достижения ценой
FREE

This indicator will detect harmonic patterns that are drawn on the chart by manual and automatic methods. You can see user manual from this link: https://www.mql5.com/en/blogs/post/719257 There is a free version (it detect only Gartley and Nenstar Patterns) to try this product. You can buy the full MT4 version from: https://www.mql5.com/en/market/product/104689
Notes When you use this indicator and change the settings, add indicators like Moving Average or Bollinger Bands, this indicator will s
FREE

MACD — один из самых популярных индикаторов моментума и тренда. Измеритель силы валюты также является индикатором тренда, основанным на нескольких валютах. Измеритель силы валюты MACD — это индикатор с одним графиком, который имеет алгоритм MACD и измерителя силы валюты. Он также имеет функцию одним щелчком мыши, в которой 28 основных и второстепенных пар отображаются на вашей панели инструментов. При нажатии на определенную пару ваша диаграмма автоматически изменится на диаграмму по вашему выб

ON Trade Индикатор свечного паттерна Марубозу Паттерн Марубозу — мощный и прямолинейный свечной паттерн, который может предоставить ценную информацию о настроениях рынка и потенциальных разворотах тренда. Он характеризуется свечой с очень маленькой или отсутствующей тенью (килец) на одном конце и длинным телом, простирающимся в направлении текущего тренда. Этот паттерн указывает на сильный дисбаланс между покупателями и продавцами, что подразумевает, что движение на рынке сильно одностороннее. О
FREE
123456789101112131415161718192021222324252627282930313233343536373839404142434445464748495051525354555657585960616263646566676869707172737475767778798081828384858687888990919293949596979899100101102103104105106107108109110111112113114115116117118119120121122123124125126127128129130131132133134135136137138139140141142143144145146147148149
MetaTrader Маркет - торговые роботы и технические индикаторы для трейдеров, доступные прямо в терминале.
Платежная система MQL5.community разработана для сервисов платформы MetaTrader и автоматически доступна всем зарегистрированным пользователям сайта MQL5.com. Ввод и вывод денежных средств возможен с помощью WebMoney, PayPal и банковских карт.
Вы упускаете торговые возможности:
- Бесплатные приложения для трейдинга
- 8 000+ сигналов для копирования
- Экономические новости для анализа финансовых рынков
Регистрация
Вход
Если у вас нет учетной записи, зарегистрируйтесь
Для авторизации и пользования сайтом MQL5.com необходимо разрешить использование файлов Сookie.
Пожалуйста, включите в вашем браузере данную настройку, иначе вы не сможете авторизоваться.