适用于MetaTrader 4的新技术指标 - 48
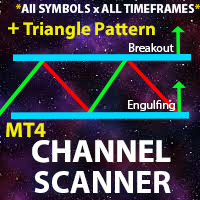
** All Symbols x All Timeframes scan just by pressing scanner button ** *** Contact me to send you instruction and add you in "Channel Scanner group" for sharing or seeing experiences with other users. Introduction: The Channel pattern is described as the area located between two trend lines. This area is used for a measure of a trading range. In this case, the upper trend line connects price highs while the lower trend line connects price lows. Also when it comes to breakout points, it helps t

MA Revolution is upgraded version of standard Moving A verage. With the current upgrade moving average line got more sensitive with different market conditions. It gets more flexible by decreasing default period step by step while market is sharp and incrasing period back to default period step by step while market is normal again. testing of the ide a shows th at this upgr aded version gives much more acur acy for detecting m arket direction, ch anges in direction are shown much e arly th an
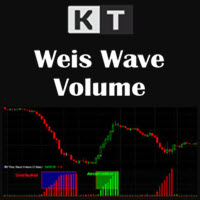
The KT Weis Wave Volume is a technical indicator based on the current market trend and description of the price movement's direction. The indicator is based on volume and displays the cumulative volumes for price increases and decreases in the price chart.
In addition, the indicator window shows a histogram of green and rising red waves.
The green color represents upward movement; the more the price rises, the larger the green volume. The red color represents a decreasing wave; the larger the

NOTE: PRICE WILL RISE VERY SOON. DON'T SKIP THIS OFFER! Dear traders I am glad to introduce the " Market Swing Scanner Board" indicator to you. This indicator was made mainly to be used in combination with the Market Swing Index Indicator. You use the "Market Swing Scanner Board" indicator to scan for trading opportunities on the Market Swing Index Indicator . This tool is designed for serious traders who have decided to make a difference through trading. Be the next person to witness this st

KT Trend Exhaustion is our personal implementation of the famous Trend Exhaustion Index developed by Clifford L. Creel, Ph.D., in 1991.
The change in price direction often comes with uncertainty. TEI helps to tackle the uncertainty by showing a crisp direction using the smoothed color-changing index.
Features
Easy to use and interpret. It comes with a multi-timeframe scanner that scans the upcoming signals across all the time-frames. It can be used as an entry signal or trend confirmation. Al

KT Know Sure thing is a momentum oscillator based on the smoothed rate of change over four different timescales and was developed by Martin Pring. In 1992, Pring published the initial description of the indicator in Stocks & Commodities magazine's "Summed Rate of Change (KST)" article. KST creates a momentum oscillator by combining the price momentum measurements from four different price cycles. Traders can utilize KST to search for bullish or bearish divergences, signal line crossovers, and ce

KT Forex Line can be described as an improved version of the moving average indicator. The indicator is embedded in the main trading chart and features a line that switches between blue and white depending on the prevailing direction or mood of the market.
Utilizing the indicator is simple. You do not need to understand complex graphs and intricate lines. Recognize the indicator line's color and trade accordingly.
Key Features
The indicator has customizable colors, with the blue and red being

The KT Market Speed is a unique and straightforward oscillator-based technical analysis tool that helps traders visualize the speed at which the price of an instrument changes based on the preset length. The Market Speed representation helps correctly map the price momentum: is it moving fast, slowing down, or trapped in a range? These are the questions the indicator answers, giving traders more bandwidth to execute better-informed trade positions.
Formula
It's a simple technical analysis tool

KT Forex Super Scalper is created to identify market trends and plot trade signals based on the direction of the predetermined trend. It functions very similarly to moving averages but reacts quickly to changes in price actions and can signal right away once a valid trend is confirmed. The quick reactionary feature makes it a valuable tool for scalpers. However, anyone familiar with moving averages can use it for actual trading because of its signaling process and chart demonstration simplicity

The double top bottom pattern is arguably one of the technical analysis's most popular chart patterns. These patterns are used to capitalize on recurring patterns and identify trend reversal patterns, thereby creating well-placed entry and exit levels. The KT Double Top Bottom is based on these patterns and fine-tunes the trade signal development process for traders.
Features
It's based on one of the most reliable trading patterns and brings some fine-tuning and automation to the process. Also
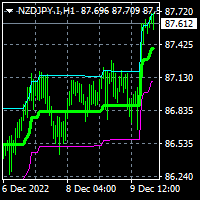
To dowload MT5 version please click here . This is the exact conversion from TradingView: "Range Filter 5min" By "guikroth". - This indicator implements Alerts as well as the visualizations. - Unlike the MT5 version it does not support HeikenAshi and candle colors. - This indicator lets you read the buffers for all data on the window. For details on buffers please message me. - This is a non-repaint and light processing load indicator. - You can message in private chat for further changes you ne

** All Symbols x All Timeframes scan just by pressing scanner button ** *** Contact me to send you instruction and add you in "Market Structure group" for sharing or seeing experiences with other users. Introduction: Market structure is important for both new and professional traders since it can influence the liquidity and price action of a market (Breakout and Retest). It’s also one of the most commonly used techniques to understand trends, identify potential reversal points, and get a feel f

在一个窗口中分析货币对的多个时间范围可能会让您感到困惑。
要分析多个时间范围,您需要可靠的指标。
其中之一是使用 9TF STOCH RSI。
我夜以继日地工作,以创建简单但可靠的代码,并在一个指标中涵盖所有九个时间范围。
让我们看一下该指标的一些优点:
彩色直方图。 每个时间范围内的曲线颜色各不相同。 指示 STOCHASTIC 主线和信号线交叉的箭头。 (注意:忽略出现的最后一个箭头!) OBOS水平线。 实时 9TF 仪表板监视器。 9TF 仪表板监视器计算非常准确,即使您从一个时间范围更改为另一个时间范围也是如此。 监控哪条曲线高于超买水平,哪条曲线低于超卖水平。 监测主 STOCH 是否高于信号 STOCH 的曲线,反之亦然。 监控主 STOCH 和信号 STOCH 之间是否有交叉的曲线。 监视当前信号与先前信号的移动。 在上升或下降的过程中。 (注意:这是剥头皮非常重要的功能!) 监测 RSI 线的运动。 一个非常重要的趋势栏功能,用于发现长期趋势。 改变颜色的能力。 能够选择要显示的曲线。 能够选择要显示的直方图。 能够选择显示哪个箭头。 能够将 9TF 仪表
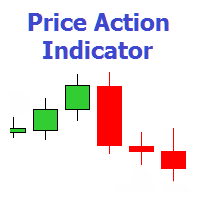
The indicator shows 7 patterns of the Price Action trading system, as well as the maximum and minimum price lines for the day. Timeframe: H1, H4, D1. Pin bar Outside Vertical Bar (OVB) Pivot Point Reversal (PPR) Closing Price Reversal (CPR) Double Extremums ( DMax/DMin ) Wide Range Bar (WRB) Inside Bar (IB) Settings PRICE ACTION PATTERNS Show Pin Bar Color Pin Bar - pointer arrow color. Show Outside Vertical Bar (OVB) Color Outside Vertical Bar - poin
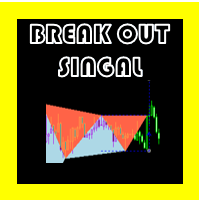
中断信号 OSW
(元交易者 4)
您想打破高潮和低谷吗? 这是从这些类型的条目中获取信号的完美指标。
一旦指标启动,它不会向您显示任何信号,但随着价格上涨,它会读取市场,直到找到完美的突破形态。
读取高点和低点的指标具有 Zig Zag 的特殊配置,允许只采用最合适的。
与任何指标一样,它不会给出完美的条目,但它给出的许多结果都是赢家,并且伴随着良好的技术分析,它们给出了非常好的结果。
看涨条目为蓝色,看跌条目为红色,每个条目都有一个建议的止损和止盈,缓冲区完美设置为可读取,并且能够打开和关闭信号警报。 中断信号 OSW
(元交易者 4)
您想打破高潮和低谷吗? 这是从这些类型的条目中获取信号的完美指标。
一旦指标启动,它不会向您显示任何信号,但随着价格上涨,它会读取市场,直到找到完美的突破形态。
读取高点和低点的指标具有 Zig Zag 的特殊配置,允许只采用最合适的。
与任何指标一样,它不会给出完美的条目,但它给出的许多结果都是赢家,并且伴随着良好的技术分析,它们给出了非常好的结果。
看涨条目为蓝色,看跌条目为红色,每个条目都有一个建议的止损和止盈,缓冲
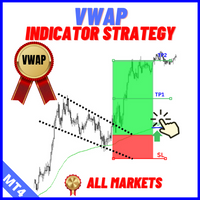
Description: For a comprehensive understanding of our indicators, we invite you to explore the entire Q&A section within this MQL5 blog post here . The "VWAP Indicator Strategy" is a cutting-edge technical analysis tool designed to provide traders with a competitive advantage in the financial markets. By incorporating the Volume Weighted Average Price (VWAP) indicator, this tool offers valuable insights into market trends, price levels, and potential turning points. Understanding the VWAP Ind
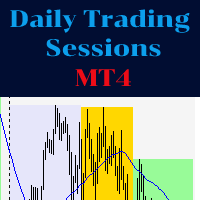
The indicator represents the session boxes for the Asian, European and American sessions. It is possible to change the time of each session, such as color. It is also possible to disable the display of each session. You will find in input parameters variables to modify time sessions in format hh:mm and the color of boxes of each sessions. If you need some implementations please contact me.
FREE
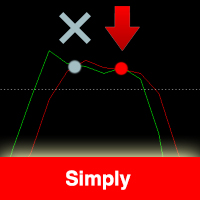
The indicator is based on the Stochastic indicator. I also recommend to see my EA Night Zen Strategy: It contains a strategy for crossing the K and D lines in the overbought (for sales) and oversold (for purchases) zones. The indicator gives a signal at the second intersection.
The signals are not rewritten, they appear after confirming the intersection of the K and D lines.
Settings: Stochastic Indicator Settings Indicator period Notification and Alert Settings
FREE

Indicator for fast navigation through financial instruments. When you click on the button, you go to the chart of the financial instrument, the name of which was written on the button. In other words, the indicator opens or unfolds an existing chart window. For each chart, you can customize the name of the financial instrument, text color and background color; in total, you can customize symbols buttons that you trade often. The indicator can be installed on any charts for which you need to swit
FREE

轴心点指标(Poivt)
经典模式指标计算公式(ClassicMode): pp=(High+Low+Close)/3.0
s1=2*pp-High
s2=pp-(High-Low)
s3=Low-2*(High-pp)
r1=2*pp-Low
r2=pp+(High-Low)
r3=High+2*(pp-Low)
伍迪模式指标计算公式(WoodieMode):
pp=(High+Low+2*Close)/4.0
s1=2*pp-High
s2=pp-(High-Low)
s3=Low-2*(High-pp)
r1=2*pp-Low
r2=pp+(High-Low)
r3=High+2*(pp-Low)
斐波那契模式指标计算公式(FibonacciMode):
pp=(High+Low+Close)/3.0

Indicator designed for both beginners and professionals. RECOMMEHDATION Trade with this indicator for 2-3 weeks and you will feel significant progress in your trading. This indicator is developed based on the use of HMA, Laguerre, CCI . The indicator is clear and does not require any setting. Does not redraw and works by opening bar. It works on timeframes M1-D1. I use timeframe M5 to enter the market.
FREE

This indicator contains Pivot Levels of: Traditional Fibonacci Woodie Classic Demark Camarilla Calculation periods can be set to auto / Daily / Weekly / Monthly / Yearly. Number of Levels are editable. Options to hide level labels and price labels. Pivots Points are price levels chartists can use to determine intraday support and resistance levels. Pivot Points use the previous days Open, High, and Low to calculate a Pivot Point for the current day. Using this Pivot Point as the base, three resi

Looking for an indicator that identifies high-probability price action patterns? Love counter-trend trading? The Kangaroo Tailz indicator might be just for you. This indicator is meant to be used as a reversal detector. I personally would rather enter a position at the beginning of a trend rather than catch the last couple of moves. This indicator does a good job of alerting when price may reverse by identifying price action patterns that occur frequently in markets. Even though this indicator i

This indicator calculates gann support and resistance prices with use gann pyramid formulation and draw them on the chart. And If you want, Indicator can alert you when the current price arrive these pivot levels. Alert Options: Send Mobil Message, Send E-mail, Show Message and Sound Alert Levels: S1, S2, S3, S4, S5, R1, R2, R3, R4, R5 Inputs: GannInputPrice: Input price for gann pyramid formulation. GannInputDigit: How many digit do you want to use for calculation formula. (The number and the
FREE
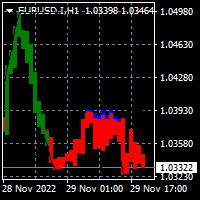
To download the MT5 version of Donchian Trend Ribbon please click here . You may also check this link . This is a conversion from TradingView: "Donchian Trend Ribbon" By "LonesomeTheBlue". This is a light-load processing and non-repaint indicator. Buffers are available for processing in EAs. You can message in private chat for further changes you need. Thanks for downloading
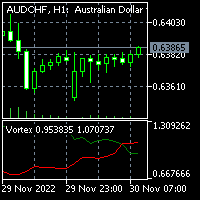
To download MT5 version please click here . - This is vortex indicator. - It is used to detect trend strength and direction. - It consists of two line(buffers). ==> VIM and VIP - There are three types of signals related to this indicator: 1. crossing VIM and VIP 2. threshold on distance between VIP and VIM 3. VIP above VIM vice versa. - This is a non-repaint indicator with light processing.
FREE

This indicator is stand alone version from MP Pivot Levels (All in one) containing Demark's Pivots.
Calculations: PP = X / 4 R1 = X / 2 - LOWprev S1 = X / 2 - HIGHprev Uses: When the pair currency price may change the direction of movement. Possible constraints of support and resistance that creates plateaus for the currency pair prices. Tendency identification by comparing the present prices according to current day's pivot point and also the prior day's pivot points. ____________
FREE

This indicator is stand alone version from MP Pivot Levels (All in one) containing Woodie Pivots. Woodie’s pivot points are made up of multiple key levels, calculated from past price points, in order to frame trades in a simplistic manner. The key levels include the ‘pivot’ itself, and multiple support and resistance levels (usually up to three each). Traders use these levels as a guide for future price movements when setting up trades.
The pivot : (Previous high + previous low + 2 x previous
FREE

Traditional Moving Average (SMA, EMA, SMMA, LWMA...) is very useful for identifying trends, but what will you do when you want to trade on lower timeframe, and you need to identify the bigger trend by a higher timeframe; Of course, you can make it by dividing your chart in separated windows, but your analytics will not be clear and intuitive ... That's why we build the Multi Timeframe Moving Average indicator.
With Multi Timeframe Moving Average ( MTF_Moving Average ), you can determine the Mo
FREE

- This is the exact conversion from TradingView: " 200-EMA Moving Average Ribbon" By "Dale_Ansel". - This indicator plots a series of moving averages to create a "ribbon" that offers a great visual structure to price action. - This indicator lets you read buffers. For information on buffers please contact via message. - This is a non-repaint and light processing load indicator
FREE

This indicator XRX Master indicator.Indicator displays trend movement. Indicator helps to buy and sell. Features FiltPer- displays indicator period.
deviation - displaus indicator deviation.
deviation2 - displaus indicator deviation 2.
HL_period - displaus indicator Highest and Lowest period. HL_period2 - displaus indicator Highest 2 and Lowest 2 period.
How to understand the status: If the trend color arrow is green, trend is up. I f the trend color arrow is red, trend is down.
///////////

To download MT5 version please click here . This is the exact conversion from TradingView: "B-Xtrender" By "QuantTherapy". - It is an oscillator based on RSI and multiple layers of moving averages. - It is a two in one indicator to calculate overbought and oversold zones for different RSI settings. - This indicator lets you read the buffers for all data on the window. - This is a non-repaint and light processing load indicator. - You can message in private chat for further changes you need.

DepthTrendView is an indicator that is used to see the direction of the market very clearly compared to the indicators that are commonly used by many people.
What is interesting about this indicator is that you can see the direction of the trend and also know that the market is at the end or that the market wants to start a new trend.
How to Use: 1- To see the earliest BUY direction you need to see previous candle below Aqua Line before green arrow appear.
2- To see the earliest SELL directi
Apollo Volume Profile 是一种使用交易量分析确定市场走势方向的指标。该指标非常易于使用。该指标清楚地显示了市场上买卖双方的比例,具体取决于所使用的时间范围。该指标可用作任何交易系统的基础。该指标不会重新绘制其信号。 该指标可用于交易任何金融工具,例如货币、金属、指数、股票、加密货币。无论您喜欢哪种交易方式,该指标在任何情况下都会对您有用。如果您是剥头皮交易者或习惯于在更高的时间范围内进行交易,该指标将对您有用。 该指标可用作独立交易系统或用作其他指标的高精度趋势过滤器。一切顺利! 祝您交易愉快、获利丰厚!愿市场永远站在你这边! 购买后,一定要写信给我!我将与您分享我的交易建议和丰厚的奖金!

在一个窗口中分析货币对的多个时间范围可能会让您感到困惑。
要分析多个时间范围,您需要可靠的指标。
其中之一是使用 9TF MACD 曲线。
我夜以继日地工作,以创建简单但可靠的代码,并在一个指标中涵盖所有九个时间范围。
让我们看一下该指标的一些优点:
彩色直方图。 每个时间范围内的曲线颜色各不相同。 指示 MACD 主线和信号线交叉的箭头。 (注意:忽略出现的最后一个箭头!) 临界水平线。 实时 9TF 仪表板监视器。 9TF 仪表板监视器计算非常准确,即使您从一个时间范围更改为另一个时间范围也是如此。 监控哪条曲线高于临界水平,哪条曲线低于临界水平。 监控曲线是否主要 MACD 高于信号 MACD,反之亦然。 监控曲线是否有主 MACD 和信号 MACD 之间的交叉。 监视当前信号与先前信号的移动。 在上升或下降的过程中。 (注意:这是剥头皮非常重要的功能!) 一个非常重要的趋势栏功能,用于发现长期趋势。 改变颜色的能力。 能够选择要显示的曲线。 能够选择要显示的直方图。 能够选择显示哪个箭头。 能够将 9TF 仪表板显示器放置在您想要的位置。 只需单击一下按钮即可显示或

Volume Champion 是一种分析市场交易量并以直方图形式显示数据的指标。您无需深入研究市场分析理论。您可以简单地跟随指标读数。指标柱根据对市场交易量结构的分析显示价格变动的潜在方向。该指标设计用于更高的时间范围,例如 H4、D1、W1。信号不呈现! 从技术上讲,该指标可以根据交易者的需要与其他时间范围一起使用。此外,该指标可用于任何货币对,但该指标最适用于某些货币对,例如 USDJPY、EURJPY、EURUSD、GBPUSD 和其他一些货币对。购买后,我将提供该指标的最佳货币对的完整列表。 购买后请联系我。我将为您提供支持的货币对列表以及出色的赠金指标,以帮助您在交易中获得更多利润! 感谢您的关注!
Nepsetms45 是一種外匯剝頭皮指標,向交易者顯示價格反轉點和當前趨勢方向。指標信號的準確度平均為 87%。這表明,如果指標在圖表上繪製一個箭頭,那麼價格在不久的將來將以 87% 的概率朝箭頭的方向移動至少 20 點或更多。該指標還使用圖表上的線條顯示趨勢方向和運動強度。
Nepsetms45 是一個現成的交易系統,用於 M5、M15 甚至 H1 時間幀的日內剝頭皮交易。與他交易非常容易。當指標畫出藍色箭頭時,我們打開一個買單。獲利+20 點。止損設置在藍色箭頭下方一點。當紅色箭頭出現時,我們做同樣的事情。僅在這種情況下,我們打開一個賣單,將獲利設置為 -20 點,並將止損設置在紅色箭頭正上方。交易系統非常簡單且經過驗證。您自己選擇手數,但我們建議使用不超過存款的 10% 來開立每筆交易。
使用 Nepsetms45 進行交易的建議: 貨幣對:GBPUSD、EURUSD、XAUUSD、USDJPY、EURJPY。 時間範圍:M5、M15、H1 經紀商的最低點差。
Nepsetms45 指標的優勢: 沒有重新繪製 顯示價格反轉點 顯示當前趨勢方向 專為日內剝頭皮而設計
N

Trend TD is a trend indicator. Thanks to the algorithm of this indicator, the signal will never go against the trend. Thanks to the two lines forming a narrow channel, the algorithm for analyzing entry points, the algorithm controls the reversal moments at the moment when the upper line of the channel has reversed and it is possible to visually draw a line crossing the upper line with itself in the past, while crossing the lower line at one point. If this rule is fixed, then the signal will

The Indicator show Daily Pivot Points. It is possible to specify the number of days to display. For forex it doesn't consider the sunday session data. It is possibile to modify the color, style and width for every level.It is better to use this indicator with timeframe not higher than Н1. 4 Levels of support and resistance with also Intermediate Levels that is possible to hide.
FREE

Thanks to this indicator, you will be able to analyze the trading of all your advisors from one account. You don't have to have a separate terminal for each Expert Advisor to evaluate its work specifically.
The indicator is able to analyze the account history by magic numbers and you will be able to see which setting with the magic number assigned to it gave what results. moreover, you will be able to analyze transactions on Buy and Sell separately, this is an underestimated moment for many tr
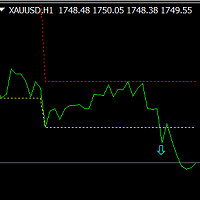
这是一款基于算法波动统计的MT4指标,主要包括两部分内容,一个是显示波动区域,另一个是如果有信号产生会同时显示信号。 其主要原理是基于指定极值波动半径进行数据统计,并绘制出波动区域,如果突破区域则会显示同方向信号。
优势: 适用于所有品种。 适用于所有周期。 仅有一个可调节参数,简单易用。 输入参数: Fluctuation Extreme Radiu: 波动极值半径,统计极值所使用的周期数。 注意: 该指标仅提供波动区域及突破信号,用户可以结合自己的分析结果和信号方向来参考下单。 大家有任何问题都可以联系我,我会及时回复大家,谢谢。 MQL5联系方式: https://www.mql5.com/zh/users/zhihui_dianjin telegram联系方式: https://t.me/ai_trade_best

KFX SMA: Symbol Changer + Moving Average (3x) + ATR + RSI + Candle Timer.
This indicator allows you to create a Symbol list and change between symbols of the current chart or Timeframe by selecting the appropriate button. On Chart there are three(3) multi timeframe Moving Averages shown (selected by you), ATR Value MTF ( selected by you - helps with setting SL and TP), RSI Value MTF (selected by you) and a Candle Timer. Features: - Symbol Changer : Change Symbol and Timeframe of Chart. (s
FREE

The Qv² Histogram - Indicator developed for traders with advanced experience. This indicator has two purposes: 1-) Identify price normality patterns (green color) 2-) Identify abnormal price patterns “outliers” (red color) ====================================================================================================================================== Interpretation for trades in start trend: Histogram (Green color) crossing the zero line upside - uptrend. Histogram (Green color) crossing th

KFX Dashboard monitors Price Action using Candle Direction + Moving Average on Multiple currency pairs (selectable by you) and on Multiple Timeframes (selectable by you). The dashboard also reveals Currency Strength of pairs based on your Moving Average selection.
FEATURES
- Price Action: Candle Direction + Moving Averages(3x shown on chart). - Multiple Symbols and Multiple Timeframes. - Currency Strength Analysis. - Monitors Open Trades: Currency Amount + Pips. - Symbol button(click) change

The indicator is built on a non-standard Zig Zag, it draws accumulations after which if the price leaves this zone and a test of this zone occurs, then a sound signal is given and an arrow appears - after the test candle closes.The indicator does not redraw its signals, it is very easy to use, there are only three settings 1- this is the zig zag parameter 2- this is the minimum price exit from the zone 3- this is the maximum price exit from the zone. The lower the parameter for Zig Zag, the more

Gartley Hunter Multi - An indicator for searching for harmonic patterns simultaneously on dozens of trading instruments and on all classic timeframes: (m1, m5, m15, m30, H1, H4, D1, Wk, Mn). Manual (Be sure to read before purchasing) | Version for MT5 Advantages 1. Patterns: Gartley, Butterfly, Shark, Crab. Bat, Alternate Bat, Deep Crab, Cypher
2. Simultaneous search for patterns on dozens of trading instruments and on all classic timeframes
3. Search for patterns of all possible sizes. From t

Moving Average Trend Alert is a triple MA indicator that helps traders to identify potential market trends based on 3 MAs alignment and crossover.
Moving Average Trend Alert features: Customizable short-term, medium-term, and long-term MAs. Option to filter signals based on a minimum distance between moving averages to avoid premature MAs alignment. Optional Filter of signals with RSI indicator overbought/oversold levels. Optional Filter of signals with ADX indicator. Popup, email, and phone no
FREE
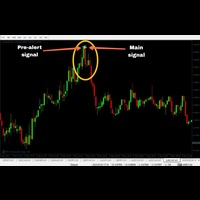
'Zoro PRO' is a reversal strategy based MT4 indicator with advance pre-alert system. Its an 100% non repaint indicator with an average accuracy of about 70-95% in any kind of market. (EXCEPT BAD MARKET AND NEWS TIME)
MT5 version: https://www.mql5.com/en/market/product/90934 (MT5 version not recommended)
Recommended Broker: Alpari, Amarkets, tickmill. Recommended pairs for M1:
EURUSD
AUDJPY
GBPUSD
EURJPY
NZDJPY
CADJPY
EURGBP
USDCAD
GBPCHF
GBPCAD
EURNZD
AUDNZD
-------------------------
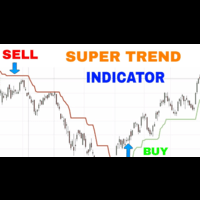
The SuperTrend Non Repaint Indicator is particularly stable and has a few advantages.
1.Magnified Market Price added for instant check of current market price
2.It uses a moving (statistical) median of the arithmetic mean (High + Low)/2 of the bars instead of a moving average. The (statistical) median is known to be more robust than any average.
3.It calculates both the Median and the ATR (average true range) 1 bar ago, whereas the original SuperTrend indicator takes the ATR and moving average
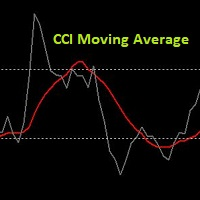
It's a very simple indicator. This is simply the CCI moving average. The CCI Moving Average Indicator allows us to reduce false signals and optimize our trading. The required indicator inputs are: CCI Period, CCI Applied Price, Period of CCI Moving Average and Method of CCI Moving Average. The chart displays the original CCI and its moving average. This is my first indicator that I publish. I hope the indicator will benefit you. The author of this indicator is Tomasz Buliński.
FREE

The Hurricane Cave Indicator shows different trade areas based on price action. It looks in the past and works out patterns that can enforce support and resistance as targets. When price breaks out of a trade area you can target just inside the next trade area. If you can't see the target just go to a slower time frame, it means the price hasn't been there for a long time. The Hurricane Cave Indicator is designed to be an add on to The Hurricane Forex Indicator also available in the Meta Trader
FREE
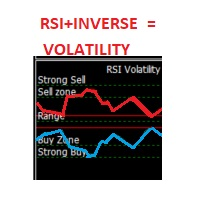
This indicator is an oscillator that shows the RSI (Relative Strength Index) in red and its inverse graph in a light green. Together this shows the volatility of the market (in its default setting). You can also change it to show only the RSI graph. It also gives you the possibility to change its Period. The oscillators zones (80,70,50,30,20) are marked by Strong Sell, Sell Zone, Range, Buy Zone, and Strong Buy respectively.
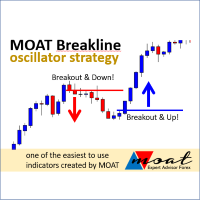
The indicator will provide a breakout line or price stop guide, we recommend M5 or H1 timeframes. Trade signal: Buy Signal: if the closed price (according to the timeframe) breaks the blue line and is already above it or if the lowest price stops above the red line. Sell Signal : if the closing price (according to the timeframe) breaks the red line and is already below it or if the highest price stops below the blue line. Feature: You will get time (hours) and price values for the lines

MT5版本 | FAQ Owl Smart Levels Indicator 是一個完整的交易系統,包含 Bill Williams 的高級分形、構建正確的市場波浪結構的 Valable ZigZag 以及標記準確入場水平的斐波那契水平等流行的市場分析工具 進入市場和地方獲利。 策略的详细说明 指示灯使用说明 顾问-贸易猫头鹰助手助理 私人用户聊天 ->购买后写信给我,我会将您添加到私人聊天中,您可以在那里下载所有奖金 力量在於簡單!
Owl Smart Levels 交易系統非常易於使用,因此適合專業人士和剛開始研究市場並為自己選擇交易策略的人。 策略和指標中沒有隱藏的秘密公式和計算方法,所有策略指標都是公開的。 Owl Smart Levels 允許您快速查看進入交易的信號,突出顯示下訂單的水平並向您發送有關已出現信號的通知。 優點很明顯: 清楚地顯示主要和更高時間框架的趨勢方向。 指示儀器信號的出現。 標記開單、止損設置和固定利潤的水平。 沒有多餘的,只有必要的結構! ZigZag 表示全球趨勢的方向,因此也表示貿易方向。 市場反轉點的短線清楚地表明在什
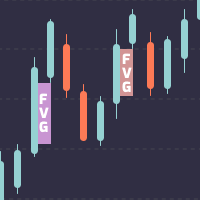
MetaTrader 4 的 Fair Value Gap 指标。
Fair Value Gap 是由著名的价格趋势交易者 ICT 提出的。 当价格移动过快时,会在K线图上留下缺口。 它是K线身体的部分,不与左蜡烛和旁边的右蜡烛的尾巴重叠。 当价格在图表上留下缺口时,我们可以记住两件事。 第一,价格朝那个方向发展的势头非常强劲,第二,价格通常会在朝那个方向发展之前回撤以填补缺口。 Fair Value Gap 最常用于价格趋势交易者,被定义为价格传递中效率低下或不平衡的情况。 这种低效率可能会成为未来价格的磁铁,以重新平衡这种价格失衡,因为有许多之前没有完成的剩余订单。 交易者可以使用此信息来确定 Fair Value Gap,或寻找潜在的多头/空头入场点,使其成为良好的 POI。 功能
在图表上清楚地标记所有的Fair Value Gap,所有颜色都是可定制的。 显示已经重新平衡的区域。 当价格进入Fair Value Gap 时发出提醒。

變化率
根據公式, ROC = (Close[n] - Close[n-lookback]) / Close[n-lookback] * 100 繪製一個貨幣對價格行為在回顧期內的變化率,並提供兩個全局變量,SYMBOL_ROC 和 SYMBOL_ROC_LOOKBACK,分別代表最新的變化率值和上一個回顧期的變化率。 使用 iCustom 函數調用指標, iCustom ( "Market/RedeeCash_Rate_of_Change.ex4" , Symbol (), 5 , 0 , 0 ); 然後檢索全局變量, double roc = GlobalVariableGet ( StringConcatenate ( Symbol (), "_ROC" )); double roc_lookback = GlobalVariableGet ( StringConcatenate (Synbol(), "_ROC_LOOKBACK" )); 並執行測試以驗證趨勢, if (roc > roc_lookback && roc > 0 ) trend= "UP" ; if (ro
FREE

剝頭皮指標二合一。購買此指標,贈送自動機器人一個!用於搜索價格反轉點的自動系統。貨幣對圖表上帶點的指標顯示價格走勢的可能反轉點。紅點表示向下運動的逆轉,藍點表示價格向上運動的逆轉。該指標非常適合使用剝頭皮策略的日內交易。與通道指示器完美結合。當通道指標顯示下降趨勢且 M1 TickTok 繪製紅點時,賣出。當通道指標顯示上升趨勢且 M1 TickTok 指標繪製藍點時,我們買入。
該指標的好處: 不會在 OPEN 模式下重繪其值。 如果您打開 CLOSE 模式,您需要等待蠟燭關閉。 該指標適用於任何貨幣對的交易。 該指標適用於所有時間範圍,包括 M1 建議: 與任何通道指示器串聯使用 設置: mode_pric - 分析市場的價格模式。 Bb_period_short - Bb 指標短波的周期。 Bb_period_long - Bb 指標的長波週期。 arrow - 信號點的大小。
在圖表上顯示價格反轉點。工作時間為 1 分鐘。紅色箭頭表示價格現在會下跌,藍色箭頭表示價格現在會上漲。信號的準確性高達 93%,具體取決於貨幣對。適用於所有貨幣對,包括金屬黃金和白銀。該指標分析當前價格相對於過去某個時期的價格範圍的位置。該指標使用數學模塊優化其數據,並使用圖形箭頭將其解釋為信號。該指標非常易於使用,在交易剝頭皮策略時非常有用。
該指標的好處: 顯示價格反轉點 顯示最小 1 分鐘週期的信號 適用於所有貨幣對 安裝在 Metatrader4 終端上
如何下載和測試? 為此,請使用鏈接 https://www.mql5.com/en/articles/498 中的說明
交易建議: 使用時間 1 分鐘 (M1) 任何貨幣對
指標設置: period - 指標計算週期。 lower - 價格變動範圍的下限,以 % 表示 upper - 價格變動範圍的上限,以 % 表示 size_arrow - 圖表上箭頭的大小
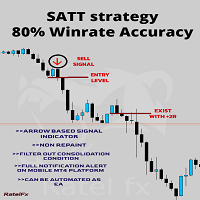
SAT strategy (Systematic Approach Trading Technique)
This is a revolutionary new way of trading the financial market.
This is the top indicator system that provides the most accurate trading signals for both entries and exits.
This system indicator algorithm provides the most accurate and precise signal only during the highly impulsive phase of the market.
This system indicator performs well during a high volume period, which is only the first three hours of a specific session, whether in L

This indicator is developed based on the multiple session trading to aid in analysis for all the day traders. The indicator supports all currency pairs as well as other trading instruments like indicies, commodities, metals ,etc. The way the indicator work is by making analysis on your behalf. During asian session that's when the indicator does the calculations and provided trading plans in form of areas on the chart for the current day. And this process happens everyday which allows for hands f

Emini Signal Bar
Price - Promotion: $100 - Normal Price: $200
Symbol Recommended - S&P 500 Index / US500
Timeframe - 5 minutes Buffer Information - Buy Trade Buffer = 2 - Sell Trade Buffer = 3 Main features - Show Buy Signal Bar and Sell Signal Bar on Live Chart. - Get Alert from signal bar. - The precision of the Alert is superior to dots. (Alert is active at that time) - Dots will be recalculated after reset the properties. After the Alert is displayed, kindly make your decisions to trade.
This indicator is intended to help traders to see today's daily range compared to the average daily range. You can change the number of days for the average daily range otherwise you can use 20 as the default. The % Reach will give info about the progress today's range toward the average daily range. Breakout traders, or pullback traders normally will look at base area, in which they might want to know the average daily range as comparison.
The indicator has color code green and red, where the

GMMA indicator that looks like a cloud. The GMMA indicator is easy to read, but to make it even more visually pleasing, we made it look like an Ichimoku Chart cloud. Colors have been changed where short-term and long-term overlap.
My other products https://www.mql5.com/ja/users/studiotam/seller
Please reduce the character limit a bit. I have nothing more to write.
FREE
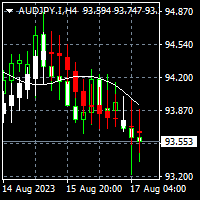
To download MT5 version please click here . - This is the exact conversion from TradingView: "Linear Regression Candles" By "ugurvu". - This is a non-repaint and light processing load indicator - You can message in private chat for further changes you need. This is a sample EA code that operates based on bullish and bearish linear regression candles . #property strict input string EA_Setting= "" ; input int magic_number= 1234 ; input string Risk_Management= "" ; input double fixed_lot_size=

A Gap often occurs when the price moves with "strength" in a given direction (either up or down). This Gap is formed when, in looking at 3 consecutive candles, the wicks of the 1st and 3rd candles do not overlap. When this happens, the indicator creates a rectangle where the Gap is located. It identifies a zone where the price could potentially go back to (mitigation). The Gap/rectangle is mitigated when the price returns and completely covers the rectangle. Note that the indicator also show

The XR Gartley Pattern MT4 is an indicator which displays and alerts Gartley pattern detected on the candlestick chart. It also displays potential trade with calculated Take Profit and Stop Loss, Timeframe H1. After purchasing XR Gartley Pattern, you can immediately download this indicator from the MT4-MT5 Market and start using it because all features are set to default, is not necessary to change any parameter. In addition, we have created a private group for customers who have purchased one
FREE
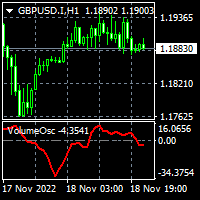
To download MT5 version please click here . The Volume Oscillator measures volume by analyzing the relationship between two Moving Averages. The Volume Oscillator indicator subtracts a fast MA from slow MA. The fast and slow MA periods are configurable via input tab. Volume indicators are an ingredient of trading systems to avoid entry in thin liquidity markets. Having set a threshold on Volume Oscillator you can avoid entering chop. Buffers are available to access via EA.
FREE
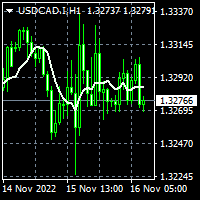
To download MT5 version please click here . Metatrader users are limited to few moving average types. Therefor I decided to create a package consisting of all MAs I knew. This package suggests 12 different types: { SMA, EMA, DEMA, TEMA, WMA, VWMA, SMMA(RMA), HullMA, LSMA, ALMA, SSMA, TMA } You can configure them via input tab. This is a non-repaint indicator with light load. To implement them I referred to standard libraries of pine script.
FREE
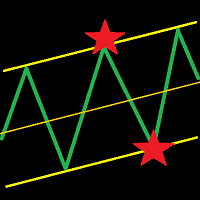
This indicator draws a trend line and a trend tunnel on the chart. You can choose several calculation methods, alerts, notifications, and other settings. It can also draw trendlines from another TimeFrame. You can also use this indicator for your ExpertAdvisor. The current values of the lines are stored in the memory buffer from where the EA can load them. You can trade the price bounce from the upper and lower lines . Settings TimeFrame – trend timeframe Description – show description of line

Easy to use indicator that will help you place your pending and market orders with great accuracy. The indicator plots the order blocks based on how price reacts to current market structure. These key levels represent supply and demand zones and the Smart Blocks Trading System indicator uses price to assess whether an asset is being accumulated or distributed. It can be used on any financial instrument, and on any given time frame.
BoS stands for Break of (market) Structure. The blue and red d
MetaTrader市场提供了一个方便,安全的购买MetaTrader平台应用程序的场所。直接从您的程序端免费下载EA交易和指标的试用版在测试策略中进行测试。
在不同模式下测试应用程序来监视性能和为您想要使用MQL5.community支付系统的产品进行付款。
您错过了交易机会:
- 免费交易应用程序
- 8,000+信号可供复制
- 探索金融市场的经济新闻
注册
登录