适用于MetaTrader 4的新技术指标 - 64
Simple Trading System Update !!! Follow this link to see our 2024 Strategy !!! ( Download the EAs scanner )
Deal trading trend indicator is a useful indicator tool predicting the market movement, easy-to-use due to obviously showing trend line, arrow and target point. You can consider the direction of the market for going up or going down by using this indicator.
Parameters In this section, we are explaining the main parameters including; Period bar : The number of history bars are us
Trend VS is a simple indicator with simple and reliable signals. The high speed of reading signals from the chart is an advantage for a trader using this type of analysis. What could be faster than a visual signal from a chart? Only software reception of such signals. But we trade manually and receive signals visually. Everything happens quickly - they saw a signal, opened a deal, placed stop orders.
Also an important advantage of using the Trend VS indicator is the fact that it does not redr

Trend Improved - Arrow trend indicator, without lagging and redrawing, is used by traders in trending strategies in trading on financial markets (Forex, CFDs, binary options).
Key parameter MinAngle - The parameter is set in pips. For each instrument, select individually, start from scratch. If the parameter is too large then there will be no signals.
The tool, at the very least, deserves attention for its signal accuracy and intuitiveness. Increasing the Period parameters decreases the num
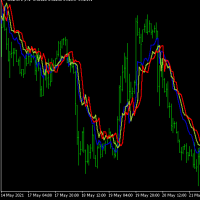
Forex strength meter is a useful indicator with which novice traders and professionals can analyze the market and see when and where to open a deal. Forex strength meter is an analytical complex for Metatrader4 which, in the form of lines on the chart, shows the trader the direction of the trend and its reversals. The interpretation of the indicator is very simple. When the indicator draws a red line above the blue line on the chart, it means that the trend is now going down. At this point, it

The Trend Long indicator accompanies long trends. It can be used only to determine the global trend, but not as an entry point. Any reliable entry indicator can be used for the entry point. Or the standard RSI, based on overbought / oversold levels.
The indicator can be used without restrictions on instruments or timeframes. Experiment with the parameters! The parameters are not linear! When you specify a period, you only specify a period to determine the price range for a certain interval. T

PX Trend is a technical indicator that mathematically transforms the price of a currency pair in the form of signaling arrows on the chart, it is used to predict the direction of the market movement. This tool is basic for the interpretation of the parameters of the graphs in technical analysis.
PX Trend refers to an arrow indicator Forex - a tool that gives unambiguous signals to buy or sell currencies using arrows. An arrow directed upwards recommends buying, downward - selling. The indicat
HNI-SCALP-SWING indicator Indicator can be used for trading with agGressive or safe signals It has a HIGHER TIME FRAME FILTER that can be adjusted to suit the quality of signals The Entry signals are confirmed with a higher time frame filter . It can be used on any time frames from the smallest to the Highest It can generate signals on the opening and running bar or ON THE CLOSE OF THE BAR - as per the signal setting
PARAMETERS
TimeFrames = PERIOD_CURRENT; //TimeFrames TimeFrame = Tim
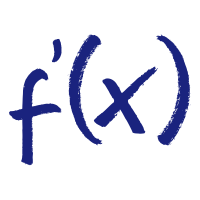
First Derivative RSI is a forex indicator based on all familiar RSI, based on the first derivative of the price function. The indicator combines the functionality of an oscillator and a trend indicator. At the bottom of the chart, a part of the indicator similar to the RSI will be displayed, but only calculated as the first derivative of the price. On the chart itself, trend signals will be displayed by arrows, they are filtered by the algorithm and always alternate buy / sell. It also shows th

A indicator to show saturation in buying or selling With fast and complex mathematical calculations Easily find saturation points for buying or selling Can be used in all symbols and time frames with many signals Can be combined with different indicators and different time frames With simple settings and simple working methods
Features: Can be used on all symbols Can be used in all time frames Can be used in all markets (Forex, stock, etc.) Large number of signals Same performance on all t

Heiken Ashi Button Heiken-Ashi , often spelled Heikin-Ashi, is a Japanese word that means "Average Bar." The Heiken-Ashi approach can be used in conjunction with candlestick charts to spot market trends and forecast future prices. It's useful for making candlestick charts easier to read and analysing patterns. Traders can use Heiken-Ashi charts to determine when to stay in trades while the trend continues and close trades when the trend reverses. The majority of earnings are made when markets a
FREE

Check my p a id tools they work perfect please r ate Adjustable PIN BAR indicator is usefull tool alowing to search for pin bars you wish to find on the price chart, it has 2 parameters to filter out what type of pin bars you wish to search for: 1) MinTailProc 75% (default) which means to show pin bars that has minimum size of the Nose (Tail) as 75% of full candle size. If Upper Nose (Tail) size of the candle is minimum 75% of the candle size fully than candle is painted in RED. If Lower Nose
FREE

The Elder Impulse System was designed by Alexander Elder and featured in his book. According to Elder, “the system identifies inflection points where a trend speeds up or slows down”. The Impulse System is based on two indicators, a exponential moving average and the MACD-Histogram. The moving average identifies the trend, while the MACD-Histogram measures momentum. As a result, the Impulse System combines trend following and momentum to identify tradable impulses. This unique indicator combina

TPP : Turning Point Pattern The indicator shows the market Turning Point Pattern as arrows. The reversal signals are based on observation of price action and market behavior. It is based on the principles of searching for extremums, volatility, and candlestick pattern. The indicator provides signals on the following principles: Search for the end of the ascending/descending trend Search for the reversal pattern based on candlestick pattern Confirmation of the reversal by the volatility. The in
FREE

The CCI Divergence is a reasonably useful indicator in itself, but it is even more effective when used with divergence pattern trading. The CCI Divergence indicator signal is one of the most potent signals among the indicators that exist in the market.
Here is new version for Divergence Indicator using CCI method, with more improvements.
Divergences indicate a potential investment point because the directional moment does not confirm the price. A bullish divergence occurs when the underlying

Auto Pitchfork Indicator The indicator calculate the Pitch fork for the previous Day (Selectable) with multiple Support and Resistance lines from the Median price which acts as Magnet for the Price that if price touch the above warning (1) or below warning (1) lines and not cross up or down then there is maximum possibilities that it will return to the Median Line, and thus maintain the Price Action in Cyclic Pattern to the Market Move. You are able to select how many warning lines you want to k

The Relative Strength Index technical indicator (RSI) is a price-following oscillator that ranges between 0 and 100. When Wilder introduced the Relative Strength Index, he recommended using a 14-day RSI.. Since then, the 9-day and 25-day Relative Strength Index indicators have also gained popularity. A popular method of analyzing the RSI is to look for a divergence in which the security is making a new high, but the RSI is failing to surpass its previous high. This divergence is an indicati

The Relative Strength Index Technical Indicator (RSI) is a price-following oscillator that ranges between 0 and 100. When Wilder introduced the Relative Strength Index, he recommended using a 14-period RSI. Since then, the 9-period and 25-period Relative Strength Index indicators have also gained popularity. A popular method of analyzing the RSI is to look for a divergence in which the security is making a new high, but the RSI is failing to surpass its previous high. This divergence is an indic
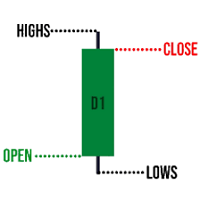
This indicator provides daily high, low and close values. You have to use H4 or lower timeframe to display levels. Every day shows previous day's high, low and close values as lines. The lines are updated at the beginning of the day and do not change in 24 hours period. You can use this indicator for breakout startegy or range trading. Like most indicators, it is recommed to use additional indicators to get accurate signals.

evaluator consistently checks for price targets in spreads. it can operate in any timeframe. if you have purchased the product please contact me personally for help to further understand the system and get update on upcomings. creates a single chart in a single window based on the price action of each currency in relation to all other currencies and period are totally edittable.

矩阵箭头指标 MT4 是一种独特的 10 合 1 趋势,遵循 100% 非重绘多时间框架指标 ,可用于所有符号/工具:外汇、商品、加密货币、指数、股票。 Matrix Arrow Indicator MT4 将在其早期阶段确定当前趋势,从多达 10 个标准指标中收集信息和数据,它们是: 平均定向运动指数 (ADX) 商品渠道指数 (CCI) 经典 Heiken Ashi 蜡烛 移动平均线 移动平均收敛散度 (MACD) 相对活力指数 (RVI) 相对强弱指数 (RSI) 抛物线SAR 随机振荡器 威廉姆斯的百分比范围 当所有指标给出有效的买入或卖出信号时,相应的箭头将打印在图表上,在下一根蜡烛/柱线开盘时,指示强劲的上升趋势/下降趋势。用户可以选择使用哪些指标,并可以单独调整每个指标的参数。 Matrix Arrow Indicator MT4 仅从选定的指标中收集信息,并仅根据其数据打印箭头。 Matrix Arrow Indicator MT4 还可以为所有新信号发送终端、推送通知或电子邮件警报。无论您是黄牛、日内交易者还是波段交易者, Matrix Arrow Indicat
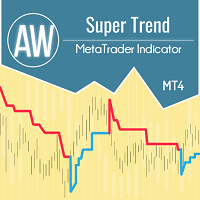
AW Super Trend - 这是最流行的经典趋势指标之一。它有一个简单的设置,让您不仅可以处理趋势,还可以显示由该指标计算的止损水平。 好处:
仪器: 货币对 、股票、商品、指数、加密货币。 时限:М15 及更高。 交易时间:全天候。 显示当前趋势的方向。 计算止损。 它可以在交易时使用。 三种类型的通知:推送、电子邮件、警报。 MT5 版本 -> 这里 / 新闻 -> 这里 能力:
- 该指标以相应颜色显示当前趋势方向。
- 蓝色表示当前时间范围内使用的交易品种的上升趋势。
- 该线的红色表示所选交易品种所用时间范围的下降趋势。
该指标可用于设置止损。
指标线不显示在条柱上方,而是相对于条柱有一些偏移。这个显示趋势线的地方可以被交易者用来设置止损。 当趋势发生变化时,指标线会在趋势变化的时刻重新绘制并显示为垂直线。该显示是由于该指标可用于标记止损。 可能会在较小的时间范围内过滤信号,并在较高的时间范围内显示方向。 怎么运行的:
1. 也就是说,如果您在 M15 或 M30 时间范围内工作
2. 在更高的时间框架上运行指标。 H4 或
FREE
每日交易者 该指标是 RPTrade Pro Solutions 系统的一部分。 每日交易者是仅使用统计数据的每日指标。 它旨在供任何人使用,即使是绝对的交易初学者也可以使用它。 从不重新粉刷。 指示是从接近到接近给出的。 设计为单独使用,无需其他指标。 为您提供清晰简单的指示
它是如何工作的 统计系统分析历史以发现符号行为中的冗余。 交易是一一指示的,永远不会同时进行两笔交易。
它表示: 何时进行交易 在哪里放置止盈 未来 24 小时内要进行的交易 作品 使用任何工具,如外汇对、指数、金属、期货或任何其他工具。 仅在 H1 与任何经纪人。 (较低的点差会给您带来更多的点数)
特征 可靠的买入/卖出信号。 非常简单的输入。 屏幕提醒 + 推送通知 + 电子邮件通知 所有通知都非常详细,并且还提供获利,它允许从移动设备进行交易。 帮助您找到正确设置的利润图表 只需启用/禁用每日交易,即可直接在图表上调整设置
如何使用它 ? 只需将其放在您的图表上即可。 只需遵循指示即可。
输入 UsePush: [Bool] true 将发送推送通知。 UseM

The Trend movement indicator calculates the saturation levels of the price chart. A signal to exit the oversold area is a buy signal. A signal to exit the overbought area is a sell signal. Usually, you need to set the relative values for the overbought and oversold levels Bottom and Top - for this indicator.
Most often, a good trend is visible on a price chart visually. But an experienced trader should clearly understand the current balance of power in the market before entering. And the in

This indicator is designed to identify trend reversal points. Its main difference from others is that it does not use moving indicators such as MA and built on its basis, namely, it does not show a trend reversal after the fact of a reversal, but tries to predict a trend reversal even BEFORE the reversal begins. The indicator is based on many different author's developments that allow you to minimize the number of false signals.
The Trend Predictor indicator will be a very good helper in your

Control Shot - Unique indicator for identifying trends. The new system adapts to the market, eliminates additional conditions and copes with its task. A revolutionary new way to identify the start of a trend early. The trend indicator, shows signals, can be used with an optimal risk ratio. It uses reliable algorithms in its calculations. Shows favorable moments for entering the market with arrows, that is, using the indicator is quite simple.
Tired of adjusting the indicator settings, wasting

Trend Simon - allows you to determine the current trend. Using the algorithm implemented in this indicator, you can quickly understand which trend is currently developing in the market. The indicator ignores sharp fluctuations and market noise and monitors market trends. Trend Simon indicators can be used along with oscillators as a filter. Flexible settings of Trend Simon indicators allow you to receive more accurate signals for opening positions on different instruments.
For calculations, t

Moving Average Rainbow Stack: Free: Single Currency & Single Timeframe MA Stack Very useful for finding current and higher timeframe trends. Best suited for long term trend based trading. Use fewer MAs for quick scalping. And not suitable during low volatility. Only use during high volatility and steady trending markets. Use this to enhance your existing Trend based strategies to find best trends.
Read detailed description https://abiroid.com/product/abiroid-ma-stack Available MTF and Scanner
FREE

Channel Smooth - Forex channel indicator is a very useful and relevant tool for any trader, thanks to which you can efficiently and competently perform plotting on the chart, including automatically, without wasting time on independent calculations and eliminating the risk of incorrect point selection. Channels are needed to trade channel strategies that involve working within a certain price range.
The key difference between the Channel Smooth indicator and other channel indicators (for exam

For This Indicator 'WL Percent R'
This indicator is an upgrade of traditional Williams %R on MT4. 1. Up trend : indicator is above -50 and strong trend is above -20. 2. Down trend : indicator is below -50 and strong trend is below -80.
How to use... 1. You can be customize color and level of indicator. 2. You can be customize alert and define alert on next bar or instant bar.
Williams Percent R (Williams %R) credit : https://www.investopedia.com/terms/w/williamsr.asp
Williams %R, also

Safe Trend Indicator works on M1, M5, M15, M30, H1 and H4 timeframes. It confirms trade directions. Scalpers, Intraday, especially swing, intermediate and long term traders will especially find this indicator useful. On chart edits and other show/hide buttons make possible clarity of chart while Sate Trend Indicator remains active even when hidden. Send an order not far from any of the most current circular colored spot that you see on the chart. Also if any additional same order in the c

Concept : Sto Extreme Entry order point is a set of Stochastic oscillator (5,3,3) (customizable). There are 4 types of entry points: 1. Main line cross above/below Signal line : Main line Intersect Signal Line (2 lines intersect) 2. Main line line or Signal line cross out OVB/OVS : Main line /Signal Line (Optional) cross above OVB and cross below OVS 3. Main line line or Signal line cross in OVB/OVS : Main line /Signal Line (Optional) cross below OVB and cross above OVS 4. Main line line or S

Footmarks Pro Footmarks Pro is a MetaTrader 4 Essential Indicator that create round number or sweetspot on chart with "Button". Parameter Indicator Name - Footmarks Pro Pair Selection - 250 points / 500 points / 1000 points Sweetspot Setting Sweetspot Line Color Sweetspot Line Style Sweetspot Line Thickness Sweetspot Button Setting Button Axis-X Button Axis-Y Thanks...
FREE

Half Trend TPSL Buy Sell Indicator calculates the open and close of the price bars over the selected period of time and applies its own calculation method to find an average line of the price movement. ATR based Take Profit and Stop Loss ATR is a measure of volatility over a specified period of time. The most common length is 14, which is also a common length for oscillators, such as the relative strength index (RSI) and stochastics. A higher ATR indicates a more volatile market, while a lowe

Сигнальный индикатор "SDATA" рассчитывается на основе стандартного отклонения от простой средней скользящей пропорционально среднеквадратичному отклонению. Настройки индикатора: Data bars - количество баров для рассчета Deviation Data - среднеквадратичное отклонение Smooth Data - сглаживание данных Code Arrow Buy - код значка на покупку Color Arrow Buy - цвет значка на покупку Code Arrow Sell - код значка на продажу Color Arrow Sell - цвет значка на продажу В момент инициализации индикатора (при

Who Strong Who Weak ?
Hola Traders. Who Strong Who Weak ? This is my new a indicator. It will help to show the flow of money. by using the currency pairs BASE ON USD. Makes you know currency how much change by BASE ON USD. You will see THE MONEY FLOW and SUPPORT ZONE and RESISTANCE ZONE of all currency.
I will always help you if you have any questions. Best regards, Nantakan.
ENJOY.

Volatility Vision: Essential for Forex and Stock Markets
发现Volatility Vision:您的交易革命 完美适合初学者和专业交易者 简单入门指南: 通过我们的 用户手册 ,学习如何有效使用它。
Volatility Vision 指标是一个强大的工具,可以在您的图表上精确描绘波动率水平。这个多功能工具是整合到您的交易策略中必不可少的,兼容所有货币对和股票市场。 利用 波动率阈值 ,自信地管理您在一周内的交易。 Volatility Vision的优势 增强准确性: 显著减少了常见于随机振荡器的误报。 早期信号: 比RSI更早捕捉交易信号,帮助您抓住错失的机会。 市场领先: 在MACD响应之前提供前瞻性见解。 可靠性: 避免了CCI常见的误信号陷阱。 轻松配置 输入ATR值以开始(默认值为15)。所有级别都是固定的,以保持一致的分析;切换时间框架以刷新数据。 指标指南 蓝线: 每日波动率。 红线: 每周波动率。 橙线: 每月波动率。 将Volatility Vision与传统的ATR结合使用,以获得更多战略机会。今天就
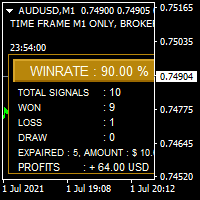
Bonosu Pro is Binary Option Indicator Generates a signal only 0 - 2 signals / pair daily. works on all pairs. Time Frame only M1 recommended expaired is 5 Minutes. Default setting GMT Offset = GMT +3 can be adjusted manually. Can be used for automated trading using platforms such as MT2 trading. Backtest menu Highly Winrate history tester No Delay No Repaint Similiar product Bintang Binary R2 Indicator https://www.mql5.com/en/market/product/57755

Perfect Entry Indicator MT5 检测趋势和进入交易的最佳价格
趋势检测,完美入场 - 区分 趋势的方向和强度 ,根据趋势是强看涨、弱看涨、强看跌或弱看跌显示不同颜色的线。- 完美进入的最佳切入点 - 显示有利于趋势的最佳入场 区域。 永远不要逆势交易。
进入信号和警报 - 当价格处于有效区域时,它会发送弹出警报、电话和邮件,并根据输入的设置建议交易。
贸易建议 - 交易可以有 3 种不同的方法来计算止损。- - 显示交易的开盘价。 - 根据止损显示最多四个止盈。
横向过滤,始终顺应趋势交易 - 指标具有侧过滤器,以免在没有趋势的区域运行。更强的过滤不允许指标在弱趋势上生成信号 - 您可以设置区域的灵敏度。增加敏感性将进入较小的回撤,降低敏感性将进入更深的回撤。 - 区域还可以区分它们对上升或下降趋势的敏感度,这是因为,由于下降趋势更快,因此可以方便地为它们设置更高的敏感度。 - 您可以配置线条和区域的颜色。
高精度信号 - 产生高概率信号。

该指标在图表上显示重要的技术水平。 这些水平充当价格走势的支撑或阻力。
最重要的等级是 100 和 50 分的倍数。 您还可以以 25 点的倍数显示级别。
当价格达到该水平时,将显示警报或推送通知。
MT5 版本 https://www.mql5.com/zh/market/product/69740 设置 Show Levels 100 pips - 以 100 点的倍数显示水平 Show Levels 50 pips - 以 50 点的倍数显示水平 Show Levels 25 pips - 以 25 点的倍数显示水平 Color Levels 100 pips - 可被 100 点整除的级别的线条颜色 Color Levels 50 pips - 可被 50 点整除的级别的线条颜色 Color Levels 25 pips - 可被 25 点整除的级别的线条颜色 Send Alert - 发送通知 Send Push - 发送推送通知
FREE

该指标通过忽略突然的波动和市场噪音,以无与伦比的可靠性跟踪市场趋势。它被设计用于趋势交易日内图表和较小的时间范围。其获胜率约为85%。 [ 安装指南 | 更新指南 | 故障排除 | 常见问题 | 所有产品 ] 极易交易 查找超卖/超买情况 随时享受无噪音交易 避免在盘中图表中被鞭打 该指标分析其自身的质量和性能 它实现了一个多时间仪表板 该指标适用于低时限交易,因为它通过降低平均价格周围的市场噪音而忽略了突然的价格飙升或修正。 该指标根本不需要优化 它实现了一个多时间仪表板 它实现了电子邮件/声音/推送警报 指示器为不可重涂和不可重涂 该指标实现了适合于较小时间范围的趋势跟踪方向,该趋势可以渗透到较高时间范围内的非常长的趋势中,从而扩大了您的收益。
指标剖析 指标显示一条彩色的线,周围环绕着一个价格带。彩色线是有价证券的平均价格,而价格带表示超买/超卖水平。如果平均价格为蓝色,则您应该在市场没有超买的情况下寻找多头交易;如果平均价格为红色,则应该在市场没有超卖的情况下寻找空头交易。 指标的趋势变化并不表示立即进行交易或完成相反交易的信号!这些频段用于计时。
技术信息
指

MT4 trend indicator with a probability of reaching a profit of 70-90%! Works without redrawing and delays. Trend Master PRO shows good results on all trading instruments: currencies, metals, indices, stocks, cryptocurrencies. Recommended timeframe: H1-H4.
More information about the indicator is here: https://www.mql5.com/en/blogs/post/744748
Recommendations for use
Use automatic period detection The main feature of the indicator is the self-optimization function.

Get Free Scanner and example Strategies
And understand detailed description here: https://abiroid.com/product/abiroid-customizer-arrows-and-scanner And get example wrapper here: https://abiroid.com/indicators/customizer-sample-wrappers
You can make your own wrappers if your indicators have complex conditions or for In-Built MT4 indicators.
Features:
- Specify your own Custom Indicator - Specify Buffer values and create Variables - Use those Variables to create your own Buy/Sell Conditions

The indicator takes very large price movements,you can trade on any instruments and on any timeframe,you can enter immediately when a signal appears or wait for a consolidation and enter on the next candle,the line can flash on the first candle this is done so that you can make a decision earlier.I am not ashamed of this indicator,run it in the tester and see what movements it takes.Have a good trade.After the purchase, I will give detailed instructions.
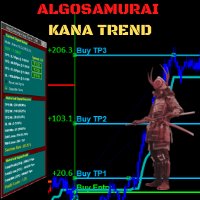
Cutting-edge solution for Trend Trading with statistically robust signals! Kana Trend’s smart algorithm detects the trend on any instrument, any timeframe, and gives powerful entry signals with exit levels. Its advanced statistics gives you deep insight as to success and profitability of its signals -- while being fully transparent on any potential for loss. Because this is an indicator, not an EA, you cannot see it in action in visual tester if you download the Free Demo. Instead, please down

FBO Trend Momentum FBO Trend Momentum is a simple to use trend following system. It detects the prevailing trend and gives entry points when there is momentum in the direction of the trend. Suitable for defining entry points for scalping as well as for intra-day trading. Features Works with the prevailing market trend. Suitable for all markets (currency pairs, metals and indices). Ideal for trading on the H1, H4 and D1 time frames. Does not redraw/repaint the arrows. Arrows are confirmed at t

There is a very simple rule
It is Always difficult to cross high pressure areas and easy to cross low pressure areas
MT5 version is available here
This is definitely true for price
It was so simple, it was not!
So let's get started
This indicator shows you the amount of pressure in that area according to the bars that it shows. The longer the bar, the higher the pressure in that area It also marks the most pressed area with a rectangle
From now on you can simply decide on the

Trend Bilio - an arrow indicator without redrawing shows potential market entry points in the form of arrows of the corresponding color: upward red arrows suggest opening a buy, green down arrows - selling. The entrance is supposed to be at the next bar after the pointer.
The arrow indicator Trend Bilio visually "unloads" the price chart and saves time for analysis: no signal - no deal, if an opposite signal appears, then the current deal should be closed. It is Trend Bilio that is considered

False Breakout Stochastic to be used with our Elliott Wave Indicator as part of the overall strategy on trading the 5th wave.
As we cannot upload multiple files, we have listed this separately. False Breakout Stochastic is best used as a confirmation tool rather than the sole signal indicator The Elliott Wave Indicator Suite is designed around a simple but effective Swing Trading Strategy. The Indicator Suite is great for Stocks, Futures and Forex trading on multiple timeframes You can find the
FREE

5/35 Oscillator to be used with our Elliott Wave Indicator as part of the overall strategy on trading the 5th wave. The Elliott Wave Indicator Suite is designed around a simple but effective Swing Trading Strategy. The Indicator Suite is great for Stocks, Futures and Forex trading on multiple timeframes You can find the main Elliott Wave Indicator here https://www.mql5.com/en/market/product/44034
FREE

Do you need precision? Tick charts show each change in the ask or bid; The chart updates whenever either price changes. Study the markets more deeply, with surgical precision. Tick Chart Window saves all the received ticks and shows them into a seperate window. Get the best entry price in the Market. trade with precision trade good Spread Register In the comment section you will see the highest spread, the lowest spread and the average spread since the indicator was loaded.
FREE

Moving Average Crossover Scanner and Dashboard Advanced Moving Average Scanner Moving Average Crossover Dashboard The indicator scans the market and sends signals and alerts for Moving Averages crossovers, death cross and golden cross. Crossovers are one of the main moving average ( MA ) strategies. MA Crossover ( cut ) strategy is to apply two moving averages to a chart: one longer and one shorter. When the shorter-term ( fast MA ) MA crosses above the longer-term ( slow MA ) MA, it's a buy sig
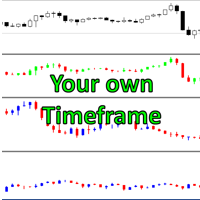
Would you like to set up the best time that fits your trading style? This indicator gives you this solution with ease.
1 minute, 2, 3, 10 or whatever you want, now you can have them all with a simple external window indicator. 5 seconds, 10, 30 or whatever seconds you want, now you can have those charts. You can visualize different timeframes when Backtesting strategies. The trading system is suitable for experienced traders and beginners. The charts can be used for manual trading (short-term o

Immediately plots renko bars in an external/indicator window. One of the distinctive advantages Renko charts offer is the fact that they are not time dependent. Therefore, the new Renko blocks are only traced when the price moves higher or lower by the specified number of points.
For example, a 10 pip (100 points) Renko chart would plot the blocks when price moves 10 pips higher in an uptrend or 10 pips lower in a downtrend. Renko charts removes "noises" from the Market and i t helps to ident

Finding the right trend is always one of the most important points of trading
If you agree with me then let's move on
How do we recognize the trend?
As you well know, one of the best and most widely used standard indicators is the ATR. There is no special magic
We try to identify the trend by calculating the amount of ATR and the amount of Multiplier.
You can use this indicator in all currencies and all time frames. Of course, note that the purpose of this indicator is to show the t

對稱三角形模式儀表板允許您同時監控多個市場和時間範圍內的對稱三角形模式,由此處提供的對稱三角形模式指標繪製: https://www.mql5.com/en/market/product/68709/ 訪問上述指標以了解有關如何形成對稱三角形模式的更多信息,以及如何簡單地遵循交易它們的策略。
儀表板是獨立產品,不需要指示器工作。它僅監視模式並在它們形成時發出警報,因此如果您想實際查看圖表上的模式,您還需要對稱三角形模式指示器。
對稱三角形圖表模式代表價格被迫向上突破或崩盤之前的一段收縮和盤整期。下趨勢線的突破標誌著新的看跌趨勢的開始,而上趨勢線的突破表明新的看漲趨勢的開始。
此儀表板可識別這些模式,並在 4 個關鍵點形成且價格再次回落至三角形時提醒您,以便您為潛在的突破做好準備。儀表板將監控您想要為您不斷交易的所有主要時間框架和工具,並在蠟燭接近時檢查每個工具和時間框架,以便在新模式形成時發出警報。
輸入和配置選項:
模板名稱 - 當您單擊警報時,破折號將為該工具和時間範圍打開一個新圖表,這是它將使用的模板的名稱。 有效信號柱 - 儀表板之前的蠟燭/柱數量將顯示警

Apollo Striker 是一个有效的买入/卖出箭头指标,可预测价格走势的方向。该指标绝对适合所有交易者,无论首选策略或货币对、时间范围如何。这个箭头指标绝对可以与任何交易工具一起使用,无论是货币、金属、指数、股票甚至是加密货币。此外,交易者可以使用指标设置中的特殊参数轻松调整任何交易对和时间框架的指标信号。该指示器提供声音警报,包括 PUSH。该指标产生买入和卖出信号。 该指标可用于剥头皮交易、日内交易以及中长期交易。使用该指标进行交易非常简单。为此,您只需要按照箭头进行操作。感谢您的关注!祝您交易成功! 指示信号不要重绘! 购买后,一定要写信给我!我将为您提供使用此指标的建议。还有丰厚的红利等着你!

因为风格很重要
我知道每次都要点击属性来改变蜡烛的颜色、背景是浅色还是深色,以及放置或删除网格是多么令人厌烦。这里有一个一键式的解决方案。 三个可定制的按钮可以选择交易者想要的蜡烛样式。 一个按钮可以在白天和夜晚模式之间切换。 一个按钮可以在图表上显示或隐藏网格。 ***** 在设置中,你可以选择按钮在屏幕上的显示位置*****。
请考虑查看我的其他产品 https://www.mql5.com/en/users/javimorales.fer/seller
检查MT5版本: https://www.mql5.com/en/market/product/69070
什么是RSI指标?
RSI显示为一个震荡器,可以从0到100进行测量。该指标由J.Welles Wilder Jr.开发,并发表在他1978年的开创性著作《技术交易系统的新概念》中。它被认为是低于20的超卖和高于80的超买。RSI提供信号,告诉交易者在货币/股票/工具超卖时买入,超买时卖出。
如有任何问题,请随时与我联系。
作者简介
Javier Morales,交易算法的创始人。
FREE

平均真实范围 (ATR) 是一种常用指标,用于衡量在设定的持续时间内价格的变动量。然而,它给出的价值并没有在任何类型的边界内定义,这使得将其用于止损或止盈计算以外的任何事情几乎是不可能的。
该指标是您的标准 ATR 指标,但我们引入了百分位分界,以便您可以看到极端情况。
您可以在百分位数和我们称之为分割中位数的东西之间进行选择
百分位水平
百分位水平绘制为 1%、5%、20%、50%、80%、95%、99%,这些显示价格与所有其他值的关系。例如,5% 水平表示在该线以下,只有 5% 的 ATR 读数变得如此低,而 99% 表示在该水平之上的 ATR 值中,只有 1% 的值变得如此高。
高于 80%,您可能会选择开始降低任何新交易的头寸规模,而高于 95% 可能是在动量改变之前获利的好时机。
分割中位数
分割中值设置是一个更简单的版本,只绘制了 4 个级别,极端、较高、中值和较低。这些级别的工作方式与百分位数完全相同,但更加清晰。这就是指标的原始版本的工作方式,直到我变得更加熟练并将其更改为百分比。
ATR 移动平均线
该指标还显示 ATR 值的移动

当价格达到或超过当前期间的预期范围时,范围耗尽就会发生。在这些水平上,价格开始失去相对于该时期早些时候的动力,因此最好确保您没有建立新头寸。 该指标将向您显示图表上可能发生这种情况的位置,显示每日、每周和每月的水平。 当您看到价格超过这些耗尽水平时,它告诉您移动背后的势头非常强劲,并且可能会走向更高的时间框架水平。 该指标可以使用平均真实范围 (ATR) 或平均范围 (ADR) 计算,具体取决于您的偏好。默认情况下,我们使用 ATR,因为我们发现它在外汇图表上效果更好,但 ADR 在基于股票的指数和符号上确实具有优势。 该指标有多种绘图模式,如下所述,您可以根据自己的需要对其进行定制。
设置
计算模式 选择 AverageTrueRange (ATR) 或 AverageDailyRange (ADR) 来计算水平。 绘图模式 该指标可以以不同的方式显示。 - 绘制价格调整线 - 水平根据达到的高点和低点在整个时期内调整。这是默认且最常用的方法。 - Draw Expected Maximum - 该水平是一个固定值,是最后一个收盘价加上或减去 ATR 或 ADR 值。 -

BeST_Gann Hi-Lo Strategy is an MT4 indicator that is based on the Gann Hi-Lo Activator the famous trend-following indicator that allow us to to enter a trade quite early while also stay in a trade as longer as we can for taking profit.While it is built of a moving average it helps traders determine the direction of the trends and to produce with-trend trading signals.
This indicator is in fact a simple moving average of the highs and lows of the previous period. It follows the trends in the mar
FREE
NO REPAINT ADVANCED CHART PATTERN INDICATOR
By definition, a price ( chart) pattern is a recognizable configuration of price movement that is identified using a series of trendlines and/or curves. When a price pattern signals a change in trend direction, it is known as a reversal pattern; a continuation pattern occurs when the trend continues in its existing direction following a brief pause. Advanced Chart Pattern Tracker is designed to find the MOST ACCURATE patterns. A special script is

Dark Sprint is an Indicator for intraday trading. This Indicator is based on Trend Following strategy, also adopting the use of the atr to determine the right volatility. We can enter in good price with this Indicator, in order to follow the strong impulse on the current instrument.
Key benefits
Easily visible sprint lines Intuitive directional arrows Automated adjustment for each timeframe and instrument Easy to use even for beginners Never repaints, never backpaints, Not Lag 100% compati

Lizzy Broken is a financial market indicator for META TRADER 4.
LizzyBroken's function is to show the daily channels on the graph of the inserted pair. Through the channels, Lizzy does a brief breakout analysis and provides you with a BUY and SELL area followed by TAKE PROFITs (TP) and also StopLoss (SL).
Lizzy Broken also provides a stat on the upper left side showing the previous day's high/low and also as text showing the BUY/SELL areas with TP/SL.
LizzyBroken indicator is perfect to b

Read detailed description and Get Free Demo and extra indicators: https://abiroid.com/product/abiroid-halftrend-scanner
Features:
- Halftrend Arrow Scan: Scan Max Past Bars for Halftrend arrows. Show how many bars back the arrow occurred in a bracket - Past Bars Back Alerts: Num of bars back for which scanner will send alerts - Halftrend HTF Align: Scan Higher timeframes for Trend Direction of Halftrend Indicator and if trends align show a slanting Green/Red Arrow for Up/Down trend - Semafor

The Donchian channel is an indicator that takes a series of user-defined periods and calculates the upper and lower bands. Draw two lines on the graph according to the Donchian channel formula. This straightforward formula is based on:
The top line is the highest price for the last periods n The bottom line is the lowest price for the last periods n
Trend systems follow periods when support and resistance levels are broken. in this case when the price breaks the upper line or the lower line
FREE

This strategy is useful for small timeframe scalping and binary options. Best timeframes: M5,M15,M30 M1 timeframe is too unpredictable. So be careful with that.
Read Detailed Description and Get All: - Free Demo - Free Scanner - Extra Indicators ex4 files from https://abiroid.com/product/abiroid-donchian-scanner-and-arrows
Arrows Demo only works in strategy tester. So, Arrows Demo won't work with the free scanner. Scanner needs "Abiroid Donchian Arrow.ex4" to work. So make sure both arrows a

LordChannel is an indicator for META TRADER 4 for all forex pairs and financial market metals.
The indicator is used to make detections of high/low channels, implementing a technical analysis on possible breakouts and making correct order entries.
LordChannel sends signals such as buy and sell in the graphical analysis, it is important to emphasize that the importance of these signals are safe in TIME FRAMES M30, H1, H4.
The indicator was created for using bullish/downtrend channels to co

This indicator shows us the trend or direction of the market and a possible stop loss
This indicator works with two parameters, period and multiplier. Buy and sell signals are generated when the indicator crosses the closing price and it changes color.
This indicator is used in all types of markets such as stocks, futures, forex, cryptos, additionally it can be used in different time periods: hours, daily, weekly, etc.
It is recommended not to use it while the market is sideways, this can
FREE
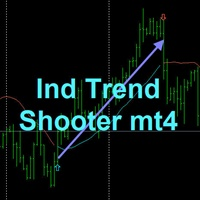
TREND SHOOTER Without alerts
It is a trend indicator based on moving averages that very efficiently calculates changes in market direction.
This has the ability to anticipate changes of direction very early.
FEATURES
This indicator particularly draws two moving averages that are used only to show color changes. they can wear these moving stockings as they wish as they do not affect the color change behavior bullish blue color
bearish red color where the line is interrupted it is not
FREE

The regression channel is one of the most popular technical analysis tools among traders. First, the indicator draws a trend line between two points, then on its basis it builds a channel of two parallel lines, which will be at the same distance from the regression line.
The term linear regression belongs to the field of statistics. The center line of the channel is the trend line. To calculate it, the least squares method is used. The line above the center line acts as resistance for the pri
MetaTrader 市场 - 在您的交易程序端可以直接使用为交易者提供的自动交易和技术指标。
MQL5.community 支付系统 提供给MQL5.com 网站所有已注册用户用于MetaTrade服务方面的事务。您可以使用WebMoney,PayPal 或银行卡进行存取款。
您错过了交易机会:
- 免费交易应用程序
- 8,000+信号可供复制
- 探索金融市场的经济新闻
注册
登录