YouTube'dan Mağaza ile ilgili eğitici videoları izleyin
Bir ticaret robotu veya gösterge nasıl satın alınır?
Uzman Danışmanınızı
sanal sunucuda çalıştırın
sanal sunucuda çalıştırın
Satın almadan önce göstergeyi/ticaret robotunu test edin
Mağazada kazanç sağlamak ister misiniz?
Satış için bir ürün nasıl sunulur?
MetaTrader 4 için yeni teknik göstergeler
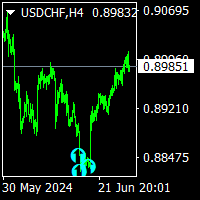
norepaint buy sell indicator is norepaint indicator.and works all pairs and all timeframes. using is wery simple ,it puts arrow on price probably buy sell arrows. thise indicator is suitable for beginner and experienced traders. there is cnt numbers that show how many bars you see the signal back. increasing it possible but up to chart have the how many bars . minimum value of this 500.

NextCandlePredictor Göstergesi NextCandlePredictor, yeniden boyamayan, rengini değiştirmeyen, hareket etmeyen, kaybolmayan ve gecikme olmayan bir uyarılı sinyal göstergesidir. Herhangi bir zaman diliminde bir sonraki veya yaklaşan mumların yönünü belirlemenize yardımcı olacaktır. New York, Londra veya her ikisinin de çakıştığı yüksek volatiliteye sahip piyasalar için şiddetle tavsiye edilir. Ana Özellikler: Zaman Dilimlerinde Esneklik: M1'den H1'e ve ötesine kadar herhangi bir zaman diliminde hı

PPR ve Engulfing , MetaTrader 4 (MT4) ticaret platformunda "PPR" ve "Engulfing" desenlerini tanımlamak için tasarlanmış benzersiz bir teknik göstergedir. Bu desenler, potansiyel trend dönüşlerini veya devamlarını gösterebilir ve traderlara piyasaya giriş ve çıkış için değerli sinyaller sağlar. Temel Özellikler: Otomatik Desen Tespiti : Göstergesi, PPR ve Engulfing desenlerini otomatik olarak tanımlar ve grafikte oklarla işaretler. Görsel Sinyaller : Yukarıya doğru yeşil oklar alım noktalarını, a
FREE

REMINDER: Early buyers hot price discount: Price subject to rise after first 20 copies. Starting price $65 and final price will be $1275. Secure your discounted copy Now!
Smart Money Analyser Indicator User Manual
1. Introduction Welcome to the Smart Money Analyser Indicator This powerful tool provides traders with comprehensive market analysis by combining various technical indicators to generate actionable trading signals. Designed to be user-friendly, this indicator helps traders of a
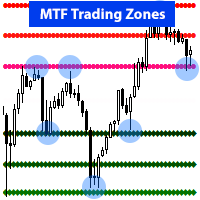
Not a traditional support resistance, or pivot point indicator. RevCan's " Early Reversal - MTF Trading Zones " is an Advanced tool that identifies potential market reversal points, or change of a trend at an early stage using MTF chart analysis. >> It analyzes multiple chart timeframes (MTF) to find these key price turnover zones where big banks and institutions are likely to place their trades, hence chances for you for high probability trade entry, Stop loss, and Take profit targets to maximi
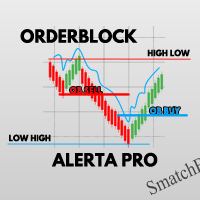
OrderBlock PRO ALERT
OrderBlock ALERTA PRO is the definitive tool for identifying the best entry points into the financial market. With it, you will find the ideal balance points for orders, detecting when liquidity will start to increase when breaking the bullish or bearish structure. Receive PUSH notifications directly on your Meta Trader, keeping you always informed.
Furthermore, OrderBlock ALERTA PRO identifies the HIGH LOW (HL) and LOW HIGH (LH) zones, providing you with the exact pric
MTFMA (Çok Zaman Çerçeveli Hareketli Ortalamalar) göstergesi, ana grafikten ayrı bir pencerede farklı zaman dilimlerinde birden fazla hareketli ortalamayı (MA) kullanarak alım ve satım sinyalleri sağlar (yeniden boyamaz). Küçük zaman dilimlerinde scalping için ve daha büyük zaman dilimlerinde uzun vadeli ticaret için uygun, çok yönlü ve kolay yorumlanabilen bir göstergedir. Neden Multi-Frame? Çok zaman çerçeveli terimi, göstergenin birden fazla zaman diliminden gelen verileri kullanma ve birleşt

"MultiSymbol & TF Chart Integrated" göstergesi, tek bir grafikte (çoklu mod) tercih ettiğiniz zaman dilimlerinde 60'a kadar döviz çiftini izleyebilmenizi veya işlem yaptığınız çifti tüm TF'lerde görüntüleyebilmenizi (basit mod) sağlayarak piyasaya hızlı ve kapsamlı bir bakış sunmak üzere tasarlanmıştır. Ana Avantajlar: Tam İzleme: Tek bir grafikte tüm istenen çiftleri bir bakışta gerçek zamanlı olarak izlemeye olanak tanır.
Zaman Tasarrufu: Grafikler arasında geçiş yapma ihtiyacını ortadan kald

WaveMaster Pro : Advanced Market Analysis Indicator for MetaTrader 4 Overview WaveMaster Pro is an advanced MetaTrader 4 (MT4) indicator engineered to enhance trading strategies by offering a sophisticated analysis of market trends and price movements. By integrating sector analysis, micro wave detection, and price projection capabilities, WaveMaster Pro provides traders with actionable insights for better decision-making. Whether you are a novice trader or a seasoned professional, this tool is
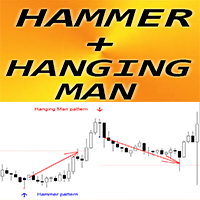
Forex Indicator " Hammer and Hanging Man patterns" for MT4 Indicator " Hammer and Hanging Man" is very powerful indicator for Price Action trading: No repaint, No delays; Indicator detects bullish Hammer and bearish Hanging Man patterns on chart: Bullish Hammer - Blue arrow signal on chart (see pictures) Bearish Hanging Man - Red arrow signal on chart (see pictures) with P C, Mobile & Email alerts Indicator " Hammer and Hanging Man " is excellent to combine with Support/Resist
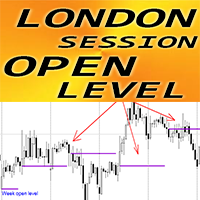
Forex Indicator "London Session Open Level" for MT4 Indicator "London Session Open Level" is very useful auxiliary indicator for intraday trading Session open price level is so important because very often price returns back to that area during the day. Indicator shows you London session open price level daily for each day Also indicator shows week open level on Mondays It is useful for intraday traders to set up targets or use as support/resistance area. // More great Expert Advisors and
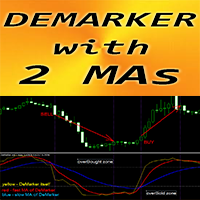
Forex Indicator " DeMarker and 2 Moving Averages" for MT4 DeMarker oscillator curve indicates the current price position relative to previous highs and lows during the indicator calculation period "DeMarker and 2 Moving Averages" Indicator allows you to see Fast and Slow Moving Averages of DeMarker oscillator I t is great to take Sell entries from OverBought zone (above 0.7) and Buy entries from OverSold zone (below 0.3) I ndicator is very easy to set up via parame
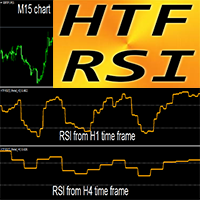
Forex Indicator HTF RSI Oscillator for MT4 RSI itself is one of the best and most popular oscillators. H TF means - H igher Time Frame. Overbought zone is when the RSI is above 70 and Oversold one - when it is below 30 RSI provides information regarding bullish and bearish price momentum
This indicator is excellent for Multi-Time Frame trading systems with Price Action entries or in combination with other indicators. HTF RSI Indicator allows you to attach RSI from Hi
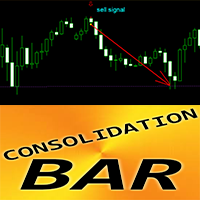
Forex Indicator Consolidation Bar Pattern for MT4 Indicator "Consolidation Bar " is very powerful breakout-focused indicator for Price Action trading Indicator detects price consolidation in narrow area during 1 bar and shows: Breakout direction, Pending order and SL locations Bullish Consolidation Bar - Blue arrow signal on chart (see pictures) Bearish Consolidation Bar - Red arrow signal on chart (see pictures) No repaint; No delays; High R/R ratio (reward/risk); PC, Mobile & Em
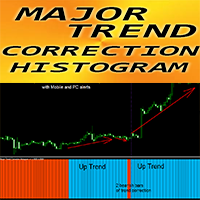
Forex Indicator "Major Trend Correction Histogram" for MT4 Major Trend Correction Histogram indicator was designed to detect big trends Indicator can be in 2 colors: Red for bearish trend and Blue for bullish one (colors can be changed) At least 10 consecutive histogram columns of the same color means beginning of new trend Indicator has built-in Mobile and PC alerts
Parameter "Period", responsible for indicator's sensitivity
HOW TO USE indicator:
1) Check for at least 10 conse

Indicatorul excepțional ISKANDER
Bun venit!
Studiați și experimentați excepționalul indicator IKANDER! Merita.
Funcționează pe toate intervalele de timp și pe toate perechile. Observați rezultatele foarte bune prezentate în aceste imagini și în videoclip.
Succes!
Notă Este posibil ca acești indicatori și experți pe care i-am scos la vânzare să nu funcționeze pe anumite platforme. De câțiva ani, unele platforme cu noi versiuni MT4 nu afișează toți indicatorii personalizați.
O soluție
The presented indicator is a development of the ideas contained in the Bulls or Bears AM indicator. This indicator displays the difference between the maximum and minimum prices for the current period of time and the values of the channel built using the maximum and minimum prices for a longer period. An increase in indicator values above zero indicates that the maximum price for the current period is greater than the average value of the maximum prices for the period selected as an indicato
FREE
The Fractal LVL AM indicator analyzes the price patterns that form on the candlestick chart and display the turning points of the market trend. A fractal consists of candles, the middle of which is either the highest (upward fractal) or the lowest (downward fractal) of all the candles taken for analysis. Unlike the original indicator where fractals are formed by five candles (maximum/minimum in the center and two candles with smaller/larger maximum/minimum values on each side), the proposed ve
FREE
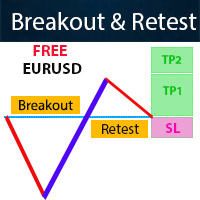
It is FREE on EURUSD chart. All Symbols version! Contact me for any questions Introduction The breakout and retest strategy is traded support and resistance levels. it involves price breaking through a previous level. The break and retest strategy is designed to help traders do two main things, the first is to avoid false breakouts. Many false breakouts start with a candlestick that breaks out of a level but ends with an immediate candlestick that brings the price back into the level. The
FREE

Gann Angles Indicator The Gann Angles Indicator is a powerful technical tool based on the theory of William Delbert Gann. It helps traders identify potential support and resistance levels, as well as trend direction across various time intervals. Key features: Automatic determination of extremum within a specified time range Construction of 9 Gann Fan lines with angles of 82.5, 75, 71.25, 63.75, 45, 26.25, 18.75, 15, and 7.5 Flexible line color customization Adaptation to both upward an
Meta indicator
Bun venit!
Studiu și experiență Metaindicator. Există trei indicatori integrați într-unul singur.
Funcționează pe toate intervalele de timp și pe toate perechile. I prefer the M15.
Am deja o tranzacție câștigată cu el.
Succes!
Notă Este posibil ca acești indicatori și experți pe care îi avem de vânzare să nu funcționeze pe anumite platforme. De câțiva ani, unele platforme cu noi versiuni MT4 nu afișează toți indicatorii personalizați.
O soluție la această problemă

This indicator uses digital filters to analyze data. The indicator colors the chart candles in accordance with the current trend.
Digital filters are (simplistically) a way of smoothing data. Unlike traditional moving averages, a digital filter will be more effective in most cases. This indicator allows you to identify the difference between the current price and its expected value calculated by an adaptive digital filter. Moments of divergence are moments of price movement that can be used to
FREE
Indicatorul Delphinus
24 hours - PRICE REDUCTION! Profita! Bun venit!
Studiați și experimentați indicatorul Delphinus!
Observați rezultatele foarte bune prezentate în imagini. Funcționează pe toate intervalele de timp și pe toate perechile, cu diferențe de rigoare. Succes!
Notă Este posibil ca acești indicatori și experți pe care i-am scos la vânzare să nu funcționeze pe anumite platforme. De câțiva ani, unele platforme cu noi versiuni MT4 nu afișează toți indicatorii personalizați.
O

The indicator defines the buy and sell arrows with high performance and consistent results. Suitable for trend trading or following the trend. Automatic analysis of market opportunities ; Help traders earn more from their investments;
Never repaints, recalculates or backpaints signals; This is FREE demo version of the indicator and works only on "EUR USD M5" . The demo version does not work on SUFFIX OR PREFIX brokers ! Trend Reversing PRO All other details about the indicator here
FREE

Description of work
The 'MA7 Moss' indicator is based on the standard Accelerator Oscillator (AC) indicator. Shows overbought and oversold zones. Detailed information about the 'MA7 Moss' indicator.
Indicator settings
General settings: Upper level ; Lower level .
Message settings: Send message to the terminal (Alert) – permission to send messages to the terminal using the Alert function; Send message to the mobile terminal (Push) – permission to send messages to the mobile terminal using p

The GT_SqueezeBreakOut signal indicator is a momentum based strategy using the bollinger bands and standard deviation indicators (which indicate periods of low volatility and eventual breakout) as well as the Fisher momentum/trend indicator to filter quality trade signals. It shows the squeeze (price consolidation) periods on chart and also signals on breakout of squeeze/price consolidation. You get instant alert/ push notification both on chart and on any other device used to receive alert sig

The Listo trend direction indicator shows the current trend direction by coloring the bars in red and blue. It is suitable for all currency pairs and timeframes. It is important to remember that to enter the market it is necessary to take into account an integrated approach and additional signals. The operating principle of the indicator is based on automatically determining the current state of the market and analyzing historical data when placing it on a chart.

Do you often miss your trading moments?
This powerful indicator could be the solution you've been looking for :) Key Features: Can detect trading times based on the hours you input. real-time alerts, it ensures you stay on top of your trading game. Never miss out again! Display object sperator and timeline for trading moment. buffer for customization. Dont miss your trading moment again.
FREE
1 Min Gold Golden Range 2 is one of the top entry indicators securing its future with its results. Indicator settings: Points = how precise is patter detection AlertConfirmation = turn on(true) off(false) alert CalculatedBars = how many bars will be calculated
Please leave Positive comments, reviews. Buffer 0 Buy Arrow, Buffer 1 Sell Arrow, Buffer2 Buy Signal(Value 1), Buffer3 Sell Signal(Value1) Buy Green, Sell Red
If you have any questions please email: win2mywin@gmail.com

Get rid of trading confusion and embrace stable income! Are you still worried about finding a low-risk and stable profit method? Are you still anxious about judging the market direction and controlling the risk of placing orders? The new cross-platform arbitrage indicator helps you easily achieve stable returns! Accurately capture arbitrage opportunities without you having to worry! The cross-platform arbitrage indicator is a powerful tool that can monitor the price differences of the same finan

FXDragunov.MyThemes. Forex Chart Color Themes.
Chart templates are responsible for chart layout and for contents of technical indicators applied to them.
Chart templates are used: When customizing an opened chart window. When customizing settings of a new chart window. When customizing a chart opened via the “New chart” window.
Original code by FXDragunov Indonesia
FREE
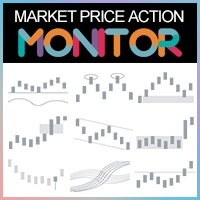
Why do I need to use the Market PA Monitor:
1.It is impossible to monitor multiple varieties and multiple TF of the market.
The market situation is constantly changing, with numerous varieties, and each variety has different timeframe from small to large. Each TF contains different market changes and trend alternations. Under numerous varieties and multiple TFs, there are countless trading opportunities every day. However, an ordinary trader cannot detect the trading opportunities of each v

Triarr is a trend indicator whose signals are displayed as arrows on the price chart. This indicator calculates instead of one, three specified periods on the current timeframe, and based on them, displays signals in the direction from the highest period to the lower one.
Triarr is suitable for any currency pair, any timeframe, and does not change its readings. 1H timeframe is recommended. The indicator is very easy to set up, which is a good advantage for research. Main Settings: HistoryBars
Powerful Order Block indicator in Tradingview platform. Indicator type: Price Action indicator Introduction: The Order Block Indicator - Elevating Your Price Action Analysis. If you're seeking a comprehensive Order Block indicator on the MQL5 platform, look no further.
Firstly, according to this indicator, an OB is understood as a zone of pending orders from large institutions that haven't been fully executed, revealing themselves in the market through subtle signs. Prices react strongly wh
Oxima is an indicator designed to search for local extremes and determine the current trend. The author's methodology is used in the calculations of the indicator.
With the help of the indicator, you can determine the places of possible price reversals, preferably in the direction of the trend, but also with sufficient accuracy against it. You can also use the indicator to determine the current trend. The indicator is suitable for any currency pairs, but for an adequate display of the reading
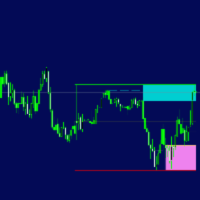
1. Updated usage instructions in blog below: Smart Market Structure Trading System and Automatic Scanner - Trading Systems - 13 October 2023 - Traders' Blogs (mql5.com) https://www.mql5.com/en/blogs/post/754495 2. Smart Money Concepts, Support and Resistance, Buy Side Liquidity, Sell Side Liquidity, Monthly Highs/Lows, Weekly High/Lows, Previous Day High/Low/Open, Daily High/Low/Open, 4our/1Hour High/Low/Open...all the most important price lines/areas that the smart money uses to sweep the mark
FREE
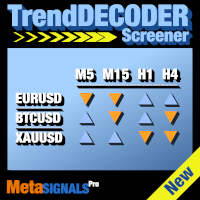
Birden fazla varlık ve birden fazla zaman birimi için TrendDECODER sinyalleri alın | Girmek için en iyi zaman birimini belirleyin | Kârınızı ve kazanan işlemlerinizi en üst düzeye çıkarın Yeniden boyanmayan, gecikmeyen gösterge ve tarayıcı - manuel ve otomatik ticaret için ideal - tüm varlıklar ve tüm zaman birimleri için İlk 50 kopya için 49$ - sonra 99$ Satın aldıktan sonra lütfen yorum yapın veya inceleme bırakın ve size 99$ değerinde EK bir gösterge göndereceğiz. MT5 versiyonu: Buraya tıkl

PowerBall Signals, destek/direnç bölgelerini kullanma fikrine dayanan bir AL/SAT sinyal göstergesidir. Gösterge, destek/direnç bölgelerine dayalı özel dönüş modellerini tespit eder ve bu sinyalleri grafiğinize sunar. Göstergenin ana fikri MTF (Çoklu Zaman Çerçevesi) analizini kullanmak ve mevcut ve bir sonraki daha yüksek zaman dilimindeki seviyelere göre sinyaller sağlamaktır. Bu yöntem, para birimleri, metaller, endeksler ve hatta kripto para birimleri olsun, herhangi bir pazardaki olası fiyat

SATIN ALDIKTAN SONRA BİR MESAJ VEYA YORUM BIRAKIN VE BONUS EA TİCARET ASİSTANINI GÖNDERECEĞİM! Hypertrend, mumları trendin gücüne göre renklendirecek çok güçlü bir görsel göstergedir. YENİDEN BOYAMA YAPILMAZ!
Tüm çiftlerde ve zaman dilimlerinde çalışır! Ekran görüntülerini (GIF) kontrol edin!
Sizin için trendi bulmak için özel filtreler ve osilatörler kullanıyor, bu nedenle grafiğe bakmaktan başka hiçbir şey yapmanıza gerek yok!
Ayarlar:
Sadece renkleri tercihinize göre değiştirin ve uy
FX Strength Meter Pro , Forex piyasasında en iyi ticaret fırsatlarını bulmak isteyen yatırımcılar için tasarlanmış güçlü bir göstergedir. Göstergelerimiz her bir ana döviz çiftinin (USD, EUR, GBP, CHF, AUD, NZD, JPY, CAD) gücünü ve zayıflığını gerçek zamanlı olarak göstererek, ticaret stratejinizi optimize etmek için en güçlü ve en zayıf para birimlerini hızlı bir şekilde belirlemenize yardımcı olur.
ana özellik:
Çoklu zaman çizelgesi desteği: Dakika satırından aylık satıra (M1, M5, M15
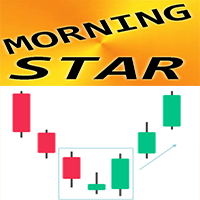
Forex Indicator " Morning Star pattern" for MT4 Indicator "Morning Star pattern" is a very powerful indicator for Price Action trading: No repaint, No delays; Indicator detects bullish Morning Star patterns on chart: Blue arrow signal on chart (see pictures) P C, Mobile & Email alerts are included Also its brother - bearish " Evening Star pattern" indicator is available (follow the links below) Indicator " Morning Star pattern" is excellent to combine with Support/Resistance Leve

Forex Indicator " Evening Star pattern" for MT4 Indicator "Evening Star pattern" is very powerful indicator for Price Action trading: No repaint, No delays; Indicator detects bearish Evening Star patterns on chart: Red arrow signal on chart (see pictures) P C, Mobile & Email alerts are included Also its brother - bullish " Morning Star pattern" indicator is available (follow the links below) Indicator " Evening Star pattern" is excellent to combine with Support/Resistan
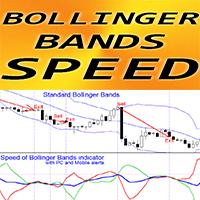
Forex Indicator " Bollinger Bands Speed" for MT4, No Repaint. Speed of Bollinger Bands - is a unique trend indicator The calculation of this indicator is based on equations from physics . Speed is the 1st derivative of standard Bollinger Bands Bollinger Bands speed indicator shows how fast BB middle line and BB borders change their directions By default: Blue line is the speed of BB middle line, Red line - speed of bottom border, Green one - speed of top border It is recom
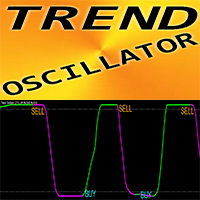
Trend Oscillator - is an advanced custom indicator, efficient trading tool! Advanced new calculation method is used - 20 options for parameter "Price for calculation" Smoothest oscillator ever developed Green color for upward trends, Red color for downward trends Oversold values: below 5 ; O verbought values: over 95 There are plenty of opportunities to upgrade even standard strategies with this indicator with PC and Mobile alerts // More great Expert Advisors and Indicators are available
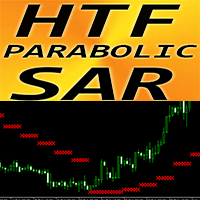
Forex Indicator Parabolic SAR Higher Time Frame for MT4 Upgrade your trading methods with great auxiliary HTF PSAR indicator for MT4. H TF means - H igher Time Frame PSAR is used to determine trend direction and potential reversals in price movement. This indicator is great to use for Trailing Stop purpose If PSAR is located above the price - it is downward trend If PSAR is located below the price - it is upward trend This indicator is excellent to combine with price action entrie
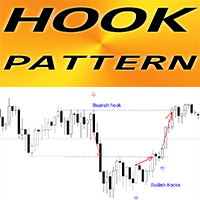
Forex Indicator " Hook pattern" for MT4 Indicator " Hook pattern " is very powerful indicator for Price Action trading : No repaint, No delays; Indicator detects bullish and bearish Hook patterns on chart: Bullish Hook - Blue arrow signal on chart (see pictures) Bearish Hook - Red arrow signal on chart (see pictures) P C, Mobile & Email alerts are included Indicator " Hook pattern" is good to combine with Support/Resistance Levels: https://www.mql5.com/en/market/prod

Forex Indicator MA Acceleration for MT4, No Repaint. MA Acceleration - is scalping indicator, designed as auxiliary tool for "MA Speed" indicator The calculation of this indicator is based on equations from physics. It will show you the acceleration of moving average line. There are plenty of opportunities to upgrade even standard strategies with MA Acceleration. It is possible to use for SMA, EMA and LWMA. Indicator set up is very easy. MA Acceleration indicator shows how fast MA Speed indi

Tired of sailing the seas of uncertainty in the financial market? Imagine having an experienced guide by your side, helping you unravel the mysteries of the charts and leading you safely towards financial success. With StakBank , you will have in your hands more than just a simple indicator. You will have a complete arsenal of tools to make assertive and profitable decisions . But what makes StakBank so special? Volume: Understand the driving force behind market movements , identifying support

The Dreadnought indicator carefully analyzes price dynamics, identifying temporary weakening of the trend and sharp changes in its direction. By monitoring this indicator, you can easily notice changes in the market and take appropriate action. Entering the market may be easy, but maintaining a position is much more difficult. With Dreadnought, you have reliable support to successfully stay ahead of the trend. This indicator analyzes historical data and provides the trader with the necessary in

The Radiant Trend indicator calculates the saturation levels of the price chart. A signal to exit the oversold zone indicates a buy, and a signal to exit the overbought zone indicates a sell. For this indicator, it is usually necessary to set relative values for the overbought and oversold levels – Bottom and Top.
Often a good trend can be seen visually on the price chart. However, an experienced trader must clearly understand the current market situation before opening a position. The indi

The Geliosx indicator is designed to visually display the trend. One of the key tasks when monitoring the currency market is to determine the trend - a stable direction of price movement. Geliosx uses special calculations to smooth out sharp fluctuations that do not have a significant impact on the overall picture of the price movement.
This indicator is created for those who value their time and money.
The trend can be ascending (bull trend) or descending (bear trend). Typically, the trend

The Arriator forex indicator algorithm allows you to quickly determine the current trend in the market. The Elephant indicator accompanies long-term trends and can be used without restrictions on instruments or timeframes. This indicator not only helps predict future values, but also generates buy and sell signals. It tracks market trends, ignoring wild swings and market noise around the average price. The indicator implements a type of technical analysis based on the idea of market cyclicalit

The Sirius X indicator reliably tracks market trends, ignoring wild swings and market noise. Suitable for trading on any timeframe, effectively filtering sudden price spikes and corrections by reducing market noise around the average price. For calculations, the indicator uses iLow, iHigh, iMA and iATR. The output based on these reliable indicators is also reliable. You can set up a sound signal and notifications, for example by email. The indicator does not redraw and works stably.
Configura

Indicatorul ANDROMEDA
24 de ore - REDUCERE PREȚ! Profita!
Bun venit!
Indicatorul Andromeda este o creație nouă.
Acest indicator funcționează foarte bine pe H1.
Fiecare semnal asigură un profit cuantificat minim de 5, 10 sâmburi. Pentru profituri mai mari, se folosesc linii de rezistență, benzi TMA, Bollinger etc.
Singura problemă sunt știrile. Remediul pentru aceasta este Stop Loss.
Notă Este posibil ca acești indicatori pe care îi punem în vânzare să nu funcționeze pe anumite p

This indicator uses horizontal lines to identify support and resistance levels based on Zigzag legs and On-Balance Volume (OBV) analysis. Here is a summary of how the indicator works: Resistance and Support Lines : A horizontal line above the current price level indicates resistance. A horizontal line below the current price level indicates support. Drawing Horizontal Lines : Draw horizontal lines on every Zigzag leg within the last X legs, where X is a specified number (e.g., 10). Only the most
FREE

Support and Resistance Levels is an intelligent indicator that displays horizontal support and resistance levels, suitable for traders of different trading frequencies. You can select your preferred trading frequency, and the indicator will automatically calculate the support and resistance levels relevant to that frequency. Among these, the Bull-Bear Line is an interval used to distinguish the strength of bullish and bearish forces, and is an important level.
You can combine it with other in

Lyre Histogram
Greetings!
The Lyre Histogram indicator is created for the M15 and M5 intervals.
Note Este posibil ca acești indicatori pe care îi punem în vânzare să nu funcționeze pe anumite platforme. De câțiva ani, unele platforme cu noi versiuni MT4 nu afișează toți indicatorii personalizați.
O soluție la această problemă este să descărcați acești indicatori pe o altă platformă de la un alt broker sau să reveniți la o versiune mai veche a MT4.
Am avut această problemă cu indicat

Mysterium is a channel indicator without redraws, which is based on double smoothing of moving averages. Unlike channel indicators such as Bollinger, Mysterium uses double smoothed moving averages. This allows you to more accurately determine the direction of market movement, although it reduces the sensitivity of the indicator. However, double smoothing provides a clearer and more stable display of channels on the chart, which helps traders make informed trading decisions.

Volatility Range is an indicator that calculates the range of volatility, predicting key levels such as potential resistance above and potential support below. The indicator can display volatility forecast ranges for the latest 50 days, 10 weeks, or 4 months. By observing these ranges, you can better identify reliable levels where combining with price action enhances trade accuracy significantly.
You have the option to fill the rectangle area with color for easier observation, or leave it unf

The Candlestick Pattern Detector is an advanced MetaTrader 4 indicator designed to identify and highlight candlestick patterns on your charts. Currently, the indicator detects one specific candlestick pattern - the pinbar, known for its significance in technical analysis and trading strategies. This tool provides traders with visual cues, making it easier to spot potential market reversals or continuations. Features: Customizable Colors: Users can customize the colors of the bullish and bearish
FREE
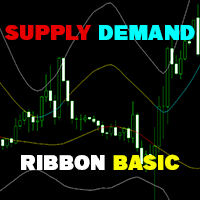
Supply Demand Ribbon is an indicator with moving supply and demand lines that help you identify price zones more easily. The indicator helps you determine flexible entry, stop loss, and take profit areas. There are also strategies for algorithmically changing ribbon colors. From there you can come up with many trading strategies for yourself! MT5 Version: Click here!
You can explore many feature in Advanced version here ! Feature in Basic version: Show 2 Supply/Demand Over lines. Sh
FREE

Price Action Scanner is an indicator that identifies price behaviors and provides alerts. This indicator can simultaneously detect signals for up to 6 different symbols across various timeframes. By setting a separator, you can add different symbol names and timeframes.
The indicator can detect multiple common signal types such as Pinbar, Engulfing Pattern, Inside Bar, Morning Star, Evening Star, Fakey, and display corresponding information in separate subcharts, indicating the direction of t

Price Action Scanner Pro is an indicator that identifies price behaviors and provides alerts, offering more features and customization compared to Price Action Scanner ( https://www.mql5.com/zh/market/product/118937?source=Site+Profile+Seller ) . This indicator can simultaneously detect signals for up to 15 symbols across different timeframes. You can configure it to detect signals during specific trading sessions such as Asian, European, and US sessions, using different timeframes. This
Working with the Channel Motion Tracker indicator is as simple as possible. Just react to the arrows that the indicator displays. Each arrow represents an explicit command to action. The signals generated by this indicator are accurate enough to allow you to trade based on this information.
One of the main advantages of the indicator is its ability to build high-quality channels and generate signals for entering the market. This is great for the trader who always finds it difficult to choose
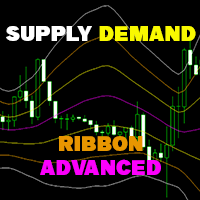
Supply Demand Ribbon is an indicator with moving supply and demand lines that help you identify price zones more easily.
The indicator helps you determine flexible entry, stop loss, and take profit areas.
There are also strategies for algorithmically changing ribbon colors.
From there you can come up with many trading strategies for yourself! You can try the Basic version here ! MT5 version: Click here! Feature in Advanced version: Hide/Show 2 Supply/Demand Over lines. Hide/Show 2

We mark the fair value gap (FVG) and wait for the price to reach that zone, but sometimes it reverses before getting there. This can happen because we didn't notice the Balanced Price Range (BPR). My tools will enhance your analysis by displaying everything on the chart, helping you identify potential price reversal areas so you can make informed decisions about when to enter the market. MT5 - https://www.mql5.com/en/market/product/119228/ So, what is BPR or Balanced Price Range? A Balanced Pr

The indicator is a T3 and Rsi based oscillator with color change.
The indicator repaints.
Check out my EA - I am Gold - https://www.mql5.com/en/market/product/119580
The values and colors can be changed as preferred.
Please play around with the settings to get better signals.
The fast line gives earlier signals but if you want confirmation wait for the cross or slow line to change color also.
Buy when lines is closer to the 20 line and sell closer to the 80 line.
Symbol: Any Time
FREE
CandleCloseCountdown is technically an indicator. Its purpose is to show the time a candle has left on a given timeframe before it closes. All possible time frames of MetaTrader 4 are supported. The way the remaining time is displayed depends on the selected timeframe. For M1 only the seconds are displayed. Above that at all timeframes up to H1 the remaining minutes and seconds are displayed and so on for timeframes above D1.
FREE

Product Description: Precision Pattern Indicator for Consistent Profits Elevate your trading with the Precision Pattern Indicator, an advanced tool designed to spot a highly profitable and specific trading pattern. This indicator is your key to unlocking consistent profits with minimal effort. Key Features: Accurate Entry Signals: Receive clear entry signals with green arrows for buy opportunities and red arrows for sell opportunities, ensuring you never miss a profitable trade. Defined Risk Man
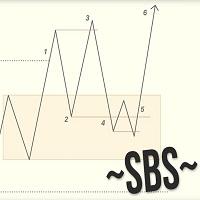
Swing Breakout Sequence | SBS presents a comprehensive trading strategy designed to help traders identify and capitalize on market swings and breakouts. The Swing Breakout Sequence (SBS) strategy is built around a series of well-defined steps to optimize trading decisions and improve profitability. Key Components of the SBS Strategy: Breakout Identification : The initial step involves identifying potential breakouts in the market. This is a crucial phase where traders look for key levels where t
123456789101112131415161718192021222324252627282930313233343536373839404142434445464748495051525354555657585960616263646566676869707172737475767778798081828384858687888990919293949596979899100101102103104105106107108109110111112113114115116117118119120121122123124125126127128129130131132133134135136137138139140
MetaTrader Mağaza, ticaret robotları ve teknik göstergelerin benzersiz bir deposudur.
Yatırımcılara sunduğumuz benzersiz hizmetler hakkında daha fazla bilgi edinmek için MQL5.community - Kullanıcı notunu okuyun: ticaret sinyallerini kopyalama, freelancerlar tarafından geliştirilen özel uygulamalar, ödeme sistemi aracılığıyla otomatik ödemeler ve MQL5 Bulut Ağı.
Ticaret fırsatlarını kaçırıyorsunuz:
- Ücretsiz ticaret uygulamaları
- İşlem kopyalama için 8.000'den fazla sinyal
- Finansal piyasaları keşfetmek için ekonomik haberler
Kayıt
Giriş yap
Gizlilik ve Veri Koruma Politikasını ve MQL5.com Kullanım Şartlarını kabul edersiniz
Hesabınız yoksa, lütfen kaydolun
MQL5.com web sitesine giriş yapmak için çerezlerin kullanımına izin vermelisiniz.
Lütfen tarayıcınızda gerekli ayarı etkinleştirin, aksi takdirde giriş yapamazsınız.