Смотри обучающее видео по маркету на YouTube
Как купить торгового робота или индикатор
Запусти робота на
виртуальном хостинге
виртуальном хостинге
Протестируй индикатор/робота перед покупкой
Хочешь зарабатывать в Маркете?
Как подать продукт, чтобы его покупали
Новые технические индикаторы для MetaTrader 4 - 122

Надежные сигналы разворота SMA. Не перерисовывается. Простые настройки. Подходит для бинарных опционов. Сделан для максимального удобства трейдера. Индикатор проводит комплексный анализ движения цены относительно SMA и отображает стрелку, за которой с большой вероятностью последует импульс цены и разворот SMA. Внутренние механизмы фильтрации отсеивают заведомо запоздавшие, ненадежные или неэффективные входы.
Настройки
SMA_PERIOD - период рассматриваемой SMA должен быть не меньше 24, по умолчани
Ценовое действие - одна из самых популярных концепций в торговле. Для торговли по ценовому действию крайне важны свечные паттерны. Свечной паттерн представляет собой ценовое действие в пределах одного или иногда нескольких баров, графически отображаемое на свечном графике, которое трейдеры используют в торговле.
Входные параметры On Alert - true/false, отображение уведомления в отдельном окне. Send Message - интервал для отправки сообщений: 5 минут / 15 минут / 30 минут / 1 час. Patterns Revers

" MONALISA (сокращение от MON itor A nd LIS t A ll) Stochastic" - это индикатор, основанный на Stochastic, применяемом на всех таймфреймах и на любой кросс-паре. Индикатор показывает все таймфреймы (от M1 до MN1) и отмечает зеленым и красным те таймфреймы, на которых осциллятор Stochastic показывает возможность открыть сделку на покупку или на продажу. Индикатор полезен тем, что предоставляет полное представление обо всех таймфреймах одновременно.
Особенности Гибкие настройки: Обнаружение сигна
" MONALISA (сокращение от MON itor A nd LIS t A ll) MACD" - это индикатор, основанный на MACD, применяемом на всех таймфреймах и на любой кросс-паре. Индикатор показывает все таймфреймы (от M1 до MN1) и отмечает зеленым и красным те таймфреймы, на которых осциллятор MACD показывает возможность открыть сделку на покупку или на продажу. Индикатор полезен тем, что предоставляет полное представление обо всех таймфреймах одновременно.
Особенности Гибкие настройки: Обнаружение сигнала MACD на всех та
" MONALISA (сокращение от MON itor A nd LIS t A ll) Bollinger Bands" - это индикатор, основанный на Bollinger Bands, применяемом на всех таймфреймах и на любой кросс-паре. Индикатор показывает все таймфреймы (от M1 до MN1) и отмечает зеленым и красным те таймфреймы, на которых осциллятор Bollinger Bands показывает возможность открыть сделку на покупку или на продажу. Кроме того, данный индикатор измеряет " силу " тренда, которая отображается выше средней линии индикатора Bollinger Bands (линия S

Индикатор ForexAurum Fibonacci полезен для трейдеров, которые используют уровни Фибоначчи в сочетании с индикаторами ZigZag. Он вычисляет уровни для всех таймфреймов в режиме реального времени и отображает результаты. Кроме того, вы можете настроить индикаторы RSI, ADX и Stochastic для подтверждения входов.
Инструкция по применению Просто перетащите индикатор на минутный график любого символа. Затем вы можете переключиться на более высокий таймфрейм в любое время после инициализации.
Рекоменда

Принципы работы Разработан на основе стандартных индикаторов терминала MetaTrader 4. Показывает точки входа в рынок.
Как торговать При появлении сформировавшегося бара со стрелкой установить BuyStop на High бара при зеленой стрелке, SellStop на Low бара при красной стрелке. StopLoss на уровне последнего фрактала вниз ниже точки входа при зеленой стрелке, последний фрактал вверх выше точки входа при красной. Для этого установить на график индикатор Fractals. Если фрактал не сформирован ордер не

NN8D Volume - один из индикаторов, которые входят в Торговую Систему NN8D ( N ikolsky's N esting D oll - Матрешка Никольского). NN8D Volume является индикатором, который показывает направление движения тренда, при этом фильтруя шум рынка и удерживая в сделке даже в коррекциях основного тренда. Чеклист на покупку (Buy): Bulls на текущем баре и желательно на предыдущем. Линия NN8D Volume должна идти вверх, отдаляясь от точек Bulls , показывая бычий тренд и повышение волатильности. Текущий бар - Bu

Вы уже устали от постоянных взлетов и падений? Не стоит становится жертвой неустойчивых движений рынка … Пора уже как-то от этого избавиться! Уже сейчас вы можете воспользоваться умными решениями Impulse Pro, чтобы сбалансировать фильтры и получить точную статистику.
В трейдинге время решает все
Если вы хотите узнать больше, посетите www.mql5.com/en/blogs/post/718212 Выполните три простых шага, и вы сможете прогнозировать неожиданные движения на рынке!
Преимущества
Быстрый алгоритм определен

Индикатор автоматически вычисляет уровни точек разворота (пивотов) и отображает линии на графике. Отображаемые линии: Pivot, R1, R2, R3, S1, S2 и S3. Значение уровня отображается под каждой линией. Точка пивота рассчитывается обычным способом. Цвета линий, а также шрифт и размер текста настраиваются. Индикатор может использоваться на таймфреймах D1 и меньше.
Параметры Font color - цвет текста. Font size - размер шрифта. Color line resistance - цвет линии сопротивления. Color line support - цвет

Это инструмент, помогающий не только торговать по методике VSA (Volume Spread Analysis) и PRICE ACTION, но и изучать в разрезе данные методы. Индикатор ищет на графике паттерны VSA и PRICE ACTION с учетом текущего тренда. Есть возможность просматривать паттерны старшего таймфрейма на графике текущего периода. Пользовательский режим дает возможность находить свои паттерны и закономерности рынка на основе метода VSA. Также имеется гистограмма объемов с автоподстройкой толщины и визуальными горизон

Инструмент предназначен для расчета размера позиции, которую можно открыть согласно установленному риску. Риск можно определить как: процент от счета (%), номинальное значение валюте счета. Размер позиции определяется расстоянием от запланированного SL (красная линия).
Входные параметры Lost_in_Money - при true значение допустимого убытка задается параметром "Acceptable_loss", в противном случае допустимый убыток определяется параметром "Acceptable_Risk_Perc". Acceptable_loss - допустимый убыто
Инструмент для технического анализа. Позволяет делать измерения: Уровни Фибоначчи, включая поиск кластеров уровней Фибоначчи (методом ДиНаполи) Перевес Трендовая линия Отображение уровней спроса/предложения
Входные параметры Trend_Color - цвет трендовой линии Trend_Width - толщина трендовой линии Trend_info - при true рядом с трендовой линией отображается дополнительная информация (минимальное, максимальное среднее значения трендовой линии) Trend_info_color_up_dn - цвет текста для описания трен

Индикатор Blahtech Moving Average - модифицированная версия стандартного индикатора Moving Average. Он также дополнен настраиваемыми оповещениями, разделителями периодов и другими возможностями настройки. 50-дневная и 200-дневная скользящие средние широко применяются инвесторами и трейдерами, а прорывы вверх и вниз от линий MA считаются значимыми сигналами.
Основные особенности До трех таймфреймов Настраиваемые переменные для вычислений Настраиваемые оповещения и сообщения Дополнительные период
FREE

Market Insider - отличный индикатор для скальпинга по тренду, а также для торговли по прорывам и разворотам рынка. Он основан на канале волатильности, измеряемом в ATR , и на индикаторе CCI . Зеленая трендовая линия и зеленые бары указывают на восходящий тренд, а красная трендовая линия и красные бары указывают на нисходящий тренд. Интенсивный ценовой прорыв некоторых трендовых линий указывает на прорыв рынка и потенциальное появление противоположного тренда. В условиях неустойчивости рынка и ни
FREE

Индикатор Analytic Trade - это полноценная торговая система. Он состоит из 4 частей: Первая - это стрелочки, показывающие наиболее оптимальные точки открытия и закрытия ордеров. Стрелка вверх - сигнал на покупку, вниз - на продажу. Вторая - это информационная панель в правом верхнем углу. Крупным шрифтом обозначена текущая цена, над ней показаны: максимум дня, расстояние от текущей цены до него и разность максимума и минимума (в пунктах). Под ней расположены: минимум дня, расстояние до минимума,

ForexGumpUltra - это новый, более усовершенствованный индикатор линейки ForexGump. Данный индикатор легко справляется с определением направления цены на любой валютной паре и любом таймфрейме. Свои сигналы индикатор рисует на нулевом баре и не перерисовывает их (смотрите на видео). На 34 секунде видео видно, что данный индикатор используя новые фильтры, без запаздывания определяет изменение направления движения цены, даже несмотря на рыночный шум, который в тот момент присутствовал (смотрите вид
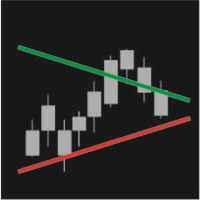
Индикатор IntradayTrack отображает на графике цены дневные линии поддержки и сопротивления, основанные на средней волатильности инструмента за определенный период. В индикаторе имеется возможность наклона линии на определенный угол как в начале торгового периода, так и в конце.
Параметры Track period - период отрисовки линий (день, неделя, месяц) Avg price range – количество дней, за которые считается средняя волатильность Start value (Avg %) – расстояние, на котором будут находиться друг от др

Trend-Scanner - это индикатор для MetaTrader 4 , который отображает 3 типа трендов и сигналы на графике. Trend-Scanner ищет 3 типа торговых сигналов на всех базовых активах, перечисленных в настройках (настраивается пользователем). При появлении условий, позволяющих идентифицировать надежные тренды, будут отображены всплывающие оповещения, звуковые и push-уведомления. Trend-Scanner постоянно ищет сигналы по паттернам от We-Trading, которые основаны на индикаторе Ichimoku kynko Hyo . Это не прогр

Этот индикатор основан на Bollinger Bands, применяемом на одном или нескольких таймфреймах и на любой кросс-паре. При обнаружении сигнала на покупку или на продажу индикатор отображает всплывающее оповещение. Он также рисует вертикальную полосу на ценовом графике: зеленый для покупки, красный для продажи, белый для флета. Всплывающие сообщения и вертикальные полосы отображаются для сигналов BUY или SELL, когда значения Bollinger Bands согласованы на всех выбранных таймфреймах , в противном случа

PriceChannel предназначен для обнаружения тренда без влияния случайных скачков цен. Он использует ценовые ряды и несколько скользящих средних для снижения шума. Он работает на нескольких таймфреймах, даже M1. Для эффективности рекомендуется запускать 3 копии PriceChannel с разными параметрами на одном графике (смотрите скриншоты). Вы можете использовать следующие настройки (для графиков M1): PriceChannel(10,2,30) золотого цвета. PriceChannel(10,5,30) синего цвета. PriceChannel(21,8,13) серого ц
Принцип этого индикатора очень прост: определение тренда с помощью скользящей средней. Затем отслеживается точки разворота с помощью пересечения Стохастика. Затем индикатор прогнозирует сигналы на покупку и продажу с помощью стрелок, предупреждений и уведомлений. Параметры фиксированы, автоматически рассчитываются для каждого таймфрейма. Пример:
Если установить индикатор на EURUSD с таймфреймом M5, индикатор определит тренд скользящей средней на этом таймфрейме (допустим, скользящая средняя пока

Omega Trend Indicator - передовой инструмент, специально разработанный для раннего обнаружения рыночных трендов, а также для эффективного следования за ними. Индикатор строит две линии. Основная (толстая) трендовая линия показывает предполагаемые нижние или верхние пределы волатильности текущего рыночного тренда. Разрыв основной линии тренда указывает на потенциальный разворот или изменение движения тренда. Трендовая линия также указывает наилучшую точку для размещения стоп-лосса. В индикаторе O
FREE

We-Point — индикатор для MT4, помогающий пользователям анализировать графики и находить точки ускорения тренда.
We-Point — полезный инструмент для трейдеров, которым нужно знать направление базового тренда. Индикатор We-Point использует математическую формулу и на основе нее строит точки красного (медвежий тренд) и зеленого (растущий тренд) цвета. При появлении на графике зеленой (или красной) точки трейдер получит уведомление (всплывающее сообщение или push). Индикатор We-Point можно использов

Индикатор для анализа взаимосвязей между двумя производными финансовыми инструментами. Существуют различные методы представления взаимосвязей. Представленное видео показывает всю функциональность индикатора.
Входные параметры Anchor_mode - учитывать текущую свечу в измерениях. Follow_mode - при true точка начала измерений (линия START) следует за точкой окончания (линия END) на фиксированном расстоянии. Follow_distance - расстояние (в свечах) между точкой начала и точкой окончания измерения. Ра
Индикатор позволяет измерять и анализировать накопленный объем (тиковый) в любом выбранном диапазоне. Задача пользователя — отметить зоны для измерения с помощью "карандаша". Индикатор автоматически суммирует объемы отдельных свечей. Анализ объема является основным элементом анализа VSA (Volume Spread Analysis). На видео показан способ использования индикатора.
Описание параметров Anchor_mode - если true, один конец линии измерения всегда привязан к текущей свече; AutoDivider - если true, значе

Индикатор Blahtech Fisher Transform представляет собой осциллятор, который отображает графике области перекупленности и перепроданности. Алгоритм преобразования Фурье (Fisher Transform) преобразует цены с любой формой распределения в нормальное распределение. Конечным результатом является кривая с резкими точками разворота, которые могут помочь определить бычьи или медвежьи тренды. Значения Fisher Transform выше 1.6 на дневном графике считаются хорошими областями для сделок на разворот.
Основны

Индикатор Viper Trend предназначен для нахождения трендов. Для поиска трендов он использует скользящую среднюю, набор свечных моделей и уровни High/Low. Этот индикатор является полноценной торговой системой. Вы можете торговать с этим индикатором на свое усмотрение.
Особенности и рекомендации Индикатор можно использовать на всех парах, кроме волатильных. Рекомендуется запускать на графиках с таймфреймом M15 и выше. Наиболее важным элементом этого индикатора являются уведомления. Не открывайте о

PivotSupportResistance Индикатор отрисовывает горизонтальные линии на уровнях дневных пивотов R3, R2, R1, Pivot, S1, S2, S3, где R - сопротивление, а S - поддержка. Индикатор работает на любому таймфрейме, но дневные пивоты на графиках больших таймфреймов не имеют смысла (если вы установите таймфрейм графике больше D1, индикатор не будет работать и сработает алерт). Последние дневные уровни отмечаются значками. Входных параметров нет, индикатор прост в использовании. Перед запуском индикатора на

Стрелочный индикатор, использующий настраиваемые Parabolic SAR и EMA для трендовых рынков . Отображает формирование и продолжение тренда, позволяя захватывать длинные тренды или вести скальперскую торговлю. Предназначен для: Скальпинга Внутридневной торговли Долгосрочной торговли Эффективен для: Валютных пар Индексов Нефти Серебра Золота Криптовалют Рекомендуемые таймфреймы: H1 H4 Daily Weekly Monthly Для младших таймфреймов требуется регулировка настраиваемых параметров. Проведите тестирование,

Этот мультииндикатор / осциллятор (далее индикатор), мульти-таймфрейм и мультисимвольный индикатор определяет, когда происходит расхождение между ценой и одним, двумя или тремя индикаторами. Он определяет как обычные / классические (разворот тренда), так и скрытые (продолжение тренда) дивергенции. Он имеет опции фильтра тренда RSI и MA, что позволяет отфильтровать только самые сильные настройки. В сочетании с вашими собственными правилами и методами этот индикатор позволит вам создать (или улучш

Индикатор вертикальных уровней работающий на таймфреймах М5 и М1. Разлиновывает период текущего дня и дня прошедшего. Данный индикатор наглядно покажет трейдеру, начало и конец часа текущего, также прошедших часовых периодов, тридцати минут и пятиминутных интервалов графика. Преимущество работы с данным индикатором в том, что трейдер, добавив индикатор на график валютной пары с включенным младшим таймфреймом, всегда будет в курсе того, где начнётся новый час.
О понятии времени и таймфрейм
Всем
FREE
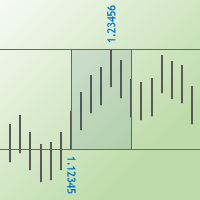
Индикатор Max Min Prices One определяет максимальную и минимальную цены между двумя свечками и показывает их в виде прямоугольника на ценовом графике. Вы также можете показать значения цен и их уровни в виде горизонтальных линий.
Параметры
Start bar time – время начальной свечки End bar time - время конечной свечки Rectangle filling - заливка прямоугольника цветом Is show max and min prices - показать метки максимальной и минимальной цены Is show horizontal lines - показать уровни максимальной

Ещё один простой информационный индикатор. Данный индикатор показывает текущий спред по валютному инструменту и стоимость одного пункта объёмом 0,10 лота.
О понятии Cпред Спред (от английского слова spread «разброс») — разница между ценами на покупку (Ask) и на продажу (Bid) какого-либо актива на фондовой или валютной бирже. Чтобы разобраться, что такое Spread и как он важен для торговли на валютном рынке, вспомним Центральные Банки и обмен валюты в них. Там мы всегда видим разницу между ценой
FREE

Bollinger Bands Oscillator - это осциллятор, основанный на стратегии Джона Картера "Мастерство в торговле" (Mastering the Trade). Стратегия направлена на отслеживание движений от низкой к высокой волатильности. Bollinger Bands Oscillator измеряет импульса рынка. С увеличением волатильности полосы Боллинджера становятся шире и окружают канал Кельтнера. Bollinger Bands Oscillator использует полосы Боллинджера и канал Кельтнера. Для подтверждения сигналов на открытие позиций также используется инди

Jerus Line Scalper - индикатор для скальпирования по парам EURUSD, GBPUSD, AUDUSD, USDJPY, USDCAD. Рекомендуемые таймфреймы M5, M15, M30, H1. Стратегия торговли следующая: как только появляется стрелка, мы открываем ордер в направлении стрелки и выставляем тейк-профит на уровне +10 пунктов. Стоп-лосс выставляем на уровне стоп-линии индикатора. Стоп-линия отображается красным или синим цветом в зависимости от сигнала индикатора. Также в данной системе можно применять стратегию Мартингейла. Если с
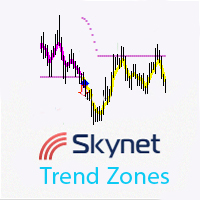
Этот индикатор отображает возможные точки входа в рынок с push-уведомлениями. Он основан на классических индикаторах и некоторых математических вычислениях и работает в разных условиях на рынке. Принцип работы заключается в следующем: если цена двигается в диапазоне, то показывается ровная линия ниже или выше цены в зависимости от предыдущего тренда; если цена двигается вниз или вверх без отката, показывается линия под углом к цене, а при возникновении небольшого отката линия индикатора строится

Этот индикатор основан на MACD, применяемом на одном или нескольких таймфреймах и на любой кросс-паре. При обнаружении сигнала на покупку или на продажу индикатор отображает всплывающее оповещение. Он также рисует вертикальную полосу на ценовом графике: зеленый для покупки, красный для продажи, желтый для флета. Всплывающие сообщения и вертикальные полосы отображаются для сигналов BUY или SELL, когда значения MACD согласованы на всех выбранных таймфреймах , в противном случае формируется сигнал
Свечной индикатор, который находит на графике свечи, на которых совпадают направления всех свечей, на выбранных вами таймфреймах (M1, M5, M15, M30, H1, H4, D1, W1, MN). К примеру везде растущие свечи (бычьи) или везде падающие свечи (медвежьи). Вы можете: Выключить отображение всех лишних стрелок и оставить, к примеру, только те, которые показывают смену направления сигнала, то есть только первую стрелку в каждое из направлений; Указать, с какой свечи брать сигнал: с нулевой или с уже сформирова

Индикатор Fibonacci Target работает на основе уровней Low, High и Фибоначчи. Этот индикатор способен прогнозировать целевые уровни. Он старается определить целевой уровень, к которому в среднем стремится цена, и рисует целевую зону. Индикатор также служит в качестве осциллятора. Может использоваться в качестве трендового осциллятора после внесения необходимых настроек. Этот индикатор будет полезен для вашей стратегии. Нет возможности генерации сигналов.
Параметры TargetPeriod - период линии цел

Triple предоставляет три отличных индикатора в одном: Индекс товарного канала (Commodity Chanel Index, CCI) 3 экспоненциальные скользящие средние (Exponential Moving Average, EMA) Индекс относительной силы (Relative Strength Index, RSI).
Как работает индикатор Индикатор строит сетку из трех разных индикаторов и помещает их на шкале от красного (медвежий) до темно-зеленого (бычий). Отображаются простые и понятные значения 5 индикаторов при помощи отдельных цветов. Dark Green - сильный бычий Ligh
Индикатор Chart Time + очень прост, но он может быть очень важным помощником для контроля времени перед открытием сделки вручную. В индикаторе есть три варианта отображения времени на панели. Панель можно переместить при помощи мыши или фиксированных координат на графике.
Входные параметры Show Time : выбор вариантов отображения времени. Local Time (локальное время компьютера), Server Time (время сервера брокера) или GMT. Refresh Time : обновление данных по тикам (на каждом новом тике) или обно

Signal Bands - производящий глубокую статистическую обработку информации, чувствительный и удобный индикатор, позволяющий на основном графике сразу увидеть и (1) саму тенденцию движения цены и (2) ее четкий канал и (3) еще латентные признаки изменения этой тенденции. Индикатор можно использовать на графиках любых масштабов, но, из-за своей повышенной чувствительности к текущему состоянию рынка, он особенно полезен для скальпинга.
Функции, выполняемые индикатором : Во первых, индикатор Signal Ba

Индикатор показывает последние нетронутые уровни поддержки и сопротивления в виде горизонтальных линий. Индикатор может показывать уровни поддержки/сопротивления с более высоких таймфреймов. С помощью данного индикатора вы легко можете увидеть уровни поддержки/сопротивления с таймфреймов H4, D1 и W1 на графике H1, что может быть большим преимуществом при поиске возможностей входа на H1. Это бесплатная версия индикатора: Support Resistance Multi Time Frame Бесплатная версия работает только на EUR
FREE

Это индикатор «круглых уровней» с модулем Торговой Системы, основанной на сценариях рынка возле психологически значимых «рыночных цен». Визуализируя торговые уровни SL, TP и моделируя сделки при их взаимодействии с ценами OHLC, модуль собирает статистику за указанный период и строит в интерфейсе на её основе «кривую доходности», что позволяет контролировать ожидаемую прибыльность торговых сигналов.
Торговая система В основе алгоритма - торговая система The Elementary, Watson! ( EW ) для GBPUSD

Простой информационный индикатор показывающий название текущего дня и прошлых рабочих дней, месяцев и лет.
О понятии времени и таймфрейм Всем известно что Таймфрейм - это промежуток времени, рассматриваемый в техническом анализе свободных финансовых рынков, в течение которого происходит изменение цен и иных рыночных данных, в период построения ценовых графиков. В торговом терминале MetaTrader 4 данные периоды разделены вертикальными пунктирными линиями, включить и отключить которые можно просты
FREE

Индикатор показывает последние нетронутые уровни поддержки и сопротивления в виде горизонтальных линий. Индикатор может показывать уровни поддержки/сопротивления с более высоких таймфреймов. С помощью данного индикатора вы легко можете увидеть уровни поддержки/сопротивления с таймфреймов H4, D1 и W1 на графике H1, что может быть большим преимуществом при поиске возможностей входа на H1. Это полная версия индикатора: Support Resistance Multi Time Frame FREE
Параметры referenceTF: таймфрейм для р

Реализация известного индикатора SuperTrend. Индикатор позволяет увидеть значения, на которых срабатывают оповещения индикаторов SuperTrend Scanners:
SuperTrend Scanner SuperTrend Scanner FREE
Параметры SuperTrendATRPeriod: период для расчета значения SuperTrend SuperTrendMultiplier: множитель для расчета значения SuperTrend
FREE

Данный сканер показывает значения тренда известного индикатора SuperTrend для множества инструментов (до 30) и 8 таймфреймов. Уведомляет о смене направления тренда в терминале MetaTrader 4, по email и push-уведомлением. Это бесплатная версия индикатора SuperTrend Scanner Бесплатная версия работает только на EURUSD и GBPUSD!
Важная информация Для максимального использования потенциала сканера прочитайте полное описание (на английском языке): www.mql5.com/en/blogs/post/718074
Бесплатная версия п
FREE

Данный сканер показывает значения тренда известного индикатора SuperTrend для множества инструментов (до 30) и 8 таймфреймов. Уведомляет о смене направления тренда в терминале MetaTrader 4, по email и push-уведомлением.
Важная информация Для максимального использования потенциала сканера прочитайте полное описание (на английском языке): www.mql5.com/en/blogs/post/718074
Есть различные способы использования сканера SuperTrend Scanner. Вот два примера: Сканера позволяет легко торговать сверху вн

Индикатор визуально показывает пересечение двух скользящих средних в осцилляторе MACD. И сигнализирует цветом гистограммы, о пересечении нулевого уровня индикатора, скользящими средними. Сам индикатор MACD (Moving Average Convergence/Divergence) – популярный осциллятор, который трейдеры активно задействуют при работе на валютных и фондовых рынках для определения тенденций и поиска торговых сигналов. Вообще – это сокращение для термина "схождение/расхождение скользящей средней" . С помощью данног

Индикатор Automatic Fibonacci with Alerts автоматически отображает уровни коррекции Фибоначчи на основе количества баров, указанного в параметре BarsToScan. Уровни обновляются автоматически в режиме реального времени при появлении новых максимумов и минимумов среди выбранных баров. В настройках индикатора можно выбрать, какие значения уровней надо отобразить. Также в параметрах индикатора можно выбрать цвета уровней - это позволяет установить на графике несколько индикаторов с различными настрой

DotaScalping - это полуавтоматическая торговая система для скальпинга. В виде точек на графике показывает рекомендуемые моменты для открытия сделок на покупку / продажу. Сигналы генерирует на основании алгоритма сглаживания ценовой амплитуды. Индикаторы пытается точно вычислять моменты максимальных пиковых значений цены и давать трейдеру сигналы на основании сглаженной корреляции. То есть, индикатор определяет максимальное и минимальное значение цены и в зависимости от направления тренда, дает с
Осцилятор, очень хорошо показывает точки разворота и мощность движения. Может использоваться на любом инструменте любого ТаймФрейма. Оснащен параметром уровня достижения необходимой мощности сигнала. Индикатор очень прост в настройках и бары не перерисовывает.
Описание параметров PeriodPower - период расчета мощности сигнала LevelPower - задаваемый уровень сигнала
Relative Charts отображает график возврата к среднему значению с использованием скользящей средней в качестве опорного индикатора, эффективно сглаживая меняющееся значение фиатной валюты. Взгляд на рынок с точки зрения среднего значения Легко обнаруживаются зоны перекупленности/перепроданности Внимание трейдера не отвлекается на меняющуюся стоимость фиатных валют Центральная линия отображает скользящую среднюю Работа с индикатором ограничена только вашим воображением Настраиваемые период графика
Информационная панель Williams Dashboard помогает получить глобальную оценку рынка на основе значений Williams Percent Range. Панель Williams Dashboard анализирует и отслеживает все выбранные вами инструменты. Это очень полезная панель, которая позволяет открыть любой график за несколько секунд и совершить сделку.
Основные функции панели Williams Dashboard Графическая панель, которая позволяет оценить ситуацию на множестве инструментов. 7 различных ситуаций по диапазону Williams Percent Range,

Информационная панель CCI Dashboard помогает получить глобальную оценку рынка на основе значений Commodity Channel Index. Панель CCI Dashboard анализирует и отслеживает все выбранные вами инструменты. Это очень полезная панель, которая позволяет открыть любой график за несколько секунд и совершить сделку.
основные функции панели CCI Dashboard Графическая панель, которая позволяет оценить ситуацию на множестве инструментов. 7 различных ситуаций по значению Commodity Channel Index, которые позвол

Введение Индикатор Harmonic Volatility стал первым техническим инструментом, использующим уровни Фибоначчи для анализа волатильности на рынке. Индикатор объединяет коэффициенты Фибоначчи (0.618, 0.382 и т.д.) с торговой волатильностью. Изначально индикатор Harmonic Volatility разрабатывался как способ преодолеть ограничение и слабые стороны угла Ганна, также известного как "Веер Ганна". Мы продемонстрировали, что индикатор Harmonic Volatility можно использовать на графике аналогично углу Ганна (
Stochastic Dashboard – информационная панель, дающая вам глобальное видение рынка с помощью стохастика. Stochastic Dashboard анализирует и отслеживает все активы, с которыми вы работаете. Панель позволяет открыть график за несколько секунд и начать работу в нем.
Главные особенности Графическая панель, которая позволяет вам просмотреть ситуацию на многих активах. Семь разных стохастиков для определения перекупленности/перепроданности актива. Оповещения, письма и уведомления, которые позволяют ис

Индикатор Pattern Detector находит наиболее популярные свечные паттерны из 1, 2 и 3 свечей и отправляет уведомления при их нахождении. Демо-версия, работающая на AUDNZD, доступна по ссылке: https://www.mql5.com/ru/market/product/29189
Принципы работы Прикрепите индикатор на график, который хотите проанализировать, и выберите паттерны, которые нужно найти. Индикатор будет отображать найденные паттерны. Также индикатор может отправлять уведомления о найденных паттернах в терминал, на мобильный те
FREE

Индикатор круглых уровней. Диапазон значимых цен, со звуковым и текстовым уведомлением, что текущая цена Bid валютной пары равна круглому числу. Данный индикатор наглядно покажет трейдеру истинные уровни поддержки и сопротивления от которых работаю большинство трейдеров и торговых роботов. Преимущество работы с данным индикатором в том что Трейдер добавив индикатор на график практически не нуждается в построении дополнительных уровней. Круглые ценовые уровни представляют собой определенную прегр
Индикатор Pattern Detector находит наиболее популярные свечные паттерны из 1, 2 и 3 свечей и отправляет уведомления при их нахождении. Демо-версия работает только на паре AUDNZD. Полная версия продукта: https://www.mql5.com/ru/market/product/29190
Принципы работы Прикрепите индикатор на график, который хотите проанализировать, и выберите паттерны, которые нужно найти. Индикатор будет отображать найденные паттерны. Также индикатор может отправлять уведомления о найденных паттернах в терминал, на
FREE

Индикатор MQLTA Candle Timer отображает информацию о символе/паре и отправляет уведомления перед закрытием свечи. При использовании свинговой и других типов торговли он может помочь подготовить ваши стратегии к закрытию свечи.
Принципы работы Просто установите индикатор на график и задайте параметры уведомлений. Вы можете применить минималистичный или полный интерфейс. Оповещения будут отправляться один раз за свечу.
Параметры Все параметры, представленные на рисунках, интуитивно понятны. Если
FREE

Симулятор для расчета соотношения риска к вознаграждению We-RiskReward — это индикатор для MetaTrader 4 от команды We-Trading, позволяющий симулировать ордер с расчетом соотношения риска к вознаграждению.
Горизонтальные линии Индикатор отображает 3 горизонтальные линии: Линия открытия Линия тейк-профита Линия стоп-лосса При перемещении этих линии вы будете видеть расчет соотношения риска к вознаграждению и лота в реальном времени. Индикатор можно использовать для имитации длинных и коротких поз
FREE
Индикатор основан на Ichimoku kynko Hyo, но с правилами We-Trading.
Стрелки Ichi-Trend Индикатор отображает два типа стрелок (сигналов): Большие стрелки для следования за крупными трендами Маленькие стрелки для повторного входа по тренду (увеличения числа сделок) Ichi-Trend indi позволяет вам следовать за трендом. Вы можете использовать его на форексе и CFD на любом таймфрейме.
Параметры Основные параметры для установки значения Ichimoku: tenkan_sen - по умолчанию 9 kijun_sen - по умолчанию 26
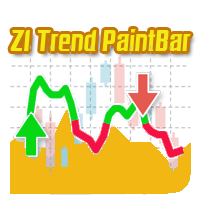
Трендовый индикатор на основе индикатора CCI. ZI Trend PaintBar Indicator — это улучшенный вариант индикатора CCI, которые довольно точно показывает продолжение тренда. В сочетании с CCI позволяет лучше использовать эти преимущества: цветные свечи показывают направление тренда на основе индикатора CCI. Messages/Sounds (блок уведомлений и звуковых настроек) Mail - включить/отключить отправку сообщений по электронной почте. Alerts - включить/отключить сообщения в терминале при появлении сигналов.

Индикатор вычисляет и рисует линии на графике. Два типа тренда: Тренд A: линия отрисовывается по локальным минимумам для восходящих трендов и по локальным максимумам - для нисходящих. Тренд Б: линия отрисовывается по локальным максимумам для восходящих трендов и по локальным минимумам — для нисходящих. Нужно, чтобы ситуация полностью удовлетворяла нескольким условиям, которые можно настроить во входных параметрах (см. также рис. 4): MinBarAge : количество баров до последней базовой точки линии н
FREE

Система SFO Trend Racer является трендовым индикатором, созданным генеральным директором и основателем " Simple Forex Options ", Тевином Маршаллом ( Tevin Marshall ). Он способен выполнять 6 различных функций. Он показывает сигналы на вход, а также сигналы на выход, будь то тейк-профит или стоп-лосс. Он также использует трендовые фильтры и подтверждение сигналов, чтобы трейдер смог принять наиболее логически обоснованное решение. Trend Racer использует различные фильтры и конкретные настройки из
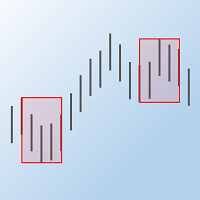
Индикатор "Max Min Prices" определяет максимальные и минимальные цены между двумя свечками внутри торгового дня и показывает их в виде прямоугольников на ценовом графике.
Параметры индикатора Start hour – час начальной свечки Start minute - минута начальной свечки End hour – час конечной свечки End minute - минута конечной свечки Rectangle lines type - стиль линий прямоугольника Rectangle lines width - толщина линий прямоугольника Rectangle filling - заливка прямоугольника цветом Colour - цвет

Сканер показывает значения тренда на основе пересечения двух скользящих средних. Значения отображаются на нескольких символах (до 30) и 8 таймфреймах. Уведомляет о смене направления тренда в терминале MetaTrader 4, по email и push-уведомлением. Это бесплатная версия индикатора: https://www.mql5.com/ru/market/product/29159
Важная информация Для максимального использования потенциала сканера прочитайте полное описание (на английском языке): www.mql5.com/en/blogs/post/718074
Есть различные способ
FREE
MetaTrader Маркет предлагает каждому разработчику торговых программ простую и удобную площадку для их продажи.
Мы поможем вам с оформлением и подскажем, как подготовить описание продукта для Маркета. Все продаваемые через Маркет программы защищаются дополнительным шифрованием и могут запускаться только на компьютере покупателя. Незаконное копирование исключено.
Вы упускаете торговые возможности:
- Бесплатные приложения для трейдинга
- 8 000+ сигналов для копирования
- Экономические новости для анализа финансовых рынков
Регистрация
Вход
Если у вас нет учетной записи, зарегистрируйтесь
Для авторизации и пользования сайтом MQL5.com необходимо разрешить использование файлов Сookie.
Пожалуйста, включите в вашем браузере данную настройку, иначе вы не сможете авторизоваться.