Смотри обучающее видео по маркету на YouTube
Как купить торгового робота или индикатор
Запусти робота на
виртуальном хостинге
виртуальном хостинге
Протестируй индикатор/робота перед покупкой
Хочешь зарабатывать в Маркете?
Как подать продукт, чтобы его покупали
Новые технические индикаторы для MetaTrader 4 - 30

** All Symbols x All Timeframes scan just by pressing scanner button ** *** Contact me after the purchase to send you instructions and add you in "Head & Shoulders Scanner group" for sharing or seeing experiences with other users. Introduction: Head and Shoulders Pattern is a very repetitive common type of price reversal patterns. The pattern appears on all time frames and can be used by all types of traders and investors. The Head and Shoulders Scanner indicator Scans All charts

MetaForecast предсказывает и визуализирует будущее любого рынка на основе гармонии в данных о ценах. Хотя рынок не всегда предсказуем, если существует узнаваемый паттерн в ценах, то MetaForecast способен предсказать будущее с наибольшей точностью. По сравнению с другими аналогичными продуктами, MetaForecast способен генерировать более точные результаты, анализируя тренды на рынке.
Входные параметры Past size (Размер прошлых данных) Указывает количество баров, которые MetaForecast использует дл

Добро пожаловать в наш ценовой волновой паттерн MT4 --(ABCD Pattern)-- Паттерн ABCD является мощным и широко используемым торговым паттерном в мире технического анализа.
Это гармонический ценовой паттерн, который трейдеры используют для определения потенциальных возможностей покупки и продажи на рынке.
С помощью паттерна ABCD трейдеры могут предвидеть потенциальное движение цены и принимать обоснованные решения о том, когда открывать и закрывать сделки. Версия советника: Price Wave
FREE

MT5 версия | FAQ | Советник Universal Breakout Universal Box строит на графике ценовые диапазоны , которые в дальнейшем можно использовать для торговли на пробой ценового диапазона. Есть довольно много стратегий, с которыми вы можете применить этот индикатор. Индикатор по умолчанию настроен так, чтобы отмечать на графике диапазоны Азиатской, Европейской и Американской торговых сессий . Диапазоны строятся в виде прямоугольников, границы которых это время начала и конца торговой сессии, а также
FREE

ИНДИКАТОР ЛИНЕЙНОЙ РЕГРЕССИИ Индикатор представляет собой Линию Линейной Регрессии и линии поддержки и сопротивления, полученные на основе стандартного отклонения относительно Линейной Регрессии. Настраиваемые параметры:: Rango Tendencia: количество баров или периодов, рассматриваемых в качестве ссылки для индикатора.. AmpDesv: амплитуда или количество раз, учитываемых стандартным отклонением линейной регрессии для ее представления. Colores: возможность выбора цветов из палитры для представлени

В Clock GMT Live есть все, что вам нужно, чтобы узнать больше о нашем брокере, много раз вы задавались вопросом, на каком GMT я нахожусь или над каким GMT работает мой брокер, что ж, с помощью этого инструмента вы сможете узнать в режиме реального времени как GMT смещение времени брокера и вашего местного времени, вы также будете постоянно знать пинг брокера Просто поместив его на время суток, вы можете получить информацию
Цена увеличивается за каждое приобретение, с этим мы защитим, чтобы не
FREE
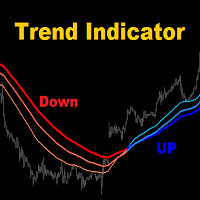
MA3 Trend – это хороший трендовый индикатор на трех МА.
Преимущества индикатора: Индикатор выдает сигналы с высокой точностью.
Подтвержденный сигнал индикатора не исчезает и не перерисовывается.
Торговать можно на торговой платформе MetaTrader 4 любого брокера.
Торговать можно любыми активами (валюты, металлы, крипто валюты, акции, индексы и т.д.).
Торговать можно на любых таймфреймах (M5-M15 скальпинг и дейтрейдинг / М30-Н1 среднесрочная торговля / Н4-D1 долгосрочная торговля).
Инд
FREE

MT5 Version Order Blocks ICT Kill Zones SMT Divergences ICT Breakers
The ICT Breakers indicator is a powerful tool for traders looking to gain an edge in the market. This indicator is based on the order flow and volume analysis, which allows traders to see the buying and selling pressure behind the price action. This information can be extremely valuable in identifying key levels of support and resistance, as well as potential turning points in the market. Breaker blocks are areas where i

Indicator customers will get Ea based on Fiter indicator for free as a Bonus. (watch video to see Ea in action) Fiter is EMA+ATR*RSI hibrid yellow line combined with Moving average red line, cross of which gives much smoother results than two simple Ma cross usage in trading. Effectiveness is proven by backtest and comparison with two simple Ma crosses. History shows that this method Fits with different market conditions and it can be boldly used in real manual trading for determining big trend

The most Flexible & Reliable Trend-Based Fibonacci indicator by Safe Trading. This indicator helps you calculate Trend-Based Fibonacci levels base on the main and retracement trends to predict future price . If you just looking for a simple Fibonacci Retracement indicator, please use this Free indicator .
### FEATURES ### Auto-calculate up to 7 Trend-Based Fibonacci levels on adjustable frame. Adjust Fibonacci levels as your need. Adjust the start and the end of calculated frame in indicato
FREE

Order Blocks are supply or demand zones in which big traders can find the comfort of placing large buy and sell orders and completing a big, very big transaction. Order blocks are a unique trading strategy that helps traders find a direction in the market. Usually, it allows traders to find out what financial institutions are planning to do in a particular market and better indicate the next price movement.

This indicator demonstrates that the price change of financial instruments is NOT a random walk process, as advocated by the "Random Walk Hypothesis", and as popularised by the bestselling book "A Random Walk Down Wall Street". I wish that were the case! It is shown here that the real situation with price change is actually much worse than a random walk process! Deceptive market psychology, and the bulls-bears tug of war, stack up the odds against traders in all instruments, and all time frame
FREE

The indicator is a 15-minute signal indicator for all types of traders. Meaning, you could make lots of profits trading two different signals in one indicator.
NOTE: Both indicators are channels for achieving the same result. RED ARROW -- Sell Signal BLUE ARROW -- Buy Signal
Purchase now to be part of our community. We offer standard chart setups for both novice and intermediate traders. Trade with ease!
FREE

If you are boring in repeatedly changing of trading symbol in every charts when use multiple charts to analyzing prices or trading. This indicator can help you. It will change the symbol of any other charts in the terminal to the same as in the chart you have attached this indicator to it whenever you add new symbol to the chart or click on the button. After finished the job it will sleep quietly waiting for new occasion in order to minimize resource usage of the computor.
FREE
Check My Product
Contact me to discover all my services
Pivot indicator is a tool used by many traders. It can be used by beginners and experts alike and allows you to identify support and resistance levels. Pivot indicator is a widely used tool because over the years it has shown the validity of the levels it calculates and can be easily integrated into your trading strategy. Pivot levels can be used on different timeframes and based on the chosen time duration, calculate levels using dail
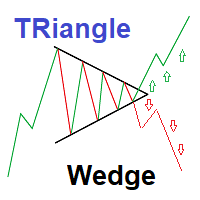
Strategy set to trade Triangle wedge break
This is a simple very effective strategy based on detecting and showing triangle wedges formation Strategy set to trade Triangle wedge break Red Arrows appears on crossing triangle down Green Arrows appears on crossing triangle Up You can also trade lower and upper triangle limit :(new version may be released to allow arrows for side ways trading) ---Sell on price declines from High triangle Level - Buy on increasing from Lower triangle level 2 inpu

Осциллятор Чайкина ( Chaikin Oscillator ) — это индикатор импульса, созданный Марком Чайкиным , и, очевидно, индикатор назван в честь своего создателя. Он измеряет импульс линии распределения и накопления, используя формулу схождения-расхождения скользящих средних (MACD). На основе данных об этом импульсе мы можем получить представление о направленных изменениях в линии распределения и накопления.

This indicator is a supporting tool which helps you draw/update any chart object once. The additions or changes are automatically synchronized to all linked chart windows of the same instrument. Setup is simple. Open all required charts you want to work on, attach the indicator to each chart window and start using it.
Its only allowed to attach one indicator to each chart. Once attached, you can draw on any chart (as long as it has this tool attached as indicator) and the drawing will show up

This indicator was constructed using decision trees. I will only give a few insights into the algorithm since it is original. But there are 4 trees in the inputs and by default they are 10. The decision tree logic for buy signals is as follows: If the MACD line is less than certain bullish divergence (determined by the "BUY_TREE_1" and "BUY_TREE_2" variables) The decision tree logic for sell signals is as follows: If the MACD line is greater than certain bearish divergence (determined by the
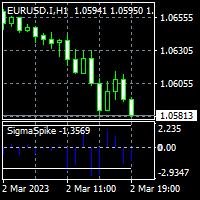
To get access to MT5 version please click here . - This is the exact conversion from TradingView: "SigmaSpikes(R) per Adam H. Grimes" by "irdoj75" - This is a light-load processing and non-repaint indicator. - All input options are available. - Buffers are available for processing in EAs. - You can message in private chat for further changes you need. Thanks for downloading
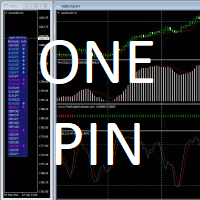
Transform indicators into trading signals JagzFX OnePin Basic allows a wide range of MT4 Custom Indicators to be transformed into multi-symbol trading signals without the need to write any code. You can use OnePin to create 'At A Glance' dashboards showing your preferred technical indicators and even send buy/sell signals to a PIN compatible dashboard just as JagzFX pinTrader. Whilst I have tried to limit the amount of technical jargon needed to use this PIN, there are a few terms that might nee

This is an arrow formed by strong reversal candlesticks it is used on muti time frame or m15 and above for gold and h1 and above for currency pairs (can be used at m5 after strong volatile news) This indicator is 100% non-repain and non-repoint Have a success probability of bringing in more than 90% profit Your stop loss when entering your order is behind the arrow and will be very low it will only be 20 pips or 30 pips at m15 (note in larger timeframes it may be longer) How To USE When the
Really simple tool that can be attached to any graph to keep an eye on the account status. It run as an indicator but actually is just a simple monitor. There are three sections: -account market status : infos about global open orders profit/loss, margin required, market status, etc. -account info: simple infos but good for setting lots amount, knowing contract size, server id, etc. -time data: in order not to get mad on time shifts, you have some info about local, broker, GMT time, plus winter/
The "Stochastic Multi Period Buy Sell Alert" is a powerful technical indicator designed to analyze price momentum and trend strength across multiple timeframes. This indicator is a valuable tool for traders looking to identify profitable trading opportunities. With the indicator, you can monitor price movements in three different timeframes, namely M15, M30, and H1. The indicator calculates the Stochastic K value for each timeframe and determines whether the price is in an oversold or overbought
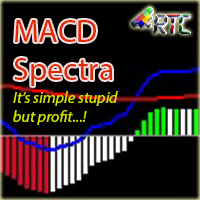
MACD Spectra - простой, но прибыльный индикатор для торговли! Этот индикатор может использоваться на всех временных интервалах и валютных парах. С точностью более 90%, этот индикатор идеально подходит как для новичков, так и для профессиональных трейдеров, которые ищут лучший индикатор для помощи своей торговой деятельности. Просто следуйте за цветом гистограммы, положением гистограммы и положением линий Signal и MACD, чтобы легко входить и выходить с рынка. Не ждите больше, давайте получать ста

Extreme Price Meter
На основе исторической рыночной информации индикатор рассчитывает, каким будет следующий ценовой экстремум с высокой вероятностью разворота. Он генерирует 2 ценовых диапазона, где высока вероятность покупки или продажи. Легко убедиться в высокой точности индикатора, учитывая стрелки, которые он выставляет, когда свеча закрывается за пределами полос вероятности. Уведомления для рабочего стола, телефона и электронной почты.

Стрелочный Форекс индикатор - это незаменимый инструмент для успешного скальпинга на валютном рынке. С его помощью трейдеры могут легко определить моменты, когда стоит открывать позицию на покупку или продажу, и таким образом получать прибыль, не теряя времени на анализ графиков. Красная и синяя стрелки индикатора, своего рода светофор, являются визуальными инструментами, которые позволяют с легкостью определять направление тренда. Красная стрелка сигнализирует о возможности открытия короткой п

It identifies the pivot, support, and resistance price levels of the selected timeframe and then draws lines onto the chart. FEATURES: Option to specify the Timeframe Period in the PivotSR calculation. Option to display the PivotSR of the last candle, of every candle, or of the current candle. Options for displaying labels, line thickness, and line color. PivotSR can be interpreted as reversal levels or past price reactions that can be used as the basis for current price analysis. Some traders b
FREE

It works based on the Stochastic Indicator algorithm. Very useful for trading with high-low or OverSold/Overbought swing strategies. StochSignal will show a buy arrow if the two lines have crossed in the OverSold area and sell arrows if the two lines have crossed in the Overbought area. You can put the Stochastic Indicator on the chart with the same parameters as this StochSignal Indicator to understand more clearly how it works. This indicator is equipped with the following parameters: Inputs d
FREE
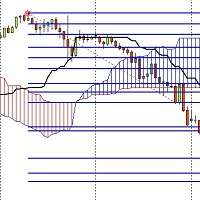
I have developed an indicator based on both the fibo musang strategy and the price breaking of the ichimoku cloud and it has amazing results
the features are:
1- Once activated it give you the trend where you are from the chart
2- After a trend change it gives you an alert on PC or notification on your phone if you are away.
3- It sends you the exact prices to take an order and 3 take profit levels and your stoploss.
4- It works on every timeframes from 1m to MN.
5- It works on pairs

Just another Auto Fibonacci Retracement indicator . However, this is the most Flexible & Reliable one you can find for FREE. If you use this indicator and you like it, please leave a review/comment. If you are looking for a more advanced Fibo indicator, check this Free Trend-Based Fibo indicator .
### FEATURES ### Auto-calculate up to 7 Fibonacci levels on your customized frame. Adjust levels as your need. Use High/Low price or Open/Close price to calculate. Freeze the levels and don't re
FREE

In case you get Laguerre S crat indicator, you will get Laguerre Scrat Ea as a Gift. To get Ea and det a iled m anu al PDF contact me PM. Default settings are for usd/cad H4 For St able Long term Profits Laguerre Scrat is a trading system based on 4 indicator combinations in the shape of one indicator. Laguerre indicator (upgraded), CCI, Bollinger bands and market volatility factor. It generates arrows in the indicator window and nuts on the price chart, doubling arrows for a better view where

if you want to put your "SL" in a safe place you should see the place of "SL" before opening the Order with this indicator no need to measure your "SL" on the chart many times please watch the video of this indicator:
you can change the style of this indicator: width, color, length, Time Frame, distance
if you need more info & video message me if you wanna see the video you should send me message Telegram ID: @forex_ex4 i also have other experts and indicators that will greatly improve your

It is a custom non-repaint indicator to identify trade opportunities in swing action as prices move within an upper and lower band. Inspired by the Keltner Channel, the most popular channel Indicator introduced by Chester Keltner. It is different with a Bollinger Bands. It represents volatility using the high and low prices, while Bollinger's studies rely on the standard deviation. The algorithm for this indicator is also available in the EntryMaximator EA. Including the option to use it or not.
FREE
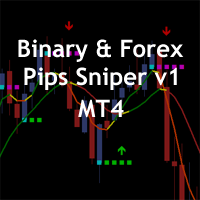
The Binary & Forex Pips Sniper MT4 indicator is based on technical analysis of two moving average and the slope of the slow moving average. The moving average helps to level the price data over a specified period by creating a constantly updated average price. Upward momentum is confirmed with a bullish crossover "Arrow UP", which occurs when a short-term moving average crosses above a longer-term moving average. Conversely, downward momentum is confirmed with a bearish crossover "Arrow Down", w

Fibonacci Retracement object is an object that has been provided by metatrader 4 platform. But Fibonacci Retracement object doesn't automated adjust the chart. You have to put and manage it manually to the chart. Because of that, this indicator was created. If you like using filbonacci retracement indicator, highly recommended to use Automated Fibonacci Retracement Indicator if you want to get better result in here:
https://www.mql5.com/en/market/product/95515
LT Automated Fibonacci Retrace
FREE

Volatility Limit Trend Indicator (VLT), an original indicator by this developer, is a trend indicator based on setting a fixed volatility limit as a percentage of price. Volatile price is allowed to wander between two channel lines defining the fixed volatility about a central line. The price crossing one of the channel lines defines an exceeding of the allowed volatility, and ushering in one of two situation : either a continuation or a reversal of trend. The first buffer of the indicator (not
FREE

This indicator provides trading signals based on the polarity of the dynamical parameters of two digital signals. The dynamical parameters (momentum-acceleration) are derived by applying a high quality momentum oscillator, MTEMA LPD ( see Top Gun Oscillators ) to two digital signals. The MTEMA momentum oscillator is first applied to the price itself. Then, a rectification procedure is applied to the price based on the signals from the momentum oscillator yielding a rectified price signal. This s
FREE

This is the countdown of the last candle Indicator. How much time remains in the current candle of your chart CTime display exactly how many hours, minutes and seconds remain before the current candle closes, and a new one opens. This allows you to be on the ball as soon as the next candle appears It could be useful for a trader who trades with candles as the main attention Available option to change the text color to suit the chart background. This Indicator is related to the system here .
FREE

In physics, "Jerk" is the third time-derivative of position, with acceleration being the second derivative and velocity the first derivative. In technical analysis, the first derivative of price is the price momentum, with the second derivative,acceleration, being seldom used and the third derivative virtually unknown. The magnitude frequency response of a digital differentiator is a positive-slope straight line passing through zero frequency. Therefore, every instance of a digital signal differ
FREE
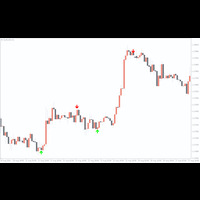
The indicator is a 15-minute signal indicator for all types of traders. Meaning, you could make lots of profits trading two different signals in one indicator.
NOTE: Both indicators are channels for achieving the same result. RED ARROW -- Sell Signal BLUE ARROW -- Buy Signal
Purchase now to be part of our community. We offer standard chart setups for both novice and intermediate traders. Trade with ease!
FREE
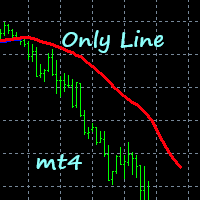
Use this indicator to help determine when to open buys or sells based on the color of the line. Excellent for scalping. Settings: Deviation. TrendPeriod.
Features Alerts. How to use: Simply attach to any chart with default settings. When used on lower timeframes (M1,M5,M30,H1), confirm on higher timeframes. Buy: Blue line below price. Best results when line is blue on multiple timeframes. Sell: Red line above price.
Best results when line is red on multiple timeframes.
Or change settin

This indicator uses a special algorithm to plot the 4 lines for trading. Great for scalping. Does not feature any alerts and is best used manually after confirming the line displays. No need to set up the indicator. How to use: Attach to any chart. Can be used on any time frame. If used on lower time frames, check higher time frames for confirmation. Buy : - Wait for green and white lines to be above the level 50 dotted line, then open buys. - Buy when the green line crosses below the white line

If you are a market operator looking for an advanced solution to identify trends and trend reversals in financial markets, the Weiss Wave indicator could be what you need. Based on the principle of Elliott wave analysis and combining multiple indicators, the indicator provides a comprehensive view of the market in an easy and intuitive way, even for less experienced traders. With clear and easy-to-interpret buy/sell signals, the indicator provides reliable guidance for identifying trends and tre
RumahForexID Momentum Scalping Indicator is the best momentum indicator ever created, and why is that? The indicator works on all timeframes and assets, the indicator is made after 6 years of experience in forex. You know many momentum indicators on the internet are unhelpful, and difficult to trade, but RumahForexID Momentum Scalping Indicator is different , The indicator shows wave momentum, when the market is about to trend or consolidate, all that in one simple and clear indicator!
Ruma

Pinpoint Pro Indicator is a multi-time frames indicator, which uses more than five built-in MT4&MT5 indicator to generate trading signals. This indicator can perform several functions, such as: Send signals notification to mobile phone Gives precise signal entry upon following signal checklist points Can be used in all market such as currency pairs, stock market, metals, commodity, synthetic pairs and cryptocurrency pairs One built-in indicator can be used for signal verification before enterin

"AV Stop Hunter" is an indicator for MetaTrader 4, which draws entry arrows for long and short after so-called Stop Hunt candles and has several notifications about them. Since this is a smart money concept , the periods H1 and H4 are the best. Increasing volume improves the signal, lines and arrows are then thicker. The MQL5 variant has colored stop-hunting candles.
Definition :
Stop hunting, also known as stop running, is the practice of institutional traders (smart money) of driving t
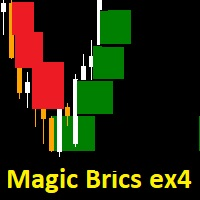
Методология и логика этого индикатора Magic Brics mt4 основана на принципах следования за трендом и торговли ценовым действием. Индикатор Magic Brics — это метод построения графиков, который представляет движение цены с использованием блоков ордеров, а не времени. Каждый блок ордеров формируется на основе определенного движения цены, известного как размер ордера, и окрашивается либо в бычий (зеленый), либо в медвежий (красный) цвет в зависимости от направления движения цены. Индикатор использует

Contact me after payment to send you the User-Manual PDF File.
Triangle Pattern
Sometimes the price cannot make higher highs or lower lows and it moves in a converging price range and waves are shorter than before until the movement creates a geometric shape of a symmetrical triangle, which indicates It is maybe the end of the trend. The triangle pattern is a well-known in forex and the trading plan and strategy of many traders is based on it.
The Triangle Pattern Scanner Indicator It is
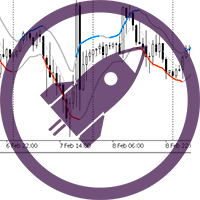
"Scalper Channel MT4" это современный канальный индикатор, показывающий трейдеру направление торговли. Для работы индикатор использует встроенные и собственные технические средства и новую секретную формулу. Загрузите его на график и индикатор цветом покажет вам направление входа: Если верхняя граница ценового канала индикатора синего цвета - открывайте позицию на покупку. Если нижняя граница ценового канала индикатора красного цвета - открывайте позицию на продажу. Если граница индикатора серог
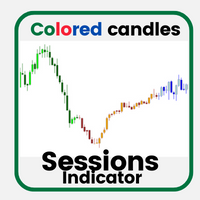
This indicator shows trading sessions using colored candles. It's made for volume profile and supply/demand traders to quickly see when specific candles are formed during different times or trading sessions.
Take a look at the screenshots for a usage example.
Core Features: Different colors for bullish and bearish candles, allowing users to distinguish between bullish/bearish candles.
FREE

Этот индикатор подходит для торгов на паре и еще много других. Также имееться интерактивная панель для быстрой смены настроек. Сам индикатор использует универсальные расчеты дополнительной точности, но пока они оптимизированы под некоторые валютные пары. Множество настроек можно настраивать на главном меню . Свои расчеты он отображает на графике в ввиде значков. Значки бывают двух видов.В тестере работает отлично по умолчанию в настройках. Можно указать цвет для его значков. Удачных торгов.
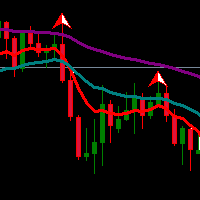
Exponential Moving Average (EMA) is an indicator that often be used by traders. Combination of two or three EMA indicators often applied to determine trend direction. Multiple EMA combined with fractals or oscillator indicator to detect overbought/oversold and divergence point also great to do in trading system.
If you like EMA indicator and want to get better indicator, highly recommended using EMA SuperTrend Strategy Indicator if you want to get better result in here:
https://www.mql5.com/
FREE

[ MT5 Version ] [ Kill Zones ] [ SMT Divergences ] How to trade using Order Blocks: Click here
User Interface Performance: During testing in the strategy tester, the UI may experience lag. Rest assured, this issue is specific to the testing environment and does not affect the indicator's performance in live trading. Elevate your trading strategy with the Order Blocks ICT Multi TF indicator, a cutting-edge tool designed to enhance your trading decisions through advanced order block anal

VisualOrders и InfoAccount - индикатор для анализа собственной торговли или анализа чужого счета, путем визуализации закрытых и действующих ордеров.
Дополнительно есть возможность быстро получить информацию по счету и терминалу. Информация размещается как на графике, так и во вкладке «Эксперты».
Вся отображаемая информация отключается в настройках, позволяя трейдеру оставить на чарте только необходимую информацию.
FREE
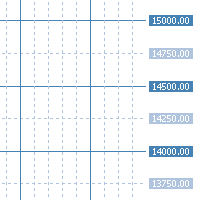
"AV Grid" is an indicator for MetaTrader 4, which automatically displays round numbers as horizontal lines and a sensible period separation . Round prices can be used as support and resistance in trading.
It is an improvement on the "Grid" setting, which also draws a grid on the chart.
Improvements :
- Round levels instead of arbitrary positioning of the horizontals
- Structure by highlighting all x lines (main lines, 2 or 5 makes sense)
- Vertical lines are each in two periods (
KT Day Trading MT4 provides simplified Buy and Sell signals using a combination of some specific candlestick patterns occurring in the market exhaustion zones.
These signals are designed to identify market reversals and entry/exit points. The indicator can be used to trade on any timeframe from the 1 Minute up to the Daily chart.
Features
Three types of entry signals according to the market structure i.e. Trend following, Range bound, and Counter trend signals. Crystal clear Entry, Stop-L
NATR - это нормализованная версия индикатора ATR Используется для измерения уровня волатильности в % от обшей волатильности инструмента, а не в пунктах как обычный ATR
Например NATR с периодом 10 будет показывать средний размер свечи в % за 10 последних свечей или сколько процентов в среднем проходит инструмент за 1 свечу Это позволяет привести значения любых любых исследуемых инструментов к единому знаменателю Имеет простую и понятную настройку Наглядно показывает периоды всплеска волатильн

the AK CAP toolbox free to use;
it includes the same indicators we use for our daily trading and we think the simpler the better. Lightweight indicator for use on all timeframes. that includes VWAP with vwap value indicator on top right. 3 EMA: FAST, MEDIUM, SLOW the candle timer to show how much time left in a candle.
colors and positions are fully customizable.
enjoy
FREE

Precise Cross Arrow indicator is designed for signal trading. This indicator generates trend signals.
It uses many algorithms and indicators to generate this signal. It tries to generate a signal from the points with the highest trend potential.
This indicator is a complete trading product. This indicator does not need any additional indicators.
The indicator certainly does not repaint. The point at which the signal is given does not change.
Features and Suggestions Time Frame

Amazing Pro System indicator is designed for signal trading. This indicator generates trend signals.
It uses many algorithms and indicators to generate this signal. It tries to generate a signal from the points with the highest trend potential.
This indicator is a complete trading product. This indicator does not need any additional indicators.
The indicator certainly does not repaint. The point at which the signal is given does not change.
Features and Suggestions Time Frame: H
Symbol Syncyro Swich - это утилита которая позволяет переключать одновременно торговый символ сразу на нескольких графиках. Если вы используете несколько графиков одного символа с разными таймфреймами для анализа и хотите сменить символ торгового инструмента,
то эта утилита как раз для Вас!!!
Одним нажатием на кнопку с надписью торгового символа Вы легко его поменяете с помощью данной утилиты.
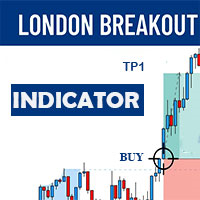
The London Breakout indicator is a technical analysis tool used in the forex market to help traders identify potential breakouts during the opening of the London trading session. This indicator is designed to help traders take advantage of the volatility and momentum that occurs during this time period, which can lead to significant price movements.
The London Breakout indicator works by identifying the range of price movement during the Asian trading session that precedes the London open, an

Индикатор показывает расстояние от ближайшего свободного High/Low
текущей (здесь и далее, текущей - в рамках расчетов индикатора) до исследуемой
(опять же - в рамках расчетов индикатора) свечи слева на графике на том же ценовом уровне. Свободным в данном случае будет являться расстояние больше, чем одна свеча (бар) от текущей
свечи до исследуемой на том же ценовом уровне. Расстояние будет отмечаться пунктирной линией
от High/Low текущей свечи до исследуемой
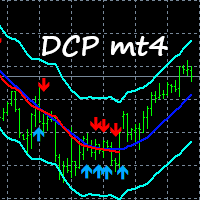
Use this indicator to help determine when to open buys or sells based on the slope and direction of the channel. Excellent for scalping. Settings: TrendPeriod. Deviation. ChannelPeriod. Features Alerts. How to use: Simply attach to any chart. To use on lower timeframes (M1,M5,M30), you'll need to start setting the Deviation from 0.01 and increase it if needed. If used on lower timeframes ( M1,M5,M30,H1), confirm on higher timeframes (H4,D,W) before entering trades. H1: Set Deviation to 0.5. H4:

** All Symbols x All Timeframes scan just by pressing scanner button ** *** Contact me after the purchase to send you instructions and add you in "Wolfe Wave Scanner group" for sharing or seeing experiences with other users. Introduction: A Wolfe Wave is created with five-wave patterns in price. It shows supply and demand and a fight towards a balance price. T hese waves of price actions can help traders identify the boundaries of the trend . Also It helps forecast how the price will move
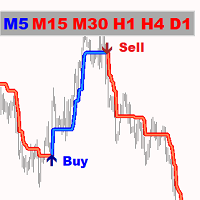
Gold Pointer – это лучший трендовый индикатор. Уникальный алгоритм индикатора анализирует движение цены актива, учитывая факторы технического и математического анализа, определяет самые прибыльные точки входа и выдает сигнал для открытия ордера BUY или SELL .
Самые лучшие сигналы индикатора: Для SELL = красная трендовая линия + красный указатель ТФ + желтая сигнальная стрелка в этом же направлении. Для BUY = синяя трендовая линия + синий указатель ТФ + аква сигнальная стрелка в этом же направл

FTU Idioteka Indikator prednaznachen dlya platformy MT4, yego mozhno ispol'zovat' otdel'no, no luchshe vsego sochetat' s drugimi indikatorami ili strategiyami. Sochetayet v sebe razlichnyye indikatory, takiye kak macd, adx, dlya risovaniya strelki, ukazyvayushchey na vkhod ili izmeneniye trenda. Posmotrite korotkoye vstupitel'noye video na YouTube: https://youtu.be/lCRJ3mFNyOQ Osobennosti indikatora: Prodat' i kupit' strelki Vizual'noye i zvukovoye opoveshcheniye Prodolzheniye trenda/ranniy sig
FREE

ФТУ Корвус Индикатор для платформы mt4, можно использовать исключительно для торговли, лучше всего сочетать с другими индикаторами. Разработан с использованием различных индикаторов, таких как macd и adx, для рисования стрелки, указывающей на вход или изменение тренда. Этот индикатор похож на FTU Idioteque — см. другие мои индикаторы, такие как FTU Predictor. Посмотрите короткое вступительное видео на YouTube: https://youtu.be/n_nBa1AFG0I Функции: Продать и купить стрелки Визуальное и звуковое
MetaTrader Маркет - уникальная площадка по продаже роботов и технических индикаторов, не имеющая аналогов.
Памятка пользователя MQL5.community расскажет вам и о других возможностях, доступных трейдерам только у нас: копирование торговых сигналов, заказ программ для фрилансеров, автоматические расчеты через платежную систему, аренда вычислительных мощностей в MQL5 Cloud Network.
Вы упускаете торговые возможности:
- Бесплатные приложения для трейдинга
- 8 000+ сигналов для копирования
- Экономические новости для анализа финансовых рынков
Регистрация
Вход
Если у вас нет учетной записи, зарегистрируйтесь
Для авторизации и пользования сайтом MQL5.com необходимо разрешить использование файлов Сookie.
Пожалуйста, включите в вашем браузере данную настройку, иначе вы не сможете авторизоваться.