Смотри обучающее видео по маркету на YouTube
Как купить торгового робота или индикатор
Запусти робота на
виртуальном хостинге
виртуальном хостинге
Протестируй индикатор/робота перед покупкой
Хочешь зарабатывать в Маркете?
Как подать продукт, чтобы его покупали
Новые технические индикаторы для MetaTrader 4 - 94
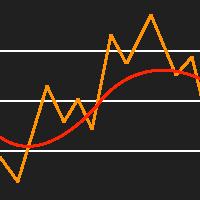
This indicator places a moving average of the specified type over the standard RSI indicator. This is an extremely useful tool for spotting reversal points and RSI divergences. This indicator provides buffers, allowing you to use it in your expert advisor. I like to make the RSI period the same as the moving average period, but it is up to you to set it up however you would like.

Introduction
This is a volume based heatmap type indicator. The indicator does not repaint . Its gives a collective view of short, intermediate and long term volume buy sell activities(bottom to top of map). This indicator should prove quite beneficial to all those who believe in the power of volumes. As usual for any volume based indicators, a ECN broker is recommended.The indicator can be useful for both binary and other fx trading.
Before wondering how to use it, it is probably wort

Или M verage внимание переходит S оддержка R esistance Bands.
Индикатор MASR Bands - это скользящая средняя, окруженная двумя полосами, которые работают вместе как уровни поддержки и сопротивления. По статистике, полосы MASR в 93% случаев содержат ценовые свечи. Вот как он рассчитывается по шагам: 1. Первый шаг - вычислить наивысший максимум (HHV) и самый низкий минимум (LLV) за период X времени.
2. Второй шаг - разделить HHV на LLV, чтобы получить расстояние между ними в процентах. Я на

Технический индикатор Smart Awesome Volume предназначен для измерения рыночного импульса путем объединения данных об объеме свечей и фильтрации их со средним значением для получения точных сигналов. Он фокусируется на концепции «объем подтверждает цену», позволяя трейдерам легко определять рыночный импульс и битву между покупателями и продавцами внутри каждой свечи. Благодаря системе быстрого оповещения трейдеры могут быть в курсе ценных торговых событий и никогда не пропускать важные движен

RSI Crossover Alert — это мощная система уведомлений, разработанная специально для трейдеров, которые используют индекс относительной силы (RSI) в своих торговых стратегиях. Этот индикатор фокусируется на выявлении пересечений RSI, которые происходят, когда быстрая линия RSI пересекает выше или ниже медленную линию RSI. Комбинируя эти пересечения, индикатор эффективно отфильтровывает ложные сигналы, позволяя трейдерам принимать более точные торговые решения. RSI Crossover Alert предлагает

Mars 13 is a Break indicator is a powerful indicator of Pattern trade for any par and any timeframe. It doesn't requires any additional indicators for the trading setup.The indicator gives clear signals about opening and closing trades.This Indicator is a unique, high quality and affordable trading tool. Can be used in combination with other indicators Perfect For New Traders And Expert Traders Low risk entries. Never repaints signal. Never backpaints signal. Never recalculates signal. For
Интеллектуальный индикатор Smart Breakout Indicator определяет уровни поддержки и сопротивления и также в виде гистограммы показывает точки пробоя уровней.
Программа содержит два индикатора в одном: 1 - линии поддержки и сопротивления, 2 - гистограммный индикатор основан на высоком колебании цен. Индикатор автономно вычисляет наиболее лучшие уровни поддержки и сопротивления и также в виде гистограммы показывает наиболее лучшие моменты пробоя линий.
Гистограммный индикатор создан на

Универсальный индикатор Diamond Grail который получил такое название не так просто! Индикатор тестировался больше года нашими специалистами! Один из лучших стрелочных индикаторов, который идеально подходит для бинарных опционов и Форекс, Если торговать по бинарным опционам лучший регтайм для него от 3 минут максимум 5 минут Стрелка появляется на предыдущей свечи. Если торговать на форекс то время открытие от свечи до свечи Результат на форекс От 40 До 1324 пи псов! Доходность Diamond Gra
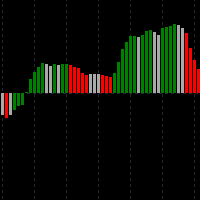
Hybrid MacdAO - индикатор, сделанный на базе двух популярных индикаторов: MACD + AO. Он вобрал в себя их лучшие качества, но при этом лишен недостатков. Предназначен для ручной торговли по тренду. Отлично показывает усиление, замедление текущего движения цены. Также будет хорошим помощником, кто торгует по дивергенциям (довольно точно показывает нужную точку входа в позицию сменой цвета гистограммы). Есть алерт-система (чтобы вы не сидели постоянно возле монитора). Преимущества перед стандартны

Данный индикатор является профессиональным индикатором для торговли на рынке форекс. Показывает точки для входа в рынок, точки потенциального разворота рынка. Использует один параметр для настроек. Готовая торговая система. Индикатор сочетает в себе несколько прогрессивных алгоритмов. Объединенные системы анализа исторических данных проецируются на линии в виде прямых соединяющие экстремумы. То есть точки разворота рынка. Данные экстремумы или точки разворота рынка можно использовать как линии

How the Indicator Works:
This is a Multi-timeframe MA multimeter indicator which studies if price is above or below a particular EMA range and shows Red/Green/Yellow signals. Red: Price Below EMA range Green: Price above range Yellow: Price within range
Indicator Properties:
EMA Settings: - Default Period is 200. You can change all MA Settings like Period, MA Method (SMA, EMA, etc) or MA Applied Price (Close, Open, etc).
- EMA Range list is a comma separated value list for different timefr
FREE

Intraday Setup Indicator uses Bollinger Bands as a main indicator to find a good setup filtered with candle stick pattern such as engulfing and pin bar. This is great tool for those who trade with Bollinger bands for entry or use it as a filter for trend. It is suggested to use a higher time frame when using this tool. There are many input setting for user to conveniently find a good probability setup.
FREE
Price Point Signal is an indicator that generates trade arrows. It generates trade arrows with its own algorithm. These arrows give buying and selling signals. The indicator certainly does not repaint. The point at which the signal is given does not change. You can use it in all graphics. You can use it in all pairs. This indicator shows the input and output signals as arrows and alert. When sl_tp is set to true, the indicator will send you the close long and close short warnings. It tells you t
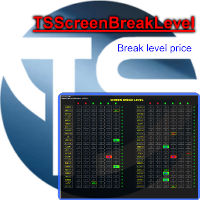
Indicator, which draws supports and resistances that have been broken. Intelligent algorithm for scalper and intraday traders. Multi time frame and multi currency panel. The benefits you get Never redesigns, does not retreat, never recalculates. Works on forex and CFD, timeframe from M5 to Daily. Integrated pop-up, push notification and sound alerts. Easy to use. Parameters input int Number_Instrument = 10; Number of crosses present in your panel SENSIBILITY = 1; indicates the imp

Pivot Mean Oscillator (PMO) is a unbounded zero-centered oscillator that provides a quick and normalized measure of divergence between two spreads. Detailed description of the mathematical formulation along with some comments and experiments can be found in this article .
Trading aspects
This version of PMO is tuned on spreads relative to Close and Open price signals against their cumulative moving average (CMA). Positive PMO(m,n) values means that last (normalized) m Close prices are higher
FREE

Индикатор отображает кластеры объёма либо профили объёма на выбор.
Описание входных переменных
StepPoint - шаг кластера в пунктах, при значении равном нулю назначается автоматически. AssociatedTimeframe - привязка индикатора к заданному таймфрейму графика, при значении равном Current индикатор работает на всех таймфреймах. ClustersVolume - объём в кластерах: All - весь объём. Active - активный объём (который произвёл движение цены). ClustersAsDelta - разность между объёмом покупок и п

Анализ распределения Галактического Объема (VSA) - это индикатор, предназначенный для визуализации Объема и доли, в которой он влияет на волатильность разброса различных пар.
Стратегия состоит из следующего:
Bull Trend: Всегда в пользу тренда, открывайте покупки на минимумах тренда, при условии, что он совпадает с большим объемом, показанным индикатором Galactic VSA. Нисходящий тренд: Всегда в пользу тренда, открывайте торговые операции на максимумах тренда, при условии, что он совпадает с

Smart and simple Indicator based on wolves waves reversal pattern also near to falling and rising wedge and butterfly patterns with Stoploss and entry signal preferred time frame M30 : with parameters bars count used for calculation = 200 and moving average for accuracy = 100; you can try it for other higher or lower parameters and try your own set of inputs higher timeframe = lower input !!! important note ::: Indicator don't back draw when first installed on Chart
once installed wait for new

Trend Sniper Super Indicator is one of the best indicator which can provide you will perfect signals for short term and long term trades. This indicator is suitable for both scalping and swing trading strategies. The indicator is over 85% accurate. It uses terminal Message Alerts, Emails and Push notifications to your mobile device to inform you about the new trading opportunities and it will calculate the take profit and stop loss level for you. All you will need to do is to place a trade. Subs

Despite the popularity of inside bar pattern among the traders, using it as a standalone signal doesn't provide any edge in the market.
KT Inside Bar Advanced indicator solves this problem by combining the classic inside bar pattern with the "ECE" cycle and Fibonacci extensions. Using this indicator in place of our classic inside bar indicator will provide a tremendous advantage and edge in the market.
What is the ECE cycle?
In financial markets, the price never moves in a straight line bu

Auto redrawn Pivot support resistance horizontal lines with signal of Buy/Sell possibilities with SL level and with trend support resistance lines too used for all symbols and time frames you can adjust inputs parameters (only 2) and test it on various symbols and time frames input number of bars for calculation and moving average for signal accuracy example : use it on M30 time frame with input 200 for bars count and 100 for MA

This Indicator provides Buy/Sell Signal based on calculations on Higher frame (Trend) and Lower frame(Entry signals) * You should select the higher and lower frame for indicator calculations * You select the Trend line colors as you prefer * Enable or disable Alerts! Trend lines UP/Down are drawn when a trend is detected Wait for small arrows for entry : *Normally an UP arrow in an UP Trend is a BUY signal : ---you Close the BUY position IF a Reverse DOWN Trend signal appears Or when Up trend li

Индикатор Ez Channel является важным инструментом для трейдеров, следующих за трендом, поскольку он автоматически определяет на графике реальные каналы тренда. С этим индикатором вам больше не придется часами вручную рисовать линии тренда на графиках. Это экономит ваше время и усилия, быстро рисуя каналы тренда для любого символа и таймфрейма. Одной из ключевых особенностей Ez Channel является его мини-панель управления, которая позволяет легко настраивать периоды времени в соответствии с ва

Индикатор True Points PRO анализирует динамику изменения цен и определяет истинные точки разворота. Индикатор рассчитывает и отображает общую прибыль и вероятность ее достижения. Индикатор имеет встроенные уровни тейк-профита: TP1 фиксирует прибыль на заданном уровне; TP2 учитывается автоматически (регулируется параметром Низкого уровня). Информация о прибыли и текущем сигнале отображается на панели информации о движении. Параметр Результат вычисляет все прибыли и убытки.
Основные пар
FREE
Стратегия для торговли по тренду. Индикатор показывает точки входа и выводит на графике TakeProfit и StopLoss уровни, а также просчитает общий результат. ВНИМАНИЕ! TI Opti Pro - мощный инструмент для переборки входных параметров индикатора TrendImprovement Pro даст возможность быстро найти самые прибыльные варианты входных параметров. Новый проект.
Описание. Никому уже не секрет что нет универсального индикатора, который бы приносил прибыль на всех валютных парах и таймфреймах в долгосрочном
FREE

A unique multicurrency and multi-timeframe strategy developed by a team of LATAlab specialists. Strategy Profit Creator by LATAlab has been tested and verified by our team. This will allow you to earn maximum profit comfortably and efficiently. Strategy features Profit Creator by LATAlab never redraws. Works on any trading symbol. Time frame - from M1 to MN. Automatically detects Buy, Sell, Take Profit, Stop Loss levels. The indicator is equipped with a convenient information panel in which all

Индикатор рассчитывает уровни насыщенности ценового графика. Сигнал на выход из области перепродажи является сигналом на покупку. Сигнал на выход из области перекупки является сигналом на продажу. Обычно нужно задать относительные величины для уровня перекупленности и перепроданности Bottom и Top - для данного индикатора.
Чаще всего хороший тренд виден на ценовом графике визуально. Но опытный трейдер перед входом должен четко понимать текущую расстановку сил на рынке. И индикатор поможет тре

Торговля на основе показателей тренда самая простая и, зачастую, самая эффективная. Если правильно определить начало тренда, результат сделки обычно положительный. Если же вы используете в качестве базы живой график бинарных опционов, шансы на успех становятся еще выше.
Данный индикатор может отследить устойчивое движение цены в определенном направлении. При этом само движение может быть нисходящим, восходящим или боковым, когда движение рынка не имеет ярко выраженной направленности. Индикато

Индикатор RSI Arrows MTF построен на основе индикатора RSI . Представляет собой сигналы на вход в виде стрелок. Имеет 6 видов расчета. Все сигналы образовываются на текущем баре выбранного периода. Сигналы не перерисовываются в первых 4 режимах! Но возможно перерисовка в случаях резкого изменения движения рынка. Все сигнала в режиме MTF, соответствуют сигналам того периода, который указан в MTF. Максимально упрощен в использовании как для торговли исключительно одним индикатором, так и для и
FREE

Candle Pattern Alert indicator alerts when the last price closed candle matches the set input parameters. You can choose to scan through all the symbols in Market Watch or enter your favorite symbols and also you can enter time frames you need to scan. --------- Main settings- ------- Select all symbols from Market Watch? - if Yes the program scans through all the symbols displayed in Market Watch, if No - only selected in next input symbols are scanned
Enter symbols separated by commas - enter
FREE

Индикатор Dolphin Bands работает одинаково хорошо на любых таймфреймах. Для трендов средней продолжительности рекомендуется использовать стандартную настройку. Для исследования долгосрочных трендов рекомендуется использовать значение индикатора больше стандартного. Для анализа краткосрочных трендов лучше использовать меньшее значение индикатора. Чаще всего для вычисления индикатора используют экспоненциальный метод, но также могут применяться другие разновидности.
Dolphin Bands – это набор л

Special Volume - Индикатор объема, на рынке Форекс объемы своеобразные (тиковые). Почему на Форекс невозможно отследить нормальные объемы? Дело в том, что это внебиржевой рынок. Следовательно, подсчитать объемы покупок и продаж по одному инструменту, практически, не реально. Многие Форекс трейдеры вовсе отказываются от индикаторов объема в своей работе. Но для тех, кто хочет их использовать, есть несколько интересные инструменты, и один из них Special Volume. Индикатор объема Special Volume отра

Индикатор Martingals работает на всех валютных парах и на всех таймфреймах. Стрелками показывает оптимальные точки входов для будущего усреднения по Мартингейлу даже с нулевой экспонентой. Индикатор показывает сигнал на закрытие серии только в том случае, если все предыдущие сигналы можно закрыть в профите. После закрытия серии в профите нужно сразу открывать ордер в направлении сигнала. Таким образом сигнал на закрытие - это одновременно точка реверсного открытия в другую сторону нового ордера.

Индикатор направления (тренда) Direction Trend. Показывает направление текущего тренда. Раскрашивает бары в красный и синий цвет. Работает на всех валютных парах и на всех таймфреймах. Не надо забывать, что подход должен быть комплексным, сигналы индикатора требуют дополнительной информации для входа в рынок. Принцип работы индикатора заключается в том, чтобы при размещении на график автоматически определять текущее состояние рынка, анализировать исторические данные, на основании исторических д

BeST_ Classic Pivot Points is an MT4 Indicator that is based on the widely known and definitely classic Pivot Point of a market prices activity. A pivot point is calculated as an average of significant prices (high,low,close) from the performance of a market in the prior trading period. If the market in the following period trades above the pivot point it is usually evaluated as a bullish sentiment, whereas trading below the pivot point is seen as bearish. A pivot point and the associated suppo
FREE

Average Daily Weekly Monthly Range Alerts.
The most complete multi-period dynamic range indicator with full alert options. Visually displays the Average Range lines on chart + real time distances to the Range Highs and Lows. Notifications are sent when the average ranges are hit. An essential tool for any serious trader! Average period ranges, especially the ADR (Average Daily Range) for day traders, are one of the most useful and consistently reliable indicators available to traders. Always a

Всем привет. Предлагаю на обозрения очень достойный индикатор входы очень четкие можно по мартину отрабатывать 30 мин до и после новостей не торгуем можно накинуть индикатор новостей больше вам не чего не надо есть сигнал стрелка за крепилась на следующую входим Экспирация любая валюта тоже любая. осцилляторы и авторский алгоритм.И еще можно через бот авто торговля на скрине.И еще друзья после приобретения или аренды пишем мне свои контакты я вам помогу все настроить что бы работало на авто то
FREE
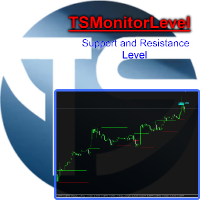
Indicator, which draws supports and resistances. Algorithm that calculates the entry zone of the position and the possible target. The benefits you get: Never redesigns, does not retreat, never recalculates. Works on forex and CFD, timeframe from M1 to Weekly. Integrated pop-up, push notification and sound alerts. Easy to use.
Parameters: SENSIBILITY = indicates the importance of levels, we recommend a minimum value of 1.0
PERIOD_BAR = indicates how many bars are considered for volatility,
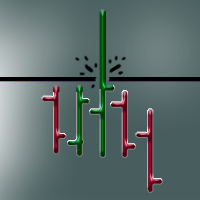
Панель предназначена для быстрого визуального нахождения и отображения ложных пробоев по всем периодам и на любых выбранных валютных парах одновременно . Цвет сигнальных кнопок , указывает на направление возможного движения . По клику на сигнальную кнопку , осуществляется открытие графика с данным паттерном . Отключить не используемые периоды , можно кликом по его заголовку . Кнопка "All" открывает графики всех сигналов по данному периоду . Имеется поиск в истории ( по предыдущим барам ). Прокру
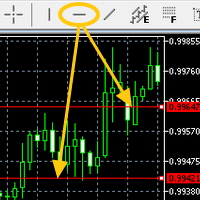
Attach the indicator on the chart and draw the red line from the button on MT4's built-in menu bar then the alert will be sent to you(push,email,popup and sound)
Hi You all know the red line (the MT4 built-in red line) drawn from the menu bar on MT5. It is often used to check the resistance etc.....It is very useful but it is little troublesome to get an alert(sound, push, email and popup) when the red line is touched by the price. Here is Price Touch Alert indication, just use the button t
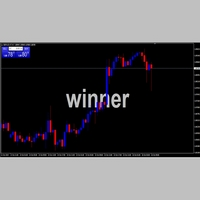
the best indicator to put your own fingerprint on your products, put your signature and protect your rights easily and simply. You can customize any program (indicator, Expert or script) by choosing your own signature and your favorite color, adjust the indicator properties to suit your needs, and change your signature at any moment you want with this wonderful indicator.
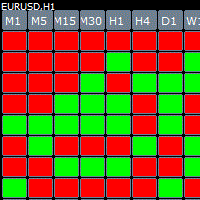
Cube indicator represents the original candle stick chart but in a top down cube form in order to see previous patterns in the markets more easy. The indicator has build in alert once there is a consecutive 3,4,5 bars in a row you get an message.
Parameters Bars_Limit = total visible cubes
TF_M1 = true; TF_M5 = true; TF_M15 = true; TF_M30 = true; TF_H1 = true; TF_H4 = true; TF_D1 = true; TF_W1 = true; TF_MN1 = true; Table_Position_X = 20; Horizontal shift Table_Position_Y = 40; Vertica
Introduction
Ultimate Arrows Prognosis is a unique indicator, in which the signals are actually rendered without delay! This fact, unlike other indicators, allows traders to respond to the current market situation and achieve to high quality and efficient analyzes.
This indicator does not redraw and never changes the previous signals! And so, you know, that every signals, which is possible to see in history, will this unique indicator show exactly the same in the future. With this indicato

Представляем Детектор прорыва объема полос Боллинджера , мощный технический индикатор, разработанный для улучшения популярной стратегии прорыва полос Боллинджера . Этот индикатор выводит следование за трендом на следующий уровень за счет включения данных объема, эффективно сводя к минимуму ложные сигналы. Придерживаясь принципа «объем подтверждает цену», этот инструмент позволяет трейдерам идентифицировать ценовые прорывы, сопровождающиеся значительным увеличением объема, обеспечивая бол
Mars 12 is a Pullback indicator is a powerful indicator of Pullback trade for any par and any timeframe. It doesn't requires any additional indicators for the trading setup.The indicator gives clear signals about opening and closing trades.This Indicator is a unique, high quality and affordable trading tool. Can be used in combination with other indicators Perfect For New Traders And Expert Traders Low risk entries. Never repaints signal. Never backpaints signal. Never recalculates signal.

Это гибридный трендовый индикатор, так как основывается на сигналах элементарных индикаторов и специального алгоритма для анализа. Интеллектуальный алгоритм индикатора определяет тренд, отфильтровывает рыночный шум и генерирует входные сигналы. Индикатор использует цветовую сигнализацию: синий - при смене с нисходящего на восходящий, а красный - наоборот, на нисходящий. Использовать индикатор можно как основной для определения тренда. Индикатор может работать как для точек входа, так и как фильт
Индикатор находит локальные экстремумы и указывает на начало нового краткосрочного тренда. Прекрасный инструмент для внутридневной и краткосрочной торговли. Вероятные точки разворота цены отображаются на графике звёздочками. После подтверждения разворота на графике рисуются стрелки, которые служат сигналами на покупку и продажу. И звёздочки и стрелки формируются только после закрытия свечи или бара. Тем самым уменьшается количество ложных сигналов и значительно повышается точность индикатора.
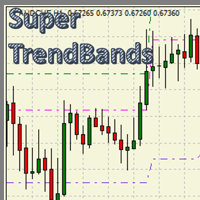
Super Trend Bands An indicator based on MaSuperTrend , taking advantage of the calculations obtained in order to logically distribute a series of channels that accompany the price during its tour, thus facilitating trade areas with a calculated risk and objective. With great adaptability in any type of financial asset and with a potential for visual simplification in the chart, which will make the chart a simple worktable. A custom indicator: - For MT4 desktop platform. - Great for Day trading,

This indicator is based on Guppy's GMMA Strategy. And shows arrows when GMMA lines cross up or down. To have this indicator and get alerts for Multiple Timeframes and multiple Pairs you can check out the demo of this GMMA Trend Scanner indicator: https://www.mql5.com/en/market/product/38747
About GMMA In Brief:
GMMA attempts to identify trends by combining two groups of moving averages with differing time periods: The long-term EMAs (30, 35, 40, 45, 50, and 60) the behaviors of investors that
FREE

Индикатор показывает точки входа с Risk-Reward-Ratio 1 к 5. Основной таймфрейм H1. Рабочие инструменты - все. Принцип работы - найти разворотный уровень, а потом отследить реакцию цены на этот уровень. В настройках не нуждается. Откладывает стандартно 5 уровней одинаковых тейк-профитов (красный/синий для селов и баев) и 1 уровень стоп-лосса - оранжевый.
ВНИМАНИЕ! Тестовая версия индикатора. Полноценно работает только на паре USDCAD! Полноценную версию можно купить здесь https://www.mql5.co
FREE
Может быть построен по цене Close или High-Low с учетом установленного таймфрейма. При расчете индикатора на старших таймфреймах по цене Close будут использоваться цены текущего таймфрейма. Параметры индикатора: ZigZag TimeFrame = PERIOD_CURRENT - рабочий таймфрейм (должен быть больше или равен текущему); Depth = 12 - глубина поиска локального экстремума в барах; On close calc = false - вариант расчета индикатора (true - по цене Close, false - по ценам High - Low); On minute calc = true - в

Индикатор Profit/Loss Meter позволяет измерить Прибыль/Убыток будущей, прошлой или текущей сделки в валюте депозита и оценить уровень маржи на момент окончания сделки. Индикатор работает на базе встроенного МТ4 инструмента "Перекрестие" и имеет следующие параметры: Trade Direction = Buy/Sell Направление позиции Lot size = 0.1 Размер лота Font size = 8 Размер шрифта Font color = DeepSkyBlue Цвет шрифта Offset horizontal Сдвиг текста по вертикали Offset vertical Сдвиг текста по горизонтали
FREE

Индикатор RS 24 Titanium- э то мультивалютный и мультитаймфреймовый сигнальный индикатор, созданный по авторскому алгоритму. П редназначен для быстрой оценки тренда (настроения участников рынка) на всех таймфреймах одновременно, по конкретному финансовому инструменту. RS 24 Titanium сканирует показания со всех таймфреймов по одному финансовому активу и выводить данные в виде наглядной таблицы. Индикатор может использоваться с любым брокером (с 4/5-значными котировками). Полученные торговы
FREE

EZT Trade History This is a great tool to analyze past trades or follow current ongoing trades, especially when you using an EA to manage your transactions. You will see the exact candle where the trade was opened and closed. Collapsible floating panel on the chart, free to move anywhere with your mouse. When you using multiple EA’s with different magic numbers, you have 5 options to separate those trades, so you will know which EA opened specific transactions. You can set the day limits how fa

Lift off! This Indicator will take your trading into new heights! This Forex Indicator Scalper is great for all time frame. It works by incorporating the Double MACD strategy and the Ichimoku Cloud. They both work as an excellent signal confirmation and filters for each other. The there is specific Ichimoku setting that seem to work nicely by shifting the Kumo Cloud during my research. This is the secret sauce for Sclaping with Ichimoku
How to use: 1. Wait for arrow signal to show. (IT DOES

KT Round Numbers plots the round number levels which are also commonly known as psychological levels in the Forex world. In the context of Forex trading, round number levels are those levels in which there are two or more zeroes at the end. They are named as 00 levels on the chart.
Some traders also consider the halfway points as a valid round number level. They are named as 50 levels on the chart.
Use of round number levels in trading Round number levels work as strong support and resistan

The indicator marks bars with a simple trend definition“ each subsequent high above/below the previous one and each subsequent low above/below the previous one ”. Charles Dow
Formula:
Max – The current maximum Min – The current minimum MaxK – Maximum per period MinK – Minimum per period Min>MinK & Max>=MaxK – Symbol on top Max<MaxK & Min<=MinK – The symbol on the bottom
Input parameter:
Number of bars in the calculated history Period for current timeframe The distance to the symbo
FREE
How To Trade
Execute your trades in 3 Easy Steps!
Step 1: Trade Setup Entry Buy in Signal price and TP1 in price indicator, You can use trailing stop in TP1. Entry Sell in Signal price and TP1 in price indicator, You can use trailing stop in TP1. Success Rate ≥ 75% 100:25 Step 2: Set Stop Loss Stop loss BUY ----> You can set stop loss on Line Order SELL. Stop loss SELL ----> You can set stop loss on Line Order BUY. Step 3: Set Take Profit Option 1: Take profit on TP1. Option 2: Partial take
FREE

Это удобный инструмент, если вы привыкли торговать на чистом графике, но иногда вам нужно взглянуть на данный индикатор. Если вы не уверены, как определить точку перегиба тренда и обеспокоены тем, как провести линии тренда то этот индикатор для вас. Отныне вам не нужно сидеть около компьютера и анализировать цену, присто используйте данный индикатор.

This indicator draws regular bullish and bearish divergences in real-time onto the charts. The algorithm to detect those divergences is based on my 10+ years experience of detecting divergences visually. The divergences are drawn as green and red rectangles on the charts. You can even do forward testing in the visual mode of the strategy tester.
Parameters Fast EMA Period: The period of the fast EMA of the MACD. Default value is 12.
Slow EMA Period: The period of the slow EMA of the MACD. Def

Это мультивалютный и мультитаймфреймовый индикатор, который рассчитывает угол между двумя точками. Точки, для измерения угла, могут браться из индикатора ЗигЗаг (две последние точки), или из индикатора Moving Average (между двумя указанными барами), или это могут быть цены закрытия баров.
Измерение угла возможно в градусах или в радианах. Можно выбрать масштаб для расчета. Для лучшего понимания работы индикатора, вы можете изучить бесплатный индикатор Angle High Low . В параметрах вы можете

This indicator draws regular bullish and bearish divergences in real-time onto the charts. The algorithm to detect those divergences is based on my 10+ years experience of detecting divergences visually. The divergences are drawn as green and red rectangles on the charts. You can even do forward testing in the visual mode of the strategy tester. This FREE Version is restricted to EURUSD and GBPUSD. The full version without restrictions is here: https://www.mql5.com/en/market/product/42732
Para
FREE
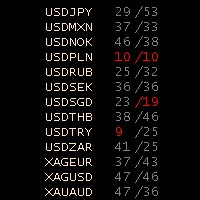
Stochastic Oscillator Panel Introducing the Stochastic Oscillator Panel, a comprehensive representation of the stochastic oscillator for all currencies (up to 75 pairs). This powerful tool operates within the current time frame, utilizing the simple moving average and relying on the Low/High prices. The panel consists of three columns: Name of the currency MODE_MAIN (main line) MODE_SIGNAL (signal line) The Stochastic Oscillator Panel provides visual cues through color coding: Green color (overb
FREE

Торговая система для скальпинга. Индикатор показывает направление цены, амплитуду (канал) ее движения и точки разворота. Система автоматически анализирует рынок по алгоритму усреднения тикового объема за определенный промежуток времени. После этого Scalper Thunder сопоставляет полученные данные с другими индикаторами анализа для выявления потенциальных точек разворота цены. Как только такая точка найдена, индикатор показывает трейдеру на графике разворот цены и текущее ее направление. Суть торго

Индикатор ZigZag, урезанный до абсолютного минимума. Важное свойство данного индикатора - он никогда не перерисует значение завершенного бара. Параметры индикатора со значениями по умолчанию: Depth =12 - глубина поиска локального экстремума в барах; On minute calc = true - включить/выключить расчет на минутном баре (выключить - расчет на каждом тике).

KT MA Crossover draws the buy and sell arrows based on the crossover of chosen moving averages. Moreover, it also generates the appropriate alerts and displays the MFE (Most Favorable Excursion) for each successive signal. The moving average crossover is one of the primary strategies followed by traders around the world. Usually, it consists of a fast and slow moving average to find a buy and sell entry signal according to the crossover direction. Buy signal - when fast MA crosses above the slo

How To Trade
Execute your trades in 3 Easy Steps!
Step 1: Trade Setup Entry Buy in Line color Blue Touch on line color Red. Entry Sell in Line color Blue Touch on line color Green. Success Rate ≥ 80% 100:20 depend your experience and fast your take. Step 2: Set Stop Loss Stop loss BUY ----> You can not put stoploss with a fixed price, your speed in determining the closing request------>Line color Blue Touch on line color Green. Stop loss SELL ----> You can not put stoploss with a fixed price,
FREE
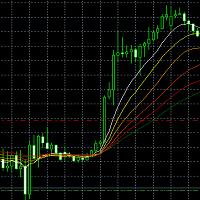
This is an indicator based on PBX .It can show the current trend clearly.Anything you want do not hesitate to contact me Waterfall Line (PBX) is a main method of analyzing the trend of stock prices in the financial field, which was widely used in Europe and America in the early 1990s. Therefore, it is named as a waterfall when it converges and diverges downward. It belongs to the traditional trend line of general trend price. Its real name is the non-linear weighted moving average. It

This index can be traced back to historical transactions, and can clearly see the trading location, trading type, profit and loss situation, as well as statistical information.
Showlabel is used to display statistics. Summy_from is the start time of order statistics. This parameter is based on the opening time of the order.
Backtracking can help us to correct the wrong trading habits, which is very important for beginners to learn manual transactions.
This index is suitable for each time
Th3Eng signals wave is a very good indicator to read the trend. But you need to filter the main trend direction with your own strategy. Because this indicator signals are repainted. So for example: Use Moving average 21 to find the trend and if the price is above the moving on higher TF or the current >> open only buy signals from the indicator. Also you can use it on option trading, Not only on forex.
Works with all time-frames. works with all pairs, CFD and cryptocurrency. Sending all alerti
FREE
А знаете ли вы, почему MetaTrader Market - лучшее место для продажи торговых стратегий и технических индикаторов? Разработчику у нас не нужно тратить время и силы на рекламу, защиту программ и расчеты с покупателями. Всё это уже сделано.
Вы упускаете торговые возможности:
- Бесплатные приложения для трейдинга
- 8 000+ сигналов для копирования
- Экономические новости для анализа финансовых рынков
Регистрация
Вход
Если у вас нет учетной записи, зарегистрируйтесь
Для авторизации и пользования сайтом MQL5.com необходимо разрешить использование файлов Сookie.
Пожалуйста, включите в вашем браузере данную настройку, иначе вы не сможете авторизоваться.