Смотри обучающее видео по маркету на YouTube
Как купить торгового робота или индикатор
Запусти робота на
виртуальном хостинге
виртуальном хостинге
Протестируй индикатор/робота перед покупкой
Хочешь зарабатывать в Маркете?
Как подать продукт, чтобы его покупали
Новые технические индикаторы для MetaTrader 4 - 81
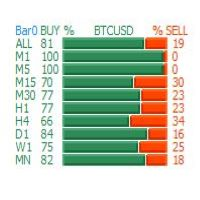
This MT4 indicator, Bull Bear Visual MTF V2, summarize the strength color graphic and percentages of power for both Bull and Bear in current market emotion stage which will show you in multi timeframes (9) and sum of the total Bull and Bear power strength which is an important information for traders especially you can see all Bull and Bear power in visualized graphic easily, Hope it will be helpful tool for you for making a good decision in trading.

The Trend Display is a nice additional Tool to identify the current trend of the pair you want to trade.
It shows you the direction of the trend in the separate charts.
That way you have a nice overview of the direction in one chart.
You do not need to swap between each time frame to identify the trend.
I wish everyone the most possible success when trading FX. Thank you for using that Indicator.

This MT4 indicator, Stochastic Visual MTF, summarize the oscillator values in color graphic for both Main and Signal in current market emotion stage which will show you in multi timeframes (9) and sum of the total Main and Signal oscillator values which is an important information for traders especially you can see all oscillator values in visualized graphic easily, You can add more by Shift, Hope it will be helpful tool for you for making a good decision in trading.
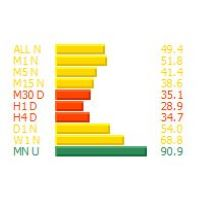
This MT4 indicator, Rsi Visual MTF, summarize the oscillator values in color graphic in current market emotion stage which will show you in multi timeframes (9) and sum of the total Rsi oscillator values which is an important information for traders especially you can see all oscillator values in visualized graphic easily, Hope it will be helpful tool for you for making a good decision in trading.

This FX indicator shows exactly when you need to buy or sell a position and is based on moving average indicator (golden cross and dead cross). If a golden cross or dead cross is detected, arrows will appear and an alert will sound. If you see the up arrow , the price will go up . When there appear down arrow , the price will go down . So you can decide easily buy or sell based on the information which you can gain from moving average! You can adjust the period in parameter settings. Default nu

MA Bounce стратегия - это стратегия, которая направлена на открытие длинных позиций по валютным парам при сильном восходящем тренде, когда они отскакивают от своей поддержки в виде скользящей средней, и короткие позиции валютных пар при сильном нисходящем тренде, когда они отскакивают от сопротивления в виде скользящих средних. Лучшими подходящими периодами скользящих средних для этой стратегии являются 18, 30, 50. Этот индикатор помогает идентифицировать и находить место для потенциального вхо

Не перерисовывающийся канал для трендовой торговли. Строится по ATR и имеет противоположную границу волатильности. Индикатор хорошо зарекомендовал себя в стратегии по импульсным уровням и ложным пробоям. Точку входа следует искать на коррекции к линии индикатора, а тейк-профит устанавливать на противоположной границе. Blog-Link - Retest and Fake Breakout with UPD1 .
Входные параметры.
Bars Count - история для отображения. ATR - период для расчёта. Coefficient - коэффициент, влияющий н
FREE
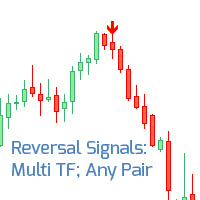
Мультивалютный индикатор сигналов разворота Посмотрите Мой #1 Торговый ассистент : включает 66 + функций и индикаторов | Свяжитесь со мной если у вас есть вопросы Сигналы рассчитываются на основе уровней перепроданности и перекупленности. Индикатор работает с любыми торговыми инструментами и на любых таймфреймах. Сигналы дополнительно фильтруются на основе индикаторов тренда. //------ Цвета стрелок можно настроить во входных параметрах. Доступны опции уведомлений: алерты в терминале и pu

Универсальный инструмент для определения трендов, флетов и торговли по графическим паттернам. Объединяет техники Гана, Эллиота, Мюррея.
Просто разместите его на графике и он покажет направление и скорость движения цены, выделит разворотные моменты.
Maltese cross поможет точно определять узловые моменты в истории, планировать торговые действия и сопровождать открытые сделки. Основные принципы Maltese Cross отображает линии Trend, Flat и Impulse до и после выбранного момента. Цена движется между

Dark Absolute Trend is an Indicator for intraday trading. This Indicator is based on Trend Following strategy but use also candlestick patterns and Volatility. We can enter in good price with this Indicator, in order to follow the main trend on the current instrument. It is advised to use low spread ECN brokers. This Indicator does Not repaint and N ot lag . Recommended timeframes are M5, M15 and H1. Recommended working pairs: All. I nstallation and Update Guide - Troubleshooting guide

COLORED TREND MA / MACD CANDLES draw MA Candles above/below Moving Average in a single color draw MA as a leading Line like a Supertrend draw MA as a Channel => MA High and Low draw MACD Candles above and below 0 and Signal-Line
Your Advantage: a simple view of the trend direction a simple view over the higher trend direction a calmer chart for the eye clear rules can be defined Settings: Bars to process : 6000 is my default, this value is up to you Value Quick-Set : pre-Settings MACD 12 / 26
FREE

Этот индикатор на панели инструментов с несколькими символами может отправлять оповещения при обнаружении сильного тренда. Это можно сделать, построив приборную панель с использованием следующих индикаторов / осцилляторов (далее упоминаемых как индикаторы): RSI, Stochastics, ADX, CCI, MACD, WPR (процентный диапазон Вильямса, также называемый Williams% R), ROC (цена Скорость изменения) и Окончательный осциллятор. Его можно использовать со всеми таймфреймами от M1 до MN (одновременно может отображ

Интеллектуальный алгоритм индикатора Ferbey с высокой вероятностью показывает точки потенциального разворота рынка. Индикатор Ferbey отлично подойдет для трендовой торговли! Если вы торгуете по тренду то стратегия торговли построенная на основе данного индикатора отлично вам подойдет.
Индикатор фильтрует рыночной шум, приктически все и все необходимые функции для работы по треду встроены в один инструмент. Работает на всех валютных парах и на всех таймфреймах, настройка индикатора - по вашему

Индикатор Life Trend может отследить устойчивое движение цены в определенном направлении. При этом само движение может быть нисходящим, восходящим или боковым, когда движение рынка не имеет ярко выраженной направленности. Индикатор работает на основе двух moving average а также осцилятора. Используя алгоритм поиска сигналов индикатор формирует сигналы в виде стрелок.
Торговля на основе показателей тренда самая простая и, зачастую, самая эффективная. Если правильно определить начало тренда, рез

Это пользовательский индикатор на основе двух технических индикаторов "RSI" и"Aligator" с гистограмами для проведения технического анализа рынка валют,
валютных пар, драг металлов и нефти, а также можно анализировать различные криптовалюты, такие как биткойн и эфириум. Индикатор анализирует
котировки и на основе их данных на графике отображает свои значки для анализа торгов. Индикатор очень хорошо работает, не зависает и не
тормозит даже слабый процессор в компьютере , а также весьма не
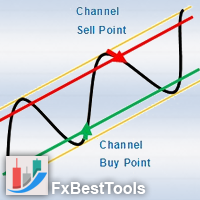
Channels Indicator is an All-In-One Indicator with a powerful calculation engine. The Indicator contains 4 different and usual methods for finding channels on the market. Indicator is powered by a visual interface and with various selections of alerts and notifications.
Testing Indicator : Strategy Tester does not respond to your clicks on panels (This is metatrader tester limitation). Thus input your desired settings on the indicator pre-settings and test.
Using Indicator :
Display 4 Typ

Индикатор Objective можно рассматривать как готовою торговою систему. Индикатор анализирует динамику рынка для точек разворота. Можно использовать как индикатор каналов или индикатор уровней!
Принцип работы индикатора заключается в том, чтобы при размещении на график автоматически определять текущее состояние рынка. Показывает благоприятные моменты входа в рынок полосками.
Данный индикатор позволяет анализировать исторические данные, и на их основании выводить на экран трейдеру указания к дал

Индикатор Beautiful показывает точки потенциального разворота рынка. Интеллектуальный алгоритм индикатора не плохо определяет тренд, отфильтровывает рыночный шум и генерирует входные сигналы и уровни выхода. Использует всего один параметр для настроек. Простое, визуальное и эффективное обнаружение тренда. Индикатор не перерисовывается и не запаздывает. Можно настроить сигналы сообщений в виде звука или емейла. Работает на всех валютных парах и на всех таймфреймах. Готовая торговая система.
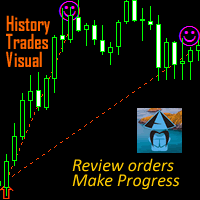
Name: History Trades Visual Purpose: Show history orders' open&close time&price ,drawing the route. You can review the trades, help analyzing and getting progress. Advantage: Easy to use, small and stable, no interference with other indicators and objects on charts.
Step of using: 1. List the history orders in account history page in MT4. 2. Click this indicator from the directory, then the history traders will be shown in the main chart for current symbol. 3. For better visual display acco

This indicator, Bull Bear Easy MTF, summarise the strength color graphic and percentage of power for both Bull and Bear in current market emotion stage which will show you in multi time frames and sum of the total Bull and Bear power strength which is an important information for traders especially you can see all Bull and Bear power in visualized graphic easily, Hope it will be helpful tool for you for making a good decision in trading.

Индикатор Trading Strategy призван помочь трейдерам в поиске оптимальных входов в сделку и выходов из неё. В его основе лежат показания технических индикаторов (MA, RSI, ATR и др.), а также авторский алгоритм, связывающий их сигналы в единое целое. Индикатор даёт сигналы на покупку и продажу в виде стрелочек: стрелочка вверх — сигнал на покупку, вниз — на продажу. В правом верхнем углу показаны сигналы индикатора на 6 таймфреймах (M1, M5, M15, M30, H1, H4) данной валютной пары.
Индикатор сво

This is an oscillator indicator unlike other. All the value is more than 0. Value between 0-20, trend are weak :- do not trade. When the value is more than 20 :- Open trade depend on color. Long Setup : DirectTrend is above 20 There are two consecutive Green histograms The second Green histogram is higher than the first A trader Long the third candlestick on the open Short Setup : DirectTrend is above 20 There are two consecutive Red histograms The second Red histogram is higher than the first

The indicator plots higher timeframe Kijun-sen (of Ichimoku ) on lower timeframes.
To change timeframes, in the timeframe field enter the number:
M1 PERIOD_M1 1 1 minute. M5 PERIOD_M5 5 5 minutes. M15 PERIOD_M15 15 15 minutes. M30 PERIOD_M30 30 30 minutes. H1 PERIOD_H1 60 1 hour. H4 PERIOD_H4 240 4 hour. D1 PERIOD_D1 1440 Daily. W1 PERIOD_W1 10080 Weekly. MN1 PERIOD_MN1 43200 Monthly.
By default, the Kijun is shifted 3 periods forward but if you wish to have it exactly as

White Crow Indicator
by VArmadA A simple yet powerful candle analysis based indicator using the White Soldiers & Crow patterns.
Works with timeframes 1H and higher and tested on all major pairs. Pay attention to the signal: An arrow indicating a long or short entry.
How It Works:
Arrows indicate a ongoing trend. After multiple bullish or bearish candles in a row the chances for another candle towards that trend is higher.
Instructions: - Crow Count: Set the number of candles that need to s
FREE

Abiroid Multi Slope indicator allows you to calculate a Slope Histogram for any line of any indicator . Histogram is for 1 slope line only, but slope values can be calculated for 3 lines total. To have multiple histograms, add as many Slope indicators for custom indicators as you like on chart. You just need to provide the Indicator name, buffer value, slope's period and max number of bars back. By default it has slope calculation for TDI_v4.ex4 indicator. There is no way to specify parameters f
FREE
Here on some thoughts about the sl dash information and layout for strength indicators for clarity and view. We have Bid Ratio, Relative Strength, Currency Strength, Absolute Strength, Gap and Sync.
Bid Ratio is based on the current price as a percentage of the Day Range. This range can be based on the Day Bar (the time elapsed since the brokers open time) or Rolling (the last 24 hours).
Relative Strength is the Bid Ratio of a pair expressed in a range of gap diffrent value -9 to +9.
Currenc

This indicator Matrix X indicator.Indicator displays Stochastic oscillator,Williams Percent Range,DeMarker,Relative Strength Index,Matrix trend movement. Indicator helps to buy and sell.Matrix trend = (Stochastic+WPR+DeMarker+RSI)/4. Features
KPeriod - displays Stochastic K period. DPeriod - displays Stochastic D period. Slowing- displays Stochastic Slowing. Stochastic_Method - displays Stochastic Method. Stochastic_price - displays Stochastic Price. WPR_per - displays WPR period. Dem_per - disp
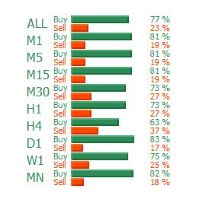
This MT4 indicator, Bull Bear Visual MTF (9 Time Frames), summarize the strength color graphic and percentages of power for both Bull and Bear in current market emotion stage which will show you in multi time frames and sum of the total Bull and Bear power strength which is an important information for traders especially you can see all Bull and Bear power in visualized graphic easily, Hope it will be helpful tool for you for making a good decision in trading.

This indicator shows the high volume zone. From the last minutes that you set yourself, the image of the volume zone is generated on an ongoing basis. The indicator also shows the V-Poc, Average Volumen and V-WAP lines. if you are using high intervals you must enter a large number of minutes. the zone builds itself up as the chart moves. if you want to build a zone from: last day - 1440 minutes, last week - 10080 minutes, ... etc. If you need an indicator that shows the constant volume zone
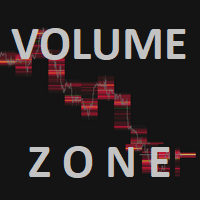
This is an indicator that shows high volume zones and very important points such as V-POC, Average Volume and V-WAP, its use is very similar to the volume Profile but has much more use, You can adjust the time interval in which the zone is to be built, I recommend high compartments type D1, W, M. But if you are using very low time intervals you can also use lower TF zones. If you need an indicator that shows the variable volume zone range frames there is ...HERE...
Volume Zone is an advan

LyfUD指标专门 为黄金设计的趋势指标 ,也可以用于任何金融工具。用于及时反映多空力量,由U线和D线组成, 波动以0为中轴偏离运行, U线为快线D线为慢线。 LyfUD指标可以和 绝大多数策略结合使用 ,能够更加有效的把握风控。 U线和D线采用价格行为市场追踪算法,能及时反映市场方向, 可用在任意货币。 特性: 1. U线、D线在0轴上方,买入信号参考。 2. U线、D线 在0轴下方 ,卖出信号参考。 3. U线、D 线极限背离转向,行情可能出现反转。 4. 滞后性低,能及时反映趋势。 致力于结合其他指标,LyfUD和 均线、Pinbar 等搭配使用能迅速找到一些合理的关键位。 LyfUD只作为参考依据,其风险与作者无关。未经作者同意,禁止他售。
FREE
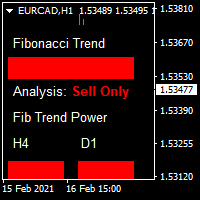
Our buy and sell indicator provides precise entry points, guiding you on when to buy and sell while indicating the trend bias. This tool minimizes drawdowns and increases your winning percentage by aligning with the trend. Buy signals are represented by blue boxes alongside candles, signaling optimal entry points. Conversely, red boxes indicate sell signals. Additionally, the secondary indicator, Fibonacci trends, further enhances decision-making by complementing the primary signals.

交易是需要一个核心维度的,交易信号标准化机制,需求每一笔交易的开仓信号都是需要有依有据。比如我们这个单PINBAR交易策略。红色星星代表空头信号,蓝色星星代表多头信号。交易信号有实时提醒呈现,可以结合ZZ锯齿指标搭配的一起用希望我的这个指标帮你越早建立一个完善的交易信号指标---------------------------------------------------------------------------------------------------------------------------------------------------------------------------------------------------------------------------------------------------

Эта информационная панель представляет собой инструмент оповещения для использования с индикатором разворота структуры рынка. Его основная цель - предупредить вас о возможностях разворота на определенных временных рамках, а также о повторных проверках предупреждений (подтверждении), как это делает индикатор. Панель инструментов предназначена для самостоятельного размещения на графике и работы в фоновом режиме, чтобы отправлять вам оповещения о выбранных вами парах и таймфреймах. Он был разработ

ОПИСАНИЕ: Теория индикатора в том, что валюты, которые торгуются на европейской сессии - ночью спят. А проснувшись идут к золотой середине Фибоначчи, своим путем. Ночью формируется канал из которого они хотят выбраться, с утра с новыми силами в путь. Верхний уровень канала - зона покупки. Нижний уровень канала - зона продажи. Цели похода отмечены вверху и внизу цветами. Индикатор все параметры выдает в восемь буферов, которые можно прочитать програмно, для построения автоматических торговых сис

GoldTrend MT4 - is a leading indicator for Gold on MetaTrader 4
- In Update version has been added new ability on USD pairs
( AUDUSD, EURUSD, GBPUSD, NZDUSD, USDCAD, USDCHF, USDJPY )
- very easy to use , even for beginners
- Stoploss and Take Profit provided - no repaint, no redraw and no lagging
When you decide to enter the global market , then there is a technical skill you absolutely must have, - which is all about trends .
Why - GoldTrend is different from others :
Not only uptre

Multi Information Panel designed to give alot more precision to both trade entries and exits and provide an instant snapshot of a currency pair’s movement. Multi Information Panel works on any currency or timeframe (or it should) and displays the following in the bottom right corner of the chart..
A graph of Stochastic Oscillators on timeframes M1 up to D1. An indication of the market trend using EMA’s on timeframes M1 to D1. The direction of the MACD on the current chart, and crossing of the
Pivot Point Expert Этот индикатор рассчитывает цены поддержки и сопротивления в мультитаймфреймах с различной формулировкой и рисует их на графике в том стиле, который вы выбираете. И, если хотите, индикатор может предупредить вас, когда текущая цена достигнет этих опорных уровней.
Временные рамки: ежечасно, ежедневно, еженедельно, ежемесячно
Формулировки: Классик, Камарилья, Вуди, Демарк, Пол, Фибоначчи
Параметры оповещения: отправить мобильное сообщение, отправить электронное письмо

Price Channels are also known as Donchian Channels being named after Richard Donchian. They use the highest and lowest price of a set number of periods to create an upper and lower channel or envelope around the price. The upper channel shows the high of the number of periods chosen. The lower channel shows the low of the number of periods chosen. For example, the screenshot shows the Price Channels using 320 periods. The upper channel in the screenshot shows the highest high of the previous 3
FREE
Индикатор для бинарных опционов Время экспирацыи 1 свеча Таймфеймами от м1 до м15 Отсутствие перерисовки
Можно использовать любой мани менеджмент Если это будет мартингейл то доходность увеличится Мартингейл использовать на маленьком счету не рекомендуется Сигналы Синяя стрелка вверх сигнал на покупку Красная стрелка вниз сигнал на продажу Рекомендуется избегать торговли во время выхода сильных новостей
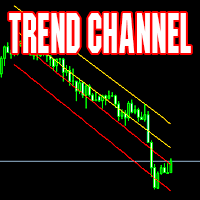
Индикатор каналов. Рассчитывается динамически. Подходит как для работы в направлении тренда, так и внутрь канала. Отличные результаты при работе на таймфреймах от 4Н по направлению в центр канала. Support: https://www.mql5.com/en/channels/TrendHunter Пример использования: при касании цены одной из крайних линий - открытие сделки в центр канала с тейк-профитом на ближайшей средней линии индикатора. Версия для МТ5 Индикатор можно использовать в советниках (4 буфера), получая данные стандартным с
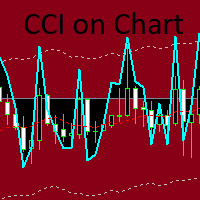
Индикатор CCi с динамическими уровнями на основе стандартной МА, взятой за основу отсчета уровней, и модифицированных данных стандартного CCi относительно МА. Входной параметр CutCCi если больше 0, ограничивает рисование графика CCi по вертикали, но не влияет на расчеты. Есть 3 варианта отображения стрелок: стрелки при пересечении уровней на выход из зоны уровней - тренд, стрелки на возврат после выхода из зоны уровней - реверс и пересечение нулевого уровня (красной линии МА). Можно отдельно
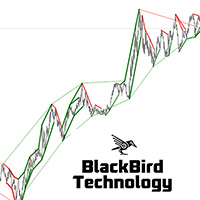
Multi Level Trend Direction is an indicator that identifies the most accurate buy/sell swing points with the highest probability, based on multi-level Zig Zag Swings. The indicator draws a color Zig Zag at the Higher Highs, Higher Lows, Lower Lows and Higher Lows in the chart, but based on two level Zig Zag Swing. If the fast price swing is in line with the trend of the slow price swing, then the buy/sell trend lines are bigger. If the price swing is against the trend, no lines are drawn to si

This is a volume profile where you can customize the time period you want. You can do this with a line or choose automatic functions such as showing the volume from the last time period. The indicator also shows the maximum volume value (VPOC - VOLUME POINT OF CONTROL) and the average value, colors and settings you can adjust as you like, there are many possibilities. If you need an indicator that shows the constant volume time frames there is ...HERE... Volume Profile is an advanced charting

This indicator alerts you when lines are touched by price. You can change the interval between alerts. You can change colors and styles of lines as you want. However, lines must be named "Upper" and "Lower .Or "Third" and "Fourth".
*There is a free version .
Functions Additionaly,you can add third and fourth aletable line.
You can calculate distances in charts between Upper and Lower lines.
You can depict arrows in charts when alerts is activated.
You can make every HLine and TLine alertable

This is a volume profile that shows the volume with a fixed constant time frame that you set. The indicator also shows the maximum volume value (VPOC - VOLUME POINT OF CONTROL) and the average value, colors and settings you can adjust as you like, there are many possibilities. If you need an indicator that shows the variable volume range frames there is ...HERE... Volume Profile is an advanced charting study that displays trading activity over a specified time period at specified price leve

Volume, momentum, and market strength are key indications that price is about to move in a certain direction. The Volume-solution indicator is one indicator which can help traders objectively classify a momentum type of trade setup as one having volume and strength or not. What is the Volume-solution Indicator? The Trading Volume indicator is a custom technical indicator which works somewhat like a market sentiment indicator. It indicates the strength of the bulls and the bears of the market. Wh

Action Alert indicator generates and writes data on the chart when performing any modification to the dead process. Expertise Properties: An audible alert is issued in the name of the operation and the labor that has been made You only need one chart Writes the processed operations in clear handwriting The font color can be controlled on the chart Setting Action Alert indicator
What is meant by it is to alert me any change in my deals of , it will reverse if any new deal comes out, al

With the purchase of the Auto-Harmonic Pattern Recognition Trading Software for MT4 , you will have access to: The Auto Harmonic Pattern recognition software is designed to take the heavy lifting out of a traders Harmonic trading strategy. The Software automatically Identifies and Projects Harmonic Pattern Completion Zones for the 6 most trade-able Harmonic Patterns. If the Pattern Completes in the projected zone, then there is a high probability of the resulting trade being successful. Pleas
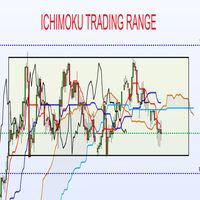
scanner de gamme commerciale Ichimoku: ne manqué plus le début d'une gamme. capable de suivre plusieurs paires cet indicateur surveille: les croisements de SSA et SSB (cela indique une forte possibilité de la mise en place d'un range) il identifie les bougies de retournements Il vous alerte quand les deux éléments apparaissent (croisement + bougies). vous pouvez ajouter le filtre du stochastique, ainsi l'alerte se fera seulement s'il y en compétemment le stochastique en surachat ou survente 80/

Concept of Market Profile was created at Chicago Board of Trade (CBOT) by trader Peter Steidlmayer and first published during the 1980s as CBOT product. Market profile by itself is not a stand-alone strategy, but a different way how you can view the market and make better trading decisions.
They have seen a market as an auction process which is affected by supply and demand the same way as every other auction, for example, development of prices of food, gas etc.
The price goes up as long th
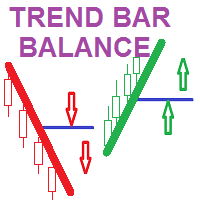
Trend Bar Balance Indicator Simple indicator based on trend detection and support resistance breakage It detects the major trend and the minor support and resistance levels *** a signal for UP /BUY is detected and alerted in a BULL trend and a resistance level break *** a signal for DOWN /SELL is detected and alerted in a Bear trend and a support level break THE POWER OF THIS INDICATOR I USE IT WHEN YOU COMBINE ITS DAILY SIGNALS FROM DIFFERENT CHART SYMBOLS AT SAME TIME AND CLOSE ALL ORDERS BY

A simple and highly effective Strength and Weakness currency indicator that can be used to aid your fundamental and technical analysis for winning trade decisions.
The indicator is very easy to use and can be applied to all time frames.
FX Tiger uses an advanced algorithm to calculate a score table for all major currencies. Each major currency will have a score from 7 to -7. A score of 5 and above indicates currency strength and a score of -5 and below indicates currency weakness. Once you ha
FREE
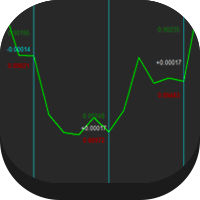
This indicator gives the highest and lowest information of the currency you have selected and the day you selected. It also shows the average. In this way, you can find out the profit / loss probability of your transactions for the same days. Reported: Average points per week Average points per year Lifetime average points Note: It does not provide you with buy / sell signals. Shows average points only
FREE

The Perfect Supply & Demand Indicator for the MetaTrader 4 Platform ! It comes packed with the following features...
Supply & Demand Zones
The indicator charts Supply & Demand Zones on your favorite profiles. It works on all time frames and in all markets. Fresh & Used Zones
The indicator color codes each zone so that you know if it's fresh or not.
When the zone is no longer fresh it changes color, indicating that price have already traded at the level once or multiple times before. Structure

Информационная панель ADR Alert показывает вам, где в настоящее время торгуется цена по отношению к ее нормальному среднему дневному диапазону. Вы будете получать мгновенные оповещения через всплывающие окна, электронную почту или push-уведомления, когда цена превышает свой средний диапазон и уровни выше него по вашему выбору, чтобы вы могли быстро переходить к откатам и разворотам. Черта предназначена для размещения на пустом графике и просто находится в фоновом режиме и предупреждает вас о до

Панель предупреждений RSI / TDI позволяет вам одновременно отслеживать RSI (выбирается вами) по каждой основной паре, которой вы торгуете.
Вы можете использовать его двумя способами:
1. Выберите несколько таймфреймов, и тире покажет вам, когда несколько таймфреймов выходят за рамки обычных торговых условий. Отличный индикатор того, что цена в последнее время сильно подросла, поскольку она достигла уровня перекупленности или перепроданности в нескольких временных рамках, поэтому вскоре ожидае

All Candlesticks Library - это индикатор, который предлагает интеллектуальную систему распознавания образов с ДЕЙСТВИТЕЛЬНО широким диапазоном вариаций свечей! Существует более 100 свечных паттернов, от обычных доджи и вариантов консолидации до ряда хорошо известных моментумных свечей и свечей прорыва и до редких паттернов, которые мы не видим каждый день.
ПЛЮС, он поставляется со статистикой (НЕ 100% ТОЧНОЙ, но достаточно справедливой)! Вы можете видеть подсвечники, оба или ни один, изменить

Данный индикатор показывает свечную комбинацию, основанную на додж, додж и пин-бар. Логика паттерна состоит в том, чтобы стать на стороне силы, после неопределенности. Индикатор универсален и пригодится для торговли бинарными опционами(дополнительный материал также будет предоставлен), форекс, ETF, криптовалюта и многое другое. Индикатор поддерживает таймфреймы от М15 до МN включительно.
В индикаторе присутствует отправка уведомлений и поддержка Push-уведомлений.
МТ5 версия : https://www.mql5.

Definition : VPO is a Volume Price Opportunity. Instead of using bars or candles with an Open, High, Low, and Close price, each "bar" in a Market Profile is represented by horizontal bars against the price It is called Market Profile terminology.
In other words volume-price-opportunity (VPO) profiles are histograms of how many volumes were traded at each price within the span of the profile.
By using a VPO chart, you are able to analyze the amount of trading activity, based on volume, for each

Definition : TPO is a Time Price Opportunity. Instead of using bars or candles with an Open, High, Low, and Close price, each "bar" in a Market Profile is represented by horizontal bars against the price It is called Market Profile terminology.
In other words time-price-opportunity (TPO) profiles are histograms of how much time was spent at each price within the span of the profile.
By using a TPO chart, you are able to analyze the amount of trading activity, based on time, for each price level

индикатор разработан для торговли на финансовых рынках для скальпинга, пипсовки инструмент использует в своем алгоритме уровни поддержки и сопровождения Это собственная стратегия и уникальная разработка сигналы стрелка вверх покупка стрелка в низ продажа рекомендуется использовать на таймфреймах до м 15 можно торговать от сигнала к сигналу внимание выделяйте на сделку не более 2% от депозита

Fibonacci Magic Pivot Levels The Fibonacci Magic Pivot Levels is a powerful yet easy to use indicator . It continuously monitor s intra-day price action and uses complex algorithms to calculate and detect key support, resistance and pivot levels, using the D1 timeframe as a filter. The Fibonacci Magic Pivot Levels is optimized for H4, H1, M30, M15, M5 & M1 timeframes and can be used on ALL Currencies, Indices, Commodities, and Cryptocurrency pairs . Trade with improved confidence an

Торговая система разработана для работы с золотом на временных периодах: 30M, 1H. Индикатор позволяет подстраиваться под рыночную ситуацию.
Параметры для 1H : PERIOD=9F , FILTER=300 .
Параметры для 30M : PERIOD=22B , FILTER=450 .
Допускается небольшая подстройка под конкретного брокера .
При изменении количества отображаемой истории, также может потребоваться подстройка параметров.
Индикатор не перерисовывается .
В "Gold n XAU" используются разные правила для входа в сделк
Start Signal один из самых надёжных инструментов для торговли на финансовых рынках С помощью Start Signal можно торговать как Бнарными Опционами так и на других рынках Таких как Форекс Изначально Start Signal разрабатывался для Бинарных Опционов Но в ходе торгов было принято решение что он так же хорошо подходит и для скальпинга При чем он предоставляет хорошую точность Отлично подойдёт как для новочков так и для опытных трейдеров Сигналы крайне просты и понятные Не нужно анализировать множе

InpRSIshort =13; // RSI short InpRSIPeriod =34; // RSI long PeriodRs =0; //Price 0C 4HL/2 5HLC/3 mafast =13;//mafast maslow =65;//MAslow
Double line RSI sub graph index. The parameters are adjustable. The RSI lines with two different cycles can be used to observe the trend strength effectively. Meanwhile, a short period cross long period color column image is displayed below. When the cycle (Jin Cha) is on the short cycle, the color of the column map changes from the light green to the
FREE

Индикатор Velocity of price change ( VP ) показывает среднюю скорость изменения цены на тех характерных промежутках времени, где эта скорость была приблизительно постоянной. Используемый в VP робастный алгоритм сглаживания цены от ее случайных скачков, обеспечивает надежность показания индикатора, который не реагирует на простую волатильность цены и её незначительные подвижки. Индикатор позволяет отслеживать тренды и моменты их разворотов , во время которых показ
Хорошый и надёжный инструмент если соблюдать правила мани менеджмента Разработан по собственной стратегии на уникальном алгоритме Индикатор полностью заточен под бинарные опционы Binary Luck очень прост в работе настраивать ничего не нужно Просто добавляем на график и можно приступать к торговли Отлично подойдёт как для новачков так и для опытных трейдеров Сигналы простые и понятные. Стрелка вверх покупка. Стрелка в низ продажа. Рекомендуемое время експирацыи 1 свеча. На одну сделку не более 3

Back testing can't; get indicator full performance
Trading the currency markets is a complex business. With so many pairs and multiple timeframes it is almost impossible to monitor them all – but with with the Currency Heatmap you can. The Currency Heatmap indicator delivers the information you need to base your trading decisions on the entire spectrum of currency pairs derived from the 8 major currencies; namely the US dollar, the Euro, the British Pound, the Swiss Franc, the Japanese Yen, t
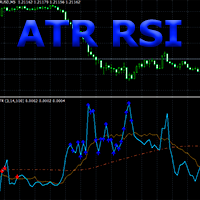
Композиция индикаторов ATR и RSI.
ATR RSI индикатор сопоставляет на одном графике два расчета индикатора ATR с периодами Fast и Slow, плюс линию среднего значения и зоны перекупленности (Overbought) и перепроданности (Oversold) индикатора RSI.
ATR по казывает значения изменения волатильности валютной пары в пунктах с учетом периода, задаваемого в качестве параметра. Точки входа, которые дает индикатор RSI показывают очень хорошее соотношение риск-прибыль на волатильных и трендовых рынках. ATR
MetaTrader Маркет предлагает каждому разработчику торговых программ простую и удобную площадку для их продажи.
Мы поможем вам с оформлением и подскажем, как подготовить описание продукта для Маркета. Все продаваемые через Маркет программы защищаются дополнительным шифрованием и могут запускаться только на компьютере покупателя. Незаконное копирование исключено.
Вы упускаете торговые возможности:
- Бесплатные приложения для трейдинга
- 8 000+ сигналов для копирования
- Экономические новости для анализа финансовых рынков
Регистрация
Вход
Если у вас нет учетной записи, зарегистрируйтесь
Для авторизации и пользования сайтом MQL5.com необходимо разрешить использование файлов Сookie.
Пожалуйста, включите в вашем браузере данную настройку, иначе вы не сможете авторизоваться.