Смотри обучающее видео по маркету на YouTube
Как купить торгового робота или индикатор
Запусти робота на
виртуальном хостинге
виртуальном хостинге
Протестируй индикатор/робота перед покупкой
Хочешь зарабатывать в Маркете?
Как подать продукт, чтобы его покупали
Новые технические индикаторы для MetaTrader 4 - 22
Индикатор соединяет лучшие черты классического осциллятора ADX с адаптивным цифровым фильтром. Индикатор позволяет входить в рынок и выходить из него в самом начале и конце тренда. Индикатор отличается высокой достоверностью сигналов, при этом сохраняя высокую чувствительность. Индикатор не перерисовывается на полностью сформированных барах. Параметры: Ind_Price - цена, используемая для расчета индикатора; Ind_Period - период индикатора. Правила применения: Большая красная точка - сильный медвеж
FREE
Данный индикатор отображает сигналы индикатора RVI. Технический индикатор Индекс Относительной Бодрости (Relative Vigor Index, RVI) базируется на идее того, что на бычьем рынке цена закрытия, как правило, выше, чем цена открытия. И наоборот — на медвежьем рынке. Таким образом, бодрость движения устанавливается положением, в котором цена находится в конце периода. Чтобы сделать индекс нормализованным к ежедневному диапазону торговли, изменение цены делится на максимальный диапазон цен в течение д
FREE
Индикатор соединяет лучшие черты классического осциллятора WPR с адаптивным цифровым фильтром. Индикатор позволяет входить в рынок и выходить из него в самом начале и конце тренда. Индикатор отличается высокой достоверностью сигналов, при этом сохраняя высокую чувствительность. Индикатор не перерисовывается на полностью сформированных барах. Параметры: Ind_Price - цена, используемая для расчета индикатора; Ind_Period - период индикатора. Правила применения: Большая красная точка - сильный медвеж
FREE
Данный индикатор представляет собой скользящую среднюю построенную с применением классического осциллятора Stochastic и ATR. Смена направления скользящей средней зависит от преодоления осциллятором Stochastic своего среднего значения и выхода цены за пределы диапазона определяемого с помощью ATR. На полностью сформированных барах индикатор не перерисовывается. Значения индикатора на баре не закончившем формирование могут изменятся.
Применение индикатора идентично применению стандартной скользя
FREE

Индикатор поддержки и сопротивления Wamek (WSR) - удивительный инструмент, выделяющийся в мире технического анализа. Он выделяется тем, что умело объединяет действия цен и ведущие индикаторы для определения уровней поддержки и сопротивления с высокой степенью точности. Его уникальной особенностью является его адаптивность; пользователи могут настраивать параметры ввода индикатора, что позволяет им создавать настраиваемые уровни поддержки и сопротивления, соответствующие их торговым стратегиям.

ZigZag Fibo Retracement Indicator Optimize Your Trading Strategy! Are you seeking to optimize your trading strategy in the financial markets? Explore the unique features of the ZigZag Fibo Retracement Indicator, a powerful tool designed to help you identify potential support and resistance levels based on the combination of ZigZag patterns and Fibonacci ratios. Integration of ZigZag Patterns and Fibonacci: The ZigZag Fibo Retracement Indicator combines the effectiveness of ZigZag patterns, helpi
FREE

Perfect for one minutes high trading and scalping. This indicator is very effective for trading on one minutes, in the hour. A combination of moving averages and STOCHASTICS calculation to produce a very convincing signal every hour. Blue colour signals a buy opportunity. Follow the X signs for possible buy points. The Blue average line serves as possible trend direction and support. Red colour signals a sell opportunity. Follow the X signs for possible sell points. The Red average line serves a

Bollinger Bands Stops Indicator for MT4 The Bollinger Bands Stops Indicator is a versatile tool designed to help traders make informed decisions in the financial markets. Developed for the MetaTrader 4 (MT4) platform, this indicator provides valuable insights by visually representing the Bollinger Bands along with stops and signals. Key Features: Bollinger Bands Analysis: The indicator incorporates Bollinger Bands, a widely used technical analysis tool. These bands help traders identify potentia
FREE

Sure, here's the introduction for the "Enhanced Volume" indicator designed for MetaTrader 4 (MT4):
--- ## "Enhanced Volume" Indicator for MetaTrader 4 (MT4)
Greetings MT4 Traders!
The "Enhanced Volume" indicator is a powerful tool designed to help you track and analyze trading volume alongside signals of changing market trends.
### Key Features:
1. **Separate Window Display:** The "Enhanced Volume" indicator can be displayed on a separate window, making it easy to observe and analyze
FREE
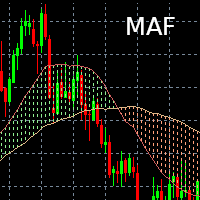
Indicateur Moving Average Filling Affiche deux moyennes mobiles (une courte et une longue) dont la durée et le type (Simple, exponentielle) est paramétrable. L'espace entre les deux moyennes mobiles est alors colorié (rempli) :
- Vert si courte > longue
- Rouge si courte < longue Il est possible de changer les couleurs selon les préférences de chacun / chacune.
Please feel free to contact me if you need any further information.
Please let me know if you have any questions.
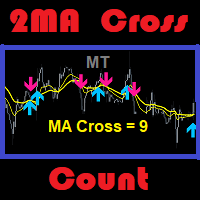
I hope the above is useful to you. MT 2ma Cross Count : is a moving average with 2 lines crossing but the strategy is to focus on the desired number of history bars and count signals that occur. Suitable for traders specialize in martingale strategy or traders specialize in technical ... etc. Traders with the ability to do fundamental analysis have an advantage. Because it will ma

Market Profile Heat indicator — is a classic Market Profile implementation that can show the price density over time, outlining the most important price levels, value area, and control value of a given trading session.
This indicator can be attached to timeframes between M1 and D1 and will show the Market Profile for daily, weekly, monthly, or even intraday sessions. Lower timeframes offer higher precision. Higher timeframes are recommended for better visibility. It is also possible to use a f

Introducing the "Zone of Supply and Demand Pro" Indicator - Redefining Precision with Multi-Time Frame (MTF) Technology and Non-Repaint Capability
In the intricate world of financial markets, understanding supply and demand can be the key to success. We are excited to present the "Zone of Supply and Demand Pro" - a powerful analytical tool designed not only to help you seize trading opportunities but also to ensure unparalleled accuracy through groundbreaking technology.
**The Significance

The Price Volume Trend Oscillator (PVTO) is a powerful technical analysis tool designed to provide insights into the relationship between price movements and trading volumes. This indicator offers a unique perspective on market trends, helping traders identify potential buying and selling opportunities. Parameters: EMA Short Period: Defines the short EMA period for calculating the PVTO. Default 3 EMA Long Period: Specifies the long EMA period for PVTO calculation. Default 10 EMA Signal Period: S
FREE
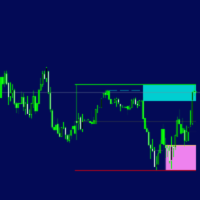
1. Updated usage instructions in blog below: Smart Market Structure Trading System and Automatic Scanner - Trading Systems - 13 October 2023 - Traders' Blogs (mql5.com) https://www.mql5.com/en/blogs/post/754495 2.1 YouTube video link for updated Panel control and new features: https://youtu.be/LM699E7JS3E 2.2 YouTube video link for feature introduction: https://youtu.be/tMU04wo0bc8 3. Smart Money Concepts, Support and Resistance, Buy Side Liquidity, Sell Side Liquidity, Monthly Highs/Lows, W

Закрытие предыдущего дня и смещение баров для MetaTrader! Индикатор Закрытие предыдущего дня и смещение баров - это инструмент, разработанный для улучшения технического анализа и принятия решений в торговле. С помощью этого индикатора вы получите подробную информацию о уровнях открытия, максимума, минимума и закрытия любого бара, что позволит провести точный и всесторонний анализ движения рынка. Представьте себе возможность поместить один таймфрейм в другой, позволяя детально анализировать кажды
FREE

Представляем PivotXpert , усовершенствованный индикатор Multichart , разработанный для улучшения вашей стратегии точек разворота. Раскройте свой потенциал без особых усилий с помощью интуитивно понятного интерфейса, который делает сводную торговлю легкой.
Мультиграфический режим PivotXpert упрощает вашу торговлю, рисуя опорные линии на всех открытых графиках. Легко рассчитайте оставшиеся пипсы до каждого уровня с помощью функции CalculatePips, которая с легкостью настраивает вашу стра
Введение:
Turning Zone — это сложный инновационный индикатор MT4, предназначенный для предоставления трейдерам мощного инструмента для обнаружения потенциальных разворотов тренда на финансовых рынках. Используя вневременную концепцию анализа вил, индикатор Turning Zone определяет ключевые зоны разворота, где рыночные настроения могут измениться, предлагая трейдерам ценную информацию для принятия обоснованных решений. Версия MT5 : WH Turning Zone MT5
Сопутствующий продукт : WH Trend Co

Раскройте торговую информацию с помощью Auto Anchored VWAPs: Auto Anchored VWAPs служат вашим руководящим спутником в мире торговли. Эти индикаторы указывают на важные точки разворота на рынке и иллюстрируют их на вашем графике с использованием линий VWAP. Это изменит игру для трейдеров, использующих стратегии с якорными VWAP. Как это работает? Определение верхних точек: Если наивысшая цена текущей свечи ниже наивысшей цены предыдущей свечи, И предыдущий максимум выше, чем предыдущий, Мы определ

Привет,
Вы ищете оптимальное решение для получения прибыли на финансовом рынке на платформе MetaTrader 4 (MT4)? Представляем "Sonic R Non Repaint Smart" - интеллектуальную торговую систему, обеспечивающую точность и эффективность для трейдеров.
Знакомство с "Sonic R Non Repaint Smart":
"Sonic R Non Repaint Smart" - это надежный торговый индикатор, основанный на высоко ценной торговой стратегии Sonic R. Мы с гордостью предлагаем решение, которое помогает не только точно определять тренды р

Индикатор MOST — очень популярный индикатор, используемый на других платформах, особенно для акций и индексов. В основе лежат скользящие средние и уровни максимума-минимума. Может быть уместно использовать процентное значение 2 для акций и индексов и 1-1,5 для инструментов форекс. Вы можете сделать свою собственную настройку для каждого инструмента. Это простой в использовании, простой и понятный индикатор. Чаще встречается на часовых и дневных графиках. Пока редактировал только для платформы МТ

Индикатор "No repaint" предназначен для анализа рыночной динамики и определения моментов возможных торговых сигналов. Основной особенностью этого индикатора является отсутствие перерисовки сигналов, что способствует более точному и надежному прогнозированию движения цен на рынке. Механизм работы: Индикатор "No repaint" использует несколько видов графических элементов для обозначения торговых сигналов: Стрелки вверх и вниз: Индикатор отмечает возможные точки входа в рынок стрелками вверх и вниз.
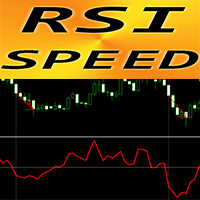
Forex Indicator "RSI SPEED" for MT4 - great predictive tool! The calculation of this indicator is based on equations from physics . RSI SPEED is the 1st derivative of RSI itself RSI SPEED is good for scalping entries into the direction of main trend Use it in combination with suitable trend indicator , for example HTF MA (as on pictures) RSI SPEED indicator shows how fast RSI itself changes its direction - it is very sensitive It is recommended to use RSI SPEED indicator fo

Automatically detect bullish or bearish order blocks to optimize your trade entries with our powerful indicator. Ideal for traders following ICT (The Inner Circle Trader). Works with any asset type, including cryptocurrencies, stocks, and forex. Displays order blocks on multiple timeframes, from M2 to W1. Alerts you when an order block is detected, migrated, or a higher timeframe order block is created/migrated. Perfect for both scalping and swing trading in Smart Money Concepts. Enhanced by st
FREE

The Fair Value Gap (FVG) is a price range where one side of the market liquidity is offered, typically confirmed by a liquidity void on the lower time frame charts in the same price range. Price can "gap" to create a literal vacuum in trading, resulting in an actual price gap. Fair Value Gaps are most commonly used by price action traders to identify inefficiencies or imbalances in the market, indicating that buying and selling are not equal. If you're following the ICT Trading Strategy or Smart
FREE

Это объединение нескольких осцилляторов в единую систему дивергенции, что создает впечатление более надежного индикатора дивергенции. Он основан на нескольких валютах и лучше всего работает на таймфрейме 15 минут и выше. Каждый раз, когда генерируется сигнал, он показывает предупреждение пользователю. Он более идеален в сочетании с другими индикаторами ценового действия или торговыми системами.

Global Trend Lines
Индикатор, который показывает зоны покупки и продажи, может иметь несколько характеристик, которые могут быть полезны для улучшения вашей торговой стратегии. Основные характеристики этого индикатора включают: Определение уровня тренда: в индикаторе присутствуют алгоритмы для определения уровня тренда. Это поможет вам определить направление и силу тренда. Определение зон покупки и продажи: индикатор показывает зоны покупки и продажи на графике. Это поможет вам определить
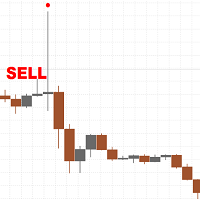
There are only a limited number of copies left, priced at 390 USD . After that, the price will be raised to 450 USD. I develop honest Indicators and know what can work in the market in the long term and what cannot. The classic and most powerful price action pattern is called the pin bar. This pattern works well after the release of fundamental news on M15, M30 and H1 timeframes, but can also be used on other timeframes such as M5 or D1. By default, the settings are set for the H1 timeframe,

Welcome to Propsense, the best solution for new and veteran traders with a simple FREE strategy! This indicator is a unique and affordable trading tool built on the teachings of a former bank trader. With this tool, you will be able to see inefficient points with ease. As well as this, traders will have an interactive display panel which will show your running and closed P/L in pips AND currency units. It also allows you to set your desired daily target/loss limit! IMPORTANT INFORMATION
Maxim

Данный индикатор отображает на графике цены сигналы высокоэффективного осциллятора - Laguerre Osc 2 AM . Представленный индикатор использует фильтр Laguerre для построения осцилятора. Индикатор имеет возможность двойного дополнительного сглаживания, что может быть полезно при малых значениях параметра Gamma. Индикатор подает три типа сигналов: Выход осциллятора из зоны перекупленности/перепроданности; Пересечение осциллятором середины значения между зонами перекупленности/перепроданности; Вход
FREE
Данный индикатор отображает на графике цены сигналы индикатора Laguerre Osc AM . Представленный индикатор использует фильтр Laguerre для построения осцилятора классического типа, похожего по своему виду и способу применения на обычный MACD. В то же время данный инструмент намного более гибок в настройках по сравнению с обычным MACD и благодаря применению фильтра Laguerre более чувствительный к движениям цены. Laguerre Osc позволяет подобрать параметры таким образом чтобы быть эффективным практич
FREE
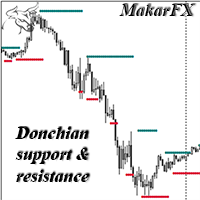
Индикатор уровней поддержи и сопротивления на основе канала Дончиана. Самый известный пример торговли по каналу Дончиана — эксперимент с группой черепашек, которые за пять лет заработали сто двадцать пять миллионов долларов. Этот индикатор можно использовать, как самостоятельный инструмент, а также как дополнительное подтверждение.
Есть MTF, не рисует NRP.
Есть настройки цвета и толщины.

**Introducing Supply Demand Zones Indicator for MT4**
Hello, esteemed traders in the financial markets! Today, we are pleased to introduce to you a powerful tool called the "Supply Demand Zones Indicator" - a valuable utility designed for the MetaTrader 4 (MT4) platform, aimed at helping you identify key supply and demand areas on your trading charts.
**Brief Introduction:** The Supply Demand Zones Indicator is a unique technical analysis tool that assists in pinpointing significant price l
FREE

This is a dashboard indicator that displays the Average Level of each selected currency pairs that filters and gives us a signal for overbought (>=90%) or if price at extreme peak above 90, and/or oversold (<=10%) or if price at extreme peak below 10.
The calculation is using Relative Strength Index default periods (2 & 9) applied to three different higher time frames H4,D1,&W1.
This won't change or altered even if you change symbol or switch to lower time frames or even in monthly and y

Stochastic Scanner is a multi symbol multi timeframe Stochastic dashboard that monitors the indicator for price entering and exiting overbought and oversold in up to 28 symbols and 9 timeframes.
Download Demo here (Scans only M1 and M5) Settings description here MT5 version here
Stochastic Scanner features: Signals price entering and exiting the overbought and oversold zones. Monitors up to 28 customizable instruments and 9 timeframes at the same time. You can choose between 3 alert mo

Dear everyone, Today, I would like to introduce you to an amazing tool on the MetaTrader 4 platform - "Pivotal Moments." This indicator will be a reliable companion on your trading journey in the financial market. "Pivotal Moments" is not just an ordinary indicator, but an intelligent tool that helps you better understand significant fluctuations on the chart. With a variety of customization options, it provides valuable information and deep insights into the market. The key features of "Pivotal
FREE
The Symbol and Timeframe Display Indicator for MetaTrader 4 (MQ4) is a versatile tool designed to enhance your trading experience by providing essential information about the current chart's symbol and timeframe directly on the screen. This user-friendly indicator offers customizable features that allow you to position the text display according to your preferences and enables convenient text toggling through keyboard interactions. Key Features: Symbol and Timeframe Display: The indicator promin
FREE

**"Support and Resistance Breakout" Indicator for MetaTrader 4 (MT4)**
Hello traders and investors on the MetaTrader 4 (MT4) platform,
We are excited to introduce to you the "Support and Resistance Breakout" indicator - a powerful tool designed for MT4 that helps you capitalize on trading opportunities involving support and resistance breakouts effectively and confidently.
**Overview:**
The "Support and Resistance Breakout" indicator is a custom tool built on the MetaTrader 4 platform,

Welcome to the "Keltner Amplified Breakout" Indicator Are you searching for a powerful and effective trading tool on the MT4 platform? Let us introduce you to the "Keltner Amplified Breakout" Indicator. Designed to help you capture potential trading opportunities, this indicator offers the perfect blend of high performance and user-friendliness. Key Advantages: Identify Strong Trends: This indicator utilizes Keltner channels and fractal signals to identify robust upward or downward trends in

Hidden Gap by MMD Hidden Gap by MMD is a unique indicator that detects hidden gaps between three consecutive candles. This observation isn't my own, but in the MMD methodology, it has its application alongside other original indicators. You can apply this indicator to the chart multiple times and set the interval from which you want to see the hidden gaps. You can show or hide these gaps as needed. For example, you can view the chart at an M5 interval and see hidden gaps from an M15 chart, etc.

Простой и удобный индикатор, указывающий зоны стандартных индикаторов в различных таймфреймах, при необходимости можете в настройках изменить параметры RSI- Relative strength index. Стрелка вверх- если сигнальная линия ниже уровня 300, стрелка вниз- если сигнальная линия выше уровня 70 STOCH- Stochastic. Стрелка вверх- если сигнальная линия ниже уровня 20, стрелка вниз- если сигнальная линия выше уровня 80 ENVELOPE - Envelopes. Стрелка вверх- если свеча открылась ниже красной линии индика

This indicator shows when user set sessions are active and returns various tools + metrics using the closing price within active sessions as an input. Users have the option to change up to 4 session times.
The indicator will increasingly lack accuracy when the chart timeframe is higher than 1 hour.
Settings
Sessions
Enable Session: Allows to enable or disable all associated elements with a specific user set session.
Session Time: Opening and closing times of the user set session

The Donchian Scanner Signals Indicator with is a powerful tool designed for traders operating in the financial market using the Metatrader 4 platform. This indicator combines the popular Donchian Channels strategy with advanced signalization and real-time alert features, providing a clear view of potential entry and exit points in a financial asset. Key Features: Donchian Channels Visualization: The indicator graphically displays Donchian Channels on the price chart. These channels are formed us

Hey traders, it's easy for you to find when to buy or sell signals. Can be used for all forex pairs including gold. How to use this indicator on the M30 or H1 timeframe, for a buy signal, wait until an up arrow appears and for a sell signal, wait for a down arrow, place a stop loss 5-10 points below the arrow. Better trading time on the London and New York sessions and avoid trading when there is news. Happy Trading

This is a dashboard indicator that displays the auto-calculated risk lot, with the given risk percentage & risk points (Stop Loss) and others. The main function of this indicator is to help you calculate your exact scalping risk lots and swing risk lots. Also it displays the active trades of each pair you've executed with the following: type of trade, lot size, symbol, & equity(+/-). Also displays the bar counter set in every 5-minute bar timer. (whichever time frame you're active, the bar time

Индикатор Full STO (включает в себя все версии трех индикаторов STO: Premium, Gold, Silver) - STABLE TRADE OPTION предназначен для автоматической торговли бинарными опционами. ЧИТАЕМ ВНИМАТЕЛЬНО!!!!!
ВАЖНО
В одном терминале создаем два шаблона с разными экспирациями, шаблон на 18:01, 18:02 с экспирацией от 1 до 15 минут и шаблон 22:00 c экспирацией от 10 до 20 минут.
Winrate: 71% over the past 5 years Money management: 0.3% from the deposit
Данная версия индикатора настроена только на

Представляем Binary Smart System: Ваш идеальный торговый компаньон Binary Smart System — это не просто индикатор, это сложный торговый инструмент, тщательно разработанный для обеспечения трейдеров точными и своевременными сигналами на различных рынках. Основываясь на передовых алгоритмах и обширной коллекции технических индикаторов, эта система является ключом к успеху в торговле. Компоненты индикатора: Процентное значение скользящей средней (MAP) : Этот компонент вычисляет взвешенное среднее зн

Вы устали вручную рисовать уровни Фибоначчи на своих графиках? Вы ищете удобный и эффективный способ определения ключевых уровней поддержки и сопротивления в своей торговле? Не смотрите дальше! Представляем DrawFib Pro, совершенный индикатор для MetaTrader 4, который выполняет автоматические уровни Фибоначчи. рисование на ваших графиках и предоставление своевременных предупреждений при нарушении этих уровней. С DrawFib Pro вы можете улучшить свои торговые стратегии, сэкономить время
FREE

Добро пожаловать в индикатор распознавания паттернов Advanced Gartley Этот индикатор обнаруживает паттерн Гартли на основе HH и LL ценовой структуры и уровней Фибоначчи, и при достижении определенных уровней Фибоначчи индикатор отображает паттерн на графике. Версия MT5: WH Advanced Gartley Pattern MT5
**Этот индикатор является частью комбинации WH Ultimate Harmonic Patterns MT4 , включая все функции распознавания образов.** Функции : Усовершенствованный алгоритм обнаружения паттерн
FREE

Индикатор "Ultimate Non Repaint Smart" - интеллектуальная система торговли без перерисовки.
Обзор продукта:
Индикатор "Ultimate Non Repaint Smart" - мощный инструмент для трейдеров на платформе MT4, который помогает оптимизировать анализ рынка и принятие торговых решений. Благодаря комбинации различных показателей и умных систем, этот индикатор не только помогает определить потенциальные точки покупки и продажи, но также предоставляет надежные торговые сигналы.
Основные характеристики:
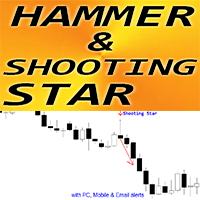
Forex Indicator " Hammer and Shooting Star pattern" for MT4 Indicator " Hammer and Shooting Star pattern " is very powerful indicator for Price Action trading : No repaint, No delays; Indicator detects bullish Hammer and bearish Shooting Star patterns on chart: Bullish Hammer - Blue arrow signal on chart (see pictures) Bearish Shooting Star - Red arrow signal on chart (see pictures) P C, Mobile & Email alerts are included Indicator " Hammer and Shooting Star pattern" is excel
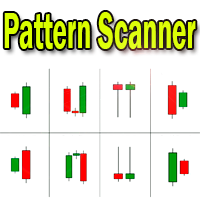
Индикатор свечных паттернов - отображение на графике найденных свечных паттернов. MT5-version: https://www.mql5.com/en/market/product/103134 Медвежьи паттерны: Обозначения медвежьих паттернов Название паттерна SS
Падающая звезда ( Shooting Star) STR(E) Вечерняя звезда ( Evening Star) DJ(E) Звезда доджи вечерняя ( Evening Doji Star) DC Завеса из темных облаков (Dark Cloud) BEP Медвежье поглощение (Bearish Engulfing) Бычьи паттерны: Обозначение бычьих паттернов Название паттерна HMR

US30 Revolt a Technical indicator that is 100% non-repaint and appears on the current candlestick works on all timeframes (recommended M15,M30,H1) The indicator is made for US30 but it can be used on other pairs as well When a blue arrow appears look for buying opportunities When a orange arrow appears look for selling opportunities Please watch the YouTube video on how to properly set up and use the indicator
FREE

The ICT Silver Bullet indicator is inspired from the lectures of "The Inner Circle Trader" (ICT) and highlights the Silver Bullet (SB) window which is a specific 1-hour interval where a Fair Value Gap (FVG) pattern can be formed. A detail document about ICT Silver Bullet here . There are 3 different Silver Bullet windows (New York local time):
The London Open Silver Bullet (3 AM — 4 AM ~ 03:00 — 04:00)
The AM Session Silver Bullet (10 AM — 11 AM ~ 10:00 — 11:00)
The PM Session Silver Bullet

Графики Ренко, Heiken Ashi, Тиковый бар, Ренж бар. Простое переключение, простая настройка, все в одном окне. Подключи индикатор Custom Chart и просматривай графики Ренко, Heiken Ashi, Тиковый бар, Ренж бар в реальном времени в реальном графике. Расположи окно оффлайн графика так что бы панель управления была видна. Переключай режим графика нажатием одной кнопки. Подключи к выходному графику любой индикатор, советник без каких либо ограничений. Нет, это не работает в те

Hello Dear Trader, Today Im Telling You About The "Golden Scalp System V1 " Metatrader4 Golden Scalp System
Scalper with EMA This is a Scalper strategy based on ( Exponential moving average) EMA . Time frame: H1 Pair: EUR/USD, GBP/USD,AUD/USD XAU/USD
Platform Mt4 Indicators for Scalper with Ema: 300 EMA (Exponential Moving Average) ; 500 EMA (Expontial Moving Average); Stochastic (5,3,3) Long Entry
1) 300 EMA > 500 EMA .
2) Find significant levels of support.
3) Wait for
Данный индикатор отображает сигналы о пересечении стандартным MACD нулевого значения, а также о пересечении сигнальной линии. Индикатор не перерисовывается. Сигналы показываются на полностью сформированных свечах. Индикатор может отправлять уведомления о своих сигналах на терминал и электронную почту. Настраиваемые параметры: Fast_EMA_Period - период быстрой скользящей средней; Slow_EMA_Period - период медленной скользящей средней; Signal_Period - период сигнальной линии; MACD_Price - цена по ко
FREE
Данный индикатор является одним из вариантов технического индикатора MACD. Индикатор представляет собой разность двух скользящих средних с разным периодом сглаживания. Каждая скользящая средняя дополнительно сглаживается адаптивным цифровым фильтром. В упрощенном понимании адаптивный цифровой фильтр - скользящая средняя с эффективным сглаживанием. Использование цифрового фильтра позволяет сгладить резкие колебания с минимальным запаздыванием сигнала.
Использование индикатора: Следует принимать
FREE
Данный индикатор отображает на графике цены сигналы высокоэффективного осциллятора - Laguerre Osc 3 AM . Индикатор отображает разницу текущей цены с ценой за предыдущий период. Подобный метод анализа рынка используется в классическом индикаторе Momentum. В то же время, представленный индикатор использует первичное сглаживание данных фильтром Laguerre, что позволяет сохранить чувствительность индикатора и минимизировать "шум". Сигналами индикатора являются: Пересечение гистограммой 0. Смена напр
FREE

Индикатор рассчитывает волатильность относительно свечи заданной в настройках, в заданном диапазоне. period -диапазон для расчета максимум минимум. point - номер свечи от которой будет рассчёт (нуль текущая цена). По всем вопросам можно обратиться на сайте через форму обратной связи или в комментариях в ютюб. Также на сайте есть другие работы ссылка в индикаторе на вкладке общее .
FREE

PowerXXX measures the power of the current candlestick and displays it in numerical format and colors. The indicator can cover multiple timeframes and can be placed on the main chart or on the charts of the underlying indicators. The number of timeframes is selectable, as well as the color levels according to the power expressed. In the latest version, the power can be expressed as a function of the opening of the candle itself or as a function of the opening of the total candles before. There

This is an advanced index algorithm, it provides a very accurate top-bottom signal, it will not frequently appear the wrong signal during the trend, this index does not have any redrawing, drift, or lag behavior. When this signal appears on the chart, it means that the market is about to reverse, or that a period of trend market is over, and then the market will be transformed into a consolidation market, and this indicator does not need to adjust the parameters. It applies to any currency pai

This indicator is very advanced. I dare say that there is no second indicator in the world that describes false breakthroughs so accurately. When the market hits a certain level three times in a row, the market will first break through this level and then return to the inside of the horizontal line. At this time, our indicator will send a signal to alarm that this is a standard fake breakthrough, the index has not been redrawn, the signal has not been delayed, and everything is true and reliable
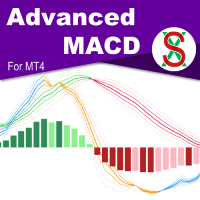
MACD ( M oving A verage C onvergence/ D ivergence) is a widely used indicator in technical analysis. What makes the MACD such a valuable tool for technical analysis is that it effectively combines two indicators into one. It can help to identify trends and measure momentum simultaneously. SX Advanced MACD for MT5 is available here . SX Advanced MACD indicator takes this concept further by plotting two distinct MACD indicators on a single chart, facilitating clear visual correlation between each

The Visual Result Calculator Indicator is a powerful tool designed to enhance your trading experience on the MetaTrader platform. This intuitive and user-friendly indicator allows you to visualize potential profits or losses on a trading chart, helping you make better-informed decisions and manage your trades with precision. The Indicator displays a dynamic line on the trading chart, representing the potential profit or loss of a trade based on the start and end of the line. Simply click and
FREE

TrendFinder VolumeI are Colored candlesticks showing the trend based on Volume and Slope of Trend
This indicator will give you the color change on the next bar on the confirmation candle and will never repaint Lime Green = Possible Buy (Volume up), Teal Green = Bullish Weak (Volume Decreasing), Red = Possible Sell (Volume up) , Orange = Bearish Weak (Volume Decreasing)
TrendFinder Volume is optimize to trade on any market and to be used trending and None trending markets. For best results us
FREE

A simple but useful indicator for controlling volatility in intraday trading.
The indicator plots the average volatility (ATR) levels for the specified number of days on the current chart.
On the current trading day, the levels are dynamic and move depending on the minimum and maximum prices of the current day in "real time" mode.
In the input parameters we specify:
- the number of days to calculate and draw the ATR levels
- color of the ATP level lines
- the thickness of the ATR le
FREE
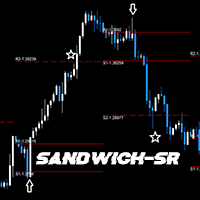
GENERAL DESCRIPTION
Simple SR Projection based on selected instrument's historical data. Best used in conjunction with current market sentiment, and fundamental analysis. Currently limited to selected pairs due to of historical data to project accurate levels.
Generally, for support and resistance, 2 levels are drawn, respectively. The inner levels (R1,S1) project the highs and lows during the opening stages of selected time frame. The outer levels, represent the targets to reach during the c
FREE
TrendFinder RSI are Colored candlesticks showing the trend based on The Relative Strength Index (RSI) This indicator will give you the color change on the next bar on the confirmation candle and will never repaint TrendFinder RSI is optimize to trade on any market and to be used trending and None trending markets. For best results use this indicator as an extra tools after you have completed your regular analysis and use it for alerts based on such analysis.
FREE

Strength of 8 popular currencies (EUR, GBP, USD, CAD, AUD, NZD, CHF, JPY) is calculated from 28 pairs of Forex market following a Moving Average with custom period and method. You can use it by adding 2 indicators to the chart of Forex pair based on the pair currencies and use it as a confirmation on your strategies.
Currencies: EUR, GBP, USD, CAD, AUD, NZD, CHF, JPY
Inputs: Currency: 1 of the 8 currencies MA Period: Period of Moving Average MA Method: Method of Moving Average (SMA, EMA, S
MetaTrader Маркет - лучшее место для продажи торговых роботов и технических индикаторов.
Вам необходимо только написать востребованную программу для платформы MetaTrader, красиво оформить и добавить хорошее описание. Мы поможем вам опубликовать продукт в сервисе Маркет, где его могут купить миллионы пользователей MetaTrader. Так что занимайтесь только непосредственно своим делом - пишите программы для автотрейдинга.
Вы упускаете торговые возможности:
- Бесплатные приложения для трейдинга
- 8 000+ сигналов для копирования
- Экономические новости для анализа финансовых рынков
Регистрация
Вход
Если у вас нет учетной записи, зарегистрируйтесь
Для авторизации и пользования сайтом MQL5.com необходимо разрешить использование файлов Сookie.
Пожалуйста, включите в вашем браузере данную настройку, иначе вы не сможете авторизоваться.