Смотри обучающее видео по маркету на YouTube
Как купить торгового робота или индикатор
Запусти робота на
виртуальном хостинге
виртуальном хостинге
Протестируй индикатор/робота перед покупкой
Хочешь зарабатывать в Маркете?
Как подать продукт, чтобы его покупали
Новые технические индикаторы для MetaTrader 4 - 54
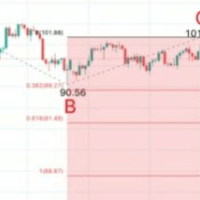
A Chart Analytics Program and helps in asset analysis using the Fibonacci Complex.
The primary Fibonacci numbers used in trading are 61.8% and 38.2%. 8% is derived from dividing any number in the Fibonacci sequence by its previous one. F n / F n-1 2% is derived by squaring 61.8 and alternatively by dividing any number in the sequence by the number two places to its right. F n /F n+2 The second tier of Fibonacci numbers used in trading is 23.6%, 76.4%, and 78.6%. 6% is derived from dividing an

This indicator takes input from the ADX from multiple time frames (M/W/D/H4/H1), and presents the output on the main chart. Great for scalping. Features alert for current chart's ADX. TrendLine period setting.
How to use: Simply attach to any chart. User can set the period for ADX(Monthly, Weekly, Daily, H4, H1,Current chart) Zoom chart out completely. Hover over the lines to see the time frame applicable. Buy when Multi ADX below price; also blue dots and white line below price. Sell when Mult

Indicator automatically draw bullish and bearish engulfing without any rules. Bearish and Bullish engulf is well known area for supply and demand area marking. This indicator can be used in any strategy that required supply demand zone. Show Last Engulf : Enable this option to show unfresh engulfing Candle to calculate : set 0 will load all history bar and can use up more memory Bearish Engulfing Colour : Pick any colour that suit Bearish Engulfing Colour : Pick any colour that suit
-Use this
FREE

Специальное предложение! https://www.mql5.com/ru/users/bossik2810
Trend Arrow Super Индикатор не перерисовывается и не изменяет свои данные. Профессиональная,но при этом очень простая в применение Форекс система.Индикатор даёт точные BUY\SELL сигналы. Trend Arrow Super очень прост в применение,вам нужно просто прикрепить его на график и следовать простым рекомендация по торговле.
Сигнал на покупку: Стрелка + гистограмма зеленого цвета, входим сразу по рынку на покупку. Сигнал на продажу: Стре

Индикатор Sonar Mechanic. Свяжитесь со мной после покупки для получения индикатора баланса сил SonarHistogram бесплатно! Индикатор Sonar Mechanic - действительно рабочий индикатор, потому что работает одновременно по трем авторским алгоритмам, которые правильно определяют трендовые и контртрендовые сигналы для входа в рынок. Индикатор работает на всех активах и таймфреймах. Руководство по индикатору здесь: https://www.mql5.com/en/blogs/post/750128
На золоте и на валютных парах хорошие сиг
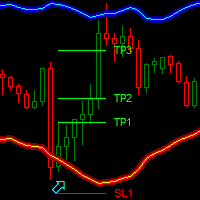
Dark Bands is an Indicator for intraday trading. This Indicator is based on Counter Trend strategy but use also Volatility. We can enter in good price with this Indicator, in order to follow the inversions on the current instrument.
Key benefits
Easily visible take profit/stop loss lines Reliable bands lines with futuristic colors, and Intuitive directional arrows Useful statistics , which indicate the win rate of the signals Plus Package available, leave a feedback to receive
FREE
Индикатор, который будет помогать вам торговать. Этот индикатор будет показывать развороты тренда, а так же откаты. Когда будет появляться стрелка, это будет означать, что сейчас тренд или сменит свое направление, или будет откат от основного движения. В любом из случаев, если трейдер будет знать о нем заранее, можно открыть эффективно сделки. Этот индикатор не перерисовывает свои значения. Стрелка появляется в начале свечи и остается там.
Как торговать с этим индикатором: Когда появляется кра
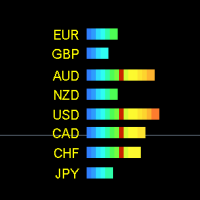
"Forex strength meter full" - новая усовершенствованная версия популярного индикатора. В этой версии мы изменили входные фильтры и сделали сигналы индикатора более быстрыми и более точными. Теперь этот индикатор можно использовать в торговле еще более эффективнее чем его базовая бесплатная версия. Новая версия индикатора построена на алгоритмах самообучения и способна самоанализировать свои сигналы, чтобы исключать ложные потоки данных информации. Почему нужно использовать этот индикатор? Он хор

Angle of Moving Averages This indicator is very simple yet powerful concept which constantly calculate the slope of the current bar moving average with respect to the N bar before moving average value. This no only give a good entry and exit signal but also it shows traders the strength of the signal. It shows positive green histogram when market is moving toward upward direction and red histograms for downtrend. When large histograms found means market has very strong trend. Inputs Available

MACD Scanner provides the multi symbols and multi-timeframes of MACD signals. It is useful for trader to find the trading idea quickly and easily. User-friendly, visually clean, colorful, and readable. Dynamic dashboard display that can be adjusted thru the external input settings. Total Timeframes and Total symbols as well as the desired total rows/panel, so it can maximize the efficiency of using the chart space. The Highlight Stars on the certain matrix boxes line based on the selected Scan M

SupportResistancePeaks Indicator indicator - is the combination of dynamic support/resitance and price action pattern. As a rule support/resistance indicators uses already calculated, history levels. The most disadvantage of this method - new(incomming) levels always are not the same as were on history, in other words accuracy is not so high as expected. My indicator is looking for dynamic/live levels that are forming right now after trend lost it's power and choppy market starts. As a rule exac

Check my p a id tools they work perfect! "Period Cross RSI" Is a New indicator idea that shows crosses of two RSI lines with different periods which creates ascending and descending zones for confirmation of long and short trading. This indicator is brend new and will be upgraded further, for now I recommend to use it as a confirmation, filter indicator for determination of long/short trading zones, not as a signaler indicator for now. Further upgrades can make it as a signaler indicator as w
FREE

Awesome Oscillator Билла Уильямса с возможностью тонкой настройки и замены алгоритмов усреднения индикатора, что значительно расширяет возможности применения этого осциллятора в алгоритмическом трейдинге и приближает его по своим свойствам к такому индикатору, как MACD. Для уменьшения ценовых шумов итоговый индикатор обработан дополнительным усреднением Smooth. Индикатор имеет возможность подавать алерты, отправлять почтовые сообщения и push-сигналы при смене направления движения осциллятора

About Scanner:
It will show you the Higher/Lower Highs and Lows of zigzag price. Use it to keep track of best ongoing trends and price ranges.
Detailed blog post:
https://www.mql5.com/en/blogs/post/750232
Symbols:
HH: Higher Highs HL: Higher Lows When price makes higher and higher Highs or higher Lows:
It will count Zigzag in reverse and find total number of last "Higher Highs" and "Higher Lows" or "Lower Lows" and "Lower Highs". LL: Lower Lows LH: Lower Highs
How to Use:
Suppose price is

Accelerator Oscillator Билла Уильямса с возможностью тонкой настройки и замены алгоритмов усреднения индикатора, что значительно расширяет возможности применения этого осциллятора в алгоритмическом трейдинге и приближает его по своим свойствам к такому индикатору, как MACD. Для уменьшения ценовых шумов итоговый индикатор обработан дополнительным усреднением Smooth. Индикатор имеет возможность подавать алерты, отправлять почтовые сообщения и push-сигналы при смене направления движения осцилля

Trend driver bars is the manual trading system, which defines current trend continue or it's pull-back/reverse. "Driver" bars - are price action patterns that has powerfull affect on market, defining it's near future direction. Generally, driver bars represents trend "skeleton" and often anticipates new market impulse. System plots arrows when market shows 3 pattenrs in a row(most powerfull combo-pattern), and makes fast scalping of incomming movement. Loss positions closes by common profit. Lot

Trend deviation scalper - is the manual system to scalp choppy market places. Indicator defines bull/bear trend and it's force. Inside exact trend system also defines "weak" places, when trend is ready to reverse. So as a rule, system plots a sell arrow when bull trend becomes weak and possibly reverses to bear trend. For buy arrow is opposite : arrow is plotted on bear weak trend. Such arrangement allows you to get a favorable price and stand up market noise. Loss arrows are closing by common p

Wave Impulse OmegaScalper - is the manual system for scalping. In many cases Indicator "eats" almost all possible trend wave. System defines up price wave and down price wave. Inside the exact wave - system defines true trend movement and choppy market. Indicator plots signals while market is trending, powerfull and has quiet good volatility. This is complete system with enter and exit points. Main Indicator's Features Signals are not repaint,non-late or disappear(exept cases when system recalcu
I decided to list it for free. Combined Informer of DeMarker with RSI MTF. Each parameter can be change values in menu. it is good for scalping or for weekly trading and looks as universal fx-toy. Now I use it for BTC, ETH, BNB. In menu you can turn on daily percentage gain info, weekly and monthly gains also included as informers. Short ATR helps to determine when price was slow/stopped and entry for pulse pump/dump. The filter of numbers of RSI can be tuned for overbought/oversold values w
FREE
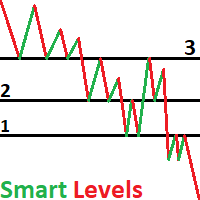
NOTE: T he indicator in demo version will not work as it requires the specific preset and if in future you don't see recent numbers drawn on your chart then please contact us for recent calculated preset file
This is smart money levels , just see the pictures how the pair reacts to our calculated numbers
The indicator can be used with any timeframe but to match the institutional traders we recommend H4 or D1 charts
Allow DLL imports must be turned on, as the indicator requires to be connect

FREE TopClock Indicator: This indicator is an Analog Clock That Shows: Local Time Of Pc or Time Of Broker Server or sessions(Sydney -Tokyo London -NewYork)Time or custom Time( with GMT -Base) this can shows Candle Time Remainer with Spread live. You can run this indicator several times for different times and move it to different places on the chart. If you would like, this indicator can be customized for brokers and their IB based on customer needs. For more information contact us if you
FREE

The Market Profile Indicator for MT4 displays the price levels and zones where increased trading activity happens. These zones with substantial forex trading activity provide the forex traders with the best entry levels, support, and resistance levels. Moreover, price levels indicate the best reversal zones. As a result, forex traders can identify BULLISH and BEARISH market trends and BUY and SELL entry points as well as the best reversal points. The indicator works well in all intraday timefram
Angle of Price It is a trend following indicator. The idea behind this indicator is very simple. it calculates the angle of certain price type with its N candle back price type. When the price is moving toward upward direction positive angle histograms will be created and vice versa for downward direction. There are couple of price type supported in this indicator. Which is as follows Close Open High Low Median Typical Weighted When combined with other indicators it could be used as a very power
FREE

Imbalance / FVG MTF Mark Imbalance on chart of Selected Multi Time frames. Trend is Manually set to filter signals in the chosen direction by a button on the chart. .
Futures Auto Mark Imbalance / FVG on chart on selected time frames
Select time frames by buttons on chart
Popup Alert, Push Notification or email when New Imbalance Form
Popup Alert, Push Notification or email when Imbalance is Taken out
Select Alert Mode to be a single or multiple Imbalance ( OR / AND option ) when Imbalance is

What is 2 Line MACD Indicator MT4? The 2 Line MACD Indicator, in short, is a technical indicator that assists in identifying the trend as well as its strength, and the possibility of the trend reversal. It is a widespread forex technical indicator that is made of three essential components, i.e. 1. MACD histogram
2. MACD: 12-period exponential moving average (12 EMA) – 26 period EMA
3. MACD Signal Line: the 9-period EMA of the MACD. This Indicator is one that ensures a trader stays profitable o

3C JRSX H Indicator represents a trend-following forex trading oscillator that signals for both market trends and its possible swing areas. Besides, it supports all sorts of timeframe charts available within the forex MT4 platform. Therefore, it can serve all kinds of financial traders providing supports for both scalping and day trading activities. This Indicator can be applied to all kinds of forex currency pairs available in the market. Moreover, its simplicity of use and easy chart demons

Signal lines are used in technical indicators, especially oscillators , to generate buy and sell signals or suggest a change in a trend. They are called signal lines because when another indicator or line crosses them it is a signal to trade or that something potentially important is happening with the price of an asset. It could be that the price was trending, pulled back , and is now starting to trend or again, or it could signal that a new uptrend or downtrend is starting.
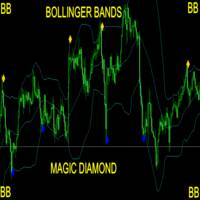
Take Your Trading Experience To the Next Level ! and get the Magic Bollinger Bands Diamond Indicator MagicBB Diamond Indicator is MT4 Indicator which can suggest signals for you while on MT4. The indicator is created with Non Lag Bollinger Bands strategy for the best entries. This is a system to target 10 to 20 pips per trade. The indicator will give alerts on the pair where signal was originated including timeframe. If signal sent, you then enter your trade and set the recommended pips target

В основу алгоритма этого осциллятора положен анализ веера сигнальных линий технического индикатора RSI . Алгоритм вычисления сигнальных линий выглядит следующим образом. В качестве исходных данных имеем входные параметры индикатора: StartLength - минимальное стартовое значение первой сигнальной линии; Step - шаг изменения периода; StepsTotal - количество изменений периода. Любое значение периода из множества сигнальных линий вычисляется по формуле арифметической прогрессии: SignalPeriod(Numbe
This indicator takes input from the RSI from multiple time frames (M/W/D/H4/H1), and presents the output on the main chart. Great for scalping. Features alerts for the current chart's TrendLine above or below price. TrendLine period setting. Multi RSI period settings. How to use: Simply attach to M5 (Scalping - zoom chart out completely on M5) or use on higher time frames' charts. Zoom chart out completely to get a better view of the chart. Hover over the lines to see the time frame applicable.

В основу алгоритма этого трендового индикатора положен анализ веера сигнальных линий универсального мувинга . Алгоритм вычисления сигнальных линий выглядит следующим образом. В качестве исходных данных имеем входные параметры индикатора: StartLength - минимальное стартовое значение первой сигнальной линии; Step - шаг изменения периода; StepsTotal - количество изменений периода. Любое значение периода из множества сигнальных линий вычисляется по формуле арифметической прогрессии: SignalPeriod(Nu

Классический Parabolic SAR с цветовой визуальной индикацией действующего тренда и моментов его изменения на противоположный для ручного трейдинга. При необходимости символы сигналов покупки и продажи можно заменить, используя входные параметры индикатора Buy Symbol; Sell Symbol. Номера символов можно найти здесь .
Индикатор имеет возможность подавать алерты, отправлять почтовые сообщения и push-сигналы при смене направления тренда.
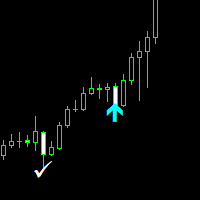
Nasdaq Savages Non-repaint indicator works on all timeframes 1 minute to 15 minutes timeframe for scalpers. 30 Minutes to Monthly timeframe for swing traders The Nasdaq Savages indicator comes with a top right info tab which tells you about the current buy or sell signal, Profit in pips, Stop loss and Target Red arrow is your sell entry signal the white right tick is your exit signal and take profit hit signal Light blue arrow is your buy entry signal the white right tick is your exit signal an

Wink IND is an indicator that tell you: -when MACD is saying buy or sell -when RSI is saying buy or sell -work on multi timeframes MT5 Version
by Wink IND: you don't need to have Knowledge about MACD or RSI don't need to check and compare MACD and RSI respectly don't need to check all of timeframes and compare the resaults don't lose time, save more time for your decisions in trading
Wink IND: multi timeframe indicator multi currency indicator show the positions by graphic shapes, arrows and
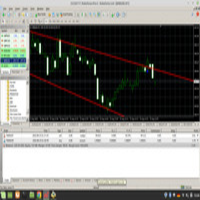
the trend line Alert indicator will inform you when the candlesticks crosses or touches the desired line. the indicator is having pop up and push notifications, see the pictures down how to setup, e.x, 1. pic one is alert 2. pic two is right click of the chart 3. pic three is how to change names of the trend so the indicator will detect 4. pic four is how you changed in the correct way any assistance please drop me via mql5 chat
Market Reversal Catcher Dashboard ищет точки разворота рынка или серьезные откаты. Для этого он анализирует предыдущие ценовые движения и с помощью гибкого алгоритма оценки вероятности разворота, а также дает рекомендации по точкам входа и выставляет рекомендуемые цели прибыли для открытых по сигналу позиций. Панель инструментов предназначена для самостоятельного размещения на графике и работы в фоновом режиме, чтобы отправлять вам сигналы о выбранных вами парах и таймфреймах. Панель инструме
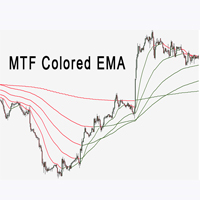
Индикатор Multi Time Frame EMA очень помогает в определении направления тренда. Это может быть отличным дополнением к вашей существующей стратегии или новой основой. Мы, люди, можем принимать лучшие решения, когда лучше видим визуально. Поэтому мы разработали его, чтобы показать разные цвета для восходящих и нисходящих трендов. Каждый может настроить его так, как ему удобно. Мы можем установить индикатор Ema для всех таймфреймов на графике.
Indikator Multi Time Frame EMA ochenʹ pomogayet v opr
FREE

УР Моментер
UR Momenter отлично рассчитывает моментум цены в зависимости от исчерпания ценового движения, представленного в виде осциллятора. Следовательно, это дает нам действительно ранние сигналы потенциальных разворотов или откатов. Эта формула была открыта в 2018 году после того, как лопнул рыночный пузырь.
Преимущества использования UR Momenter:
Нет параметров У вас есть 2 линии, которые описывают движение цены - Белая линия, которая представляет собой моментум цены в соотношении с о

Одна из числовых последовательностей носит название - "Последовательность лесного пожара". Она была признана одной из самых красивых новых последовательностей. Её главная особенность заключается в том, что эта последовательность избегает линейных трендов, даже самых кратковременных. Именно это свойство легло в основу этого индикатора. При анализе финансового временного ряда этот индикатор старается отбросить все возможные варианты тренда. И только если это ему не удается, то он признает наличие
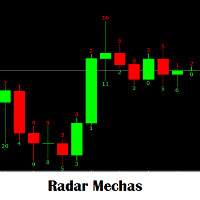
Индикатор, который служит для просмотра размера фитиля, оставляющего свечи, в соответствии с размером, который генерирует предупреждение для ручного ввода. Воспользуйтесь этим по максимуму, чтобы стратегия создавала вейсы размером с фитиль предыдущей свечи или той же текущей свечи. войти, чтобы купить и продать. Это индикатор, который необходим для любого анализа, который берется для нового входа. Это будет ваш любимый инструмент. Indikator, kotoryy sluzhit dlya prosmotra razmera fitilya, ostav
FREE

UR FrontEndBackEnd
UR FrontEndBackEnd — моя любимая формула для нахождения наиболее точных уровней поддержки и сопротивления. Я также разделил их на разные категории (пунктирные линии, сплошные линии и области), чтобы отметить, насколько они сильны. Все хранится в буферах, поэтому к ним легко получить доступ и реализовать в других инструментах.
Дополнение: Инструмент может нуждаться в адаптации к активу, к которому он применяется — активы различаются количеством цифр в цене, которая влияет
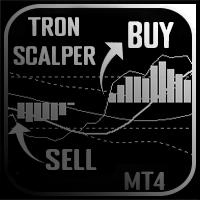
Tron Scalper - индикатор предназначенный для скальпинга . Индикатор дающий сигналы на основе показаний целого комплекса стандартных и авторских инструментов.
Xарактеристики Tron Scalper : Аналитические функции Может использоваться на любых валютных парах и тайм-фреймах; Индикатор не перерисовывается; Графические возможности Занимает минимальное кол-во места на графике; Гибкие настойки; Легкий в усвоении; Tron Scalper состоит из
Голубая линия – индикатор RSI; Оранжевая линия – консолидир

Order Squeeze Easy to use indicator to predict the market movement with calculated HIGH important levels. These levels are calculated in the lowest time frame with candle details. Ind calculates the quantity of market tick, volume per tick, and orders per candle. So with this statistical data, you catch the important price levels that supply and demand in the market are attractive for sellers and buyers. Institutes and banks trade with huge order lots and they need a lot of sellers for their BU
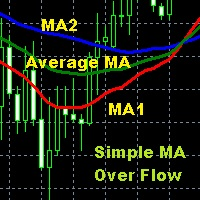
Moving Average is one of the indicators that is widely used in technical analysis which can help to smooth price movements by eliminating some price fluctuations that are less relevant based on past price calculations, so that an average line of price movements is formed within a certain time period. Simple Moving Average Over Flow is an indicator writen by MQL$ language that is given a special additional moving average line based on certain calculations so as to make this moving average better
FREE
Volume Oscilator is a popular indicator available in trading view which is very popular among traders Definition The Volume Oscillator is an indicator made up of two Moving Averages (MA) surrounding volume, one being fast and the other slow. The slow volume MA value is then subtracted from the value of the fastlow Moving Average. The Volume Oscillator measures volume by analyzing the relationship between the two Moving Averages mentioned. When combined with other indicators it provides a very st
FREE
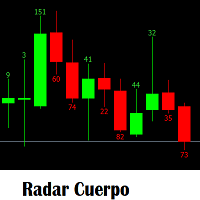
Indicador que sirve mirar el tamaño de velas segun el tamaño te genere alerta para hacer entradas manuales. Aprovechenlo al maximo que una plantea estrategia a vaces del tamñao de la vela anterior o de la misma vela actual. para entran a comprar y vender. Es un indicador que es necesario para cualquier analisis que se tome para una entrada nueva. Sera su herramienta preferida.
FREE

В основе индикатора EasyBands лежит тот же принцип, что и при построении Bollinger Band. Однако, данная модификация индикатора использует вместо стандартного отклонения средний торговый диапазон (Average True Range). Соответственно, с данным индикатором абсолютно аналогично можно использовать все стратегии, которые применяются с Bollinger Band. В данной версии индикатора используется двенадцать уровней и средняя линия (белый цвет). Индикация тренда выполнена в виде окраски свечей в зависимости
Golden Scalping & Day Trading Signal Indicator You Can Enable Or Disable Scalping Signal Option Once Enable For Scalping More Order Signals Option Or Disable For Scalping Option Intraday Signal Option Pairs : XAUUSD, XAGUSD - EURUSD, GBPUSD,USDJPY, AUDUSD, USDCAD, BTCUSD , USDCHF, GBPJPY Time Frame : 15 Mins, 30 Mins , 1 Hour 5 Purchases left & The Price Increases
Gold Scalping Pro Signal Indicator Pairs : XAUUSD, XAGUSD, Crude OIL , BTCUSD, ETHUSD, EURUSD, GBPUSD, USDJPY, AUDUSD, USDCHF, GBPJPY Setting : Once Market Are Up And Down Side , The Indicator Are Provide Buy And Sell Order Push Notification Time Frame - 5 Mins, 15 Mins, 1 Hour, 4 Hour Additional : You Have Also Trade Manual , Once Trend Power Is Up , Enter Buy Or Trend Power is Down, Enter Sell
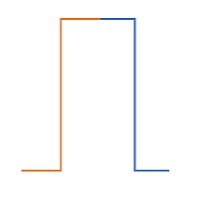
A Good , Easy , Readable and handy indicator for experienced and professional traders. It gives bounded signals between zero and one. Easy for investors to comprehend. It gives near and longer trading outlook to investors and helps them to find good opportunities. Indicator gives zero signal on price downturns and signal value equals to one on price upturns. Once again a new type of indicator and rangebound between zero and one .

A very Simple Indicator for experienced and professional traders. It indicates direction of trade and provides signals of best deals. Signal is referred here a point on chart where indicator line turns its direction or converges. This indicator finds underlaying trading asset trade direction and indicates best scenarios of trade as described in screenshots. Where it has run for a period of time and converges to best deal scenarios.
Have a Look!
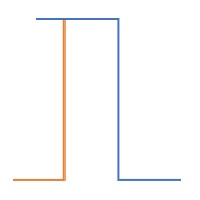
A value indicator. It is helping tool to indicate the direction of value gain. A best helping tool to trade value. This indicator is equipped with a colored line and a digital tool to indicate value numerically .
This indicator also helps to indicate value during trends. A study based on this indicator shows value of trade significantly changes during trends best tool to chase the trends.
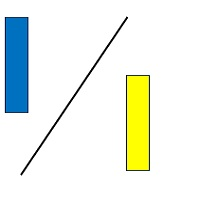
A basic tool for experienced and professional traders to trade percentile of the value. It indicates both values in the form of digits appeared on the left corner of the screen.
Instructions Manual : First choose your desired symbol and then select this tool. Please be remined that this tool is just a helping tool. its upon trader what he chooses. The function of this tool is just to provide a help in trading.
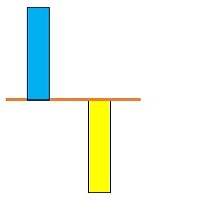
A technical Indicator Providing Price Convergence Signals along with value for experienced and professional traders. Easy to comprehend, Easy to understand.
This is a helping tool provides best signals. This indicator is designed based on the fundamentals of trade. A very good indicator you can customized its color. A best tool to find trade direction.
An adaptive indicator. It constantly adapts to the trade.

Note: The PRICE IS SUBJECT TO INCREASE AT ANY TIME FROM NOW!! DON'T MISS THIS BEST OFFER.
Dear traders once again I am very glad to introduce to you my another trading tool called "Trend Hunter Indicator". This indicator is designed to help traders capture the trend from the beginning or the end of it. It is one of the indicator that if used wisely may help you improve in your trading decisions.
Timeframe
The indicator is for all timeframes
Pairs
The Indicator is for all pairs.
Market
Thi

HEIKEN PLUS is the only indicator you really need to be a successful trader , without in depth knowledge of the forex trading or any tools. Also there is automatically trading MT5 EA available now: https://www.mql5.com/en/market/product/89517? with superb SL/TP management! and sky high profit targets ! MT5 ONLY !
For Metatrader5 version visit: https://www.mql5.com/en/market/product/83761?source=Site
Very suitable tool for new traders or advanced traders too.
HEIKEN+ is a combin

DESCRIPTION Investing indicator help you get signal like Technical Analysis Summary of Investing.com When have signal strong ( Strong buy or Strong sell) at Time Frame M5, M15, H1, The Alert will announce to you HOW TO USE When have signal , you can entry Order and set TP & SL appropriately Recommend : This indicator also Technical Analysis Summary of Investing.com is suitable for medium and long term trading

The Cycle Identifier MT4 indicator is a great choice of custom indicator for both short-term and long-term traders. The Cycle Identifier MT4 generates filtered price action signals to assist traders to identify when the conditions are right to open buy and sell positions. How it works The Cycle Identifier MT4 indicator displays on a separate indicator chart below the main chart where it draws an oscillating gray line. This gray line is characterized by upward and downward spikes that are accompa
This indicator is used to show the PERFECT TREND . All Time Frame charts are available. The trend is determined based on the Cycle, Price and Volatility. This Trend Indicator will give 5 output values: Cycle Period: 48 is default
Graph Place: 0 Means Main Windows - 1 means Sub Windows (you can use in your indicator)
NumBars: you can decide how many older Bar use
Short Trend Color : You can decide which color to use for Short Trend
Long Trend Color : You can decide which color to use for Long T
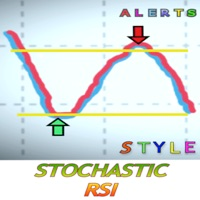
Что такое стохастический RSI?
Стохастический RSI (StochRSI) - это индикатор, используемый в техническом анализе, который колеблется между нулем и единицей (или нулем и 100 на некоторых графических платформах) и создается путем применения формулы осциллятора Стохастик к набору значений индекса относительной силы (RSI), а не к стандартным ценовым данным. Эта версия включает предупреждения, чтобы не упустить действительно хорошие возможности. Вы устанавливаете параметр, когда вы хотите получить с
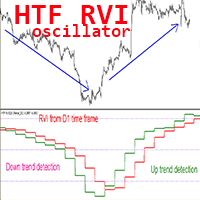
Индикатор Crypto_Forex HTF RVI Oscillator для MT4, без перерисовки.
- Обновите свои методы торговли с помощью профессионального HTF RVI Oscillator для MT4. HTF означает - более высокий таймфрейм. - RVI - один из лучших осцилляторов для обнаружения смены тренда и входа из зон перепроданности/перекупленности. - Этот индикатор отлично подходит для торговых систем с несколькими таймфреймами с входами по ценовому действию из зон перепроданности/купленности. - Индикатор HTF RVI позволяет прикрепить
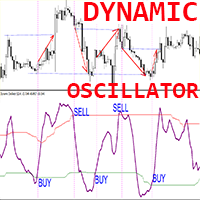
Dynamic Oscillator — это продвинутый пользовательский индикатор Crypto_Forex — эффективный торговый инструмент для MT4!
- Новое поколение осцилляторов — смотрите изображения, чтобы узнать, как им пользоваться. - Dynamic Oscillator имеет адаптивные зоны перепроданности/перекупленности. - Oscillator — это вспомогательный инструмент для поиска точных точек входа из зон перепроданности/перекупленности. - Значения перепроданности: ниже зеленой линии; Значения перекупленности: выше красной линии. -

Shift Trend - это трендовый стрелочный индикатор форекс для определения потенциальных точек входа. Определение рыночного тренда является важной задачей трейдеров. Индикатор Shift Trend реализует усовершенствованный алгоритм для визуализации рыночного тренда. Показывает точки открытия сделок на продажу или покупку, а также указывает направление тренда на: краткосрочном периоде и долгосрочном периодах. Подходит для торговли на малых таймфреймах, потому как он игнорирует внезапные скачки цен или ко

Support And Resistance Screener is in one level indicator for MetaTrader that provide multiple tools inside one indicator. The available tools are : 1. Market Structure Screener. 2. Bullish Pullback Zone. 3. Bearish Pullback Zone. 4. Daily Pivots Points 5. weekly Pivots Points 6. monthly Pivots Points 7. Strong Support and Resistance based on Harmonic Pattern and volume. 8. Bank Level Zones.
Key Features All in one level indicator.
All types of alerts ( Pop-up alert, puss notification alerts.

BSA indicator is a ZigZag based indicator. This indicator is used to find the reversal level of the price. You can use the existing risk ratio and calculation timeframe in the entries by optimizing them according to your usage preference. In lower time frames, the indicator can repaint. For healthier results, you can detect the least repainting by observing for a while according to the graphic you will apply.

Простой инструмент Dark Holder Стрелочный индикатор для Форекса и бинарных опционов Уже настроен для лучших сигналов Мультивалютный и мультитаймфремовый Работает на всех валютных парах а так же сырье и т.д. Работает на авторской стратегии и совмещает 3 индикатора которые хорошо показывают результат Не рисует и не перерисовывает Сигнал появляется четко на открытие свечи Синий вверх Красный вниз Так же в него встроен Алерт для вашего удобства Тестируйте и смотрите видео по его работе

Мой индикатор - отличный помощник на рынке форекс. Он показывает возможные развороты рынка с абсолютной точностью. Мой индикатор не перерисовывается и не меняет значения при переключении таймфреймов. Он отлично работает на всех таймфреймах и может стать ключевым индикатором в вашей стратегии. Хочу отметить, что гибкие настройки индикатора позволяют адаптировать индикатор под вашу стратегию и могут внести большой вклад в вашу прибыльную стратегию, хотя в этом индикаторе уже все заложено. Мой инди
Cheap Rate limited COPIES HURRY UP! 5 LEFT COPIES Very precise patterns to detect High Accurate Order Blocks: It Draw zone after market Structure Breakout with a high Accuracy, institutional orders with the potential to change the price’s direction and keep moving towards it, have been placed. Features Auto Order Blocks Draw MTF Order Blocks Double Signal One Alert Signal Second Long Wick Rejection Signal Market Structure BOS LINE This Indicator is limited features if you want full Feature
ADX Pro Indicator This Indicator Are Advanced Pro ADX Indicator Multi Time Frame Are Same Window Multi Currency Are Same Windows All Time Frame And All Currency ADX Strenght Are Same Window Monitring You Will Add Manully All Currency Pairs , And Metel , And Also Crypto Currency Pairs : EURUSD , GBPUSD, USDJPY .... Etc , Metel : XAUUSD , XAGUSD ... Etc , Crypto : BTCUSD, ETHUSD... Etc
Hello; The product offers high quality trend tracking. Thanks to the arrows on the graph, you can easily follow the entry and exit signals. It provides ease of use thanks to a single input parameter. You can easily follow the signals thanks to the alarm options. Moreover, trend color lines provide convenience in determining the trend direction. Input parameter setting: Periodic: Indicates the number of bars that need to be calculated.
MetaTrader Маркет - торговые роботы и технические индикаторы для трейдеров, доступные прямо в терминале.
Платежная система MQL5.community разработана для сервисов платформы MetaTrader и автоматически доступна всем зарегистрированным пользователям сайта MQL5.com. Ввод и вывод денежных средств возможен с помощью WebMoney, PayPal и банковских карт.
Вы упускаете торговые возможности:
- Бесплатные приложения для трейдинга
- 8 000+ сигналов для копирования
- Экономические новости для анализа финансовых рынков
Регистрация
Вход
Если у вас нет учетной записи, зарегистрируйтесь
Для авторизации и пользования сайтом MQL5.com необходимо разрешить использование файлов Сookie.
Пожалуйста, включите в вашем браузере данную настройку, иначе вы не сможете авторизоваться.