Смотри обучающее видео по маркету на YouTube
Как купить торгового робота или индикатор
Запусти робота на
виртуальном хостинге
виртуальном хостинге
Протестируй индикатор/робота перед покупкой
Хочешь зарабатывать в Маркете?
Как подать продукт, чтобы его покупали
Новые технические индикаторы для MetaTrader 4 - 75
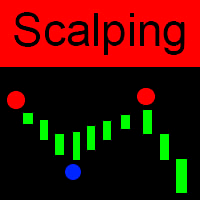
Globex 360 Scalping - уникальный скальпирующий индикатор который показывает точки разворота цены. С помощью данного индикатора Вы будете видить на графике когда разворачивается цена, и в этот момент Вы сможете открывать сделки в направлении сигнала. Это незаменимый помощник как начинающим трейдерам так и профессионалам. Этот индикатор показывает трейдеру важную и ценную информацию для эффективной торговли. Globex 360 Scalping - применяет для анализа рынка технологию сглаженного сканирования. Ин

Описание
Trend Influencer - индикатор который определяет потенциальную динамику влияния трендовых волновых движений на состояние рынка. В основе индикатора лежит значение скользящих средних, скорректированных стандартным среднеквадратическим отклонение. Индикатор отображен в виде основной штрих-пунктирной скользящей средней и сигнальной сплошной скользящей средней. Сигнальная скользящая средняя окрашивается в синий или красный цвет в зависимости от того, какой тип тренда сейчас наблюдается на ры

*Recommended on H1 and higher timeframes *You will see the trading zones and identify the most profitable points to open positions. The indicator marks the supply and demand zones. *With this show you will now make profitable trades that will set the trends. *Shows all support and resistance zones. *Can work in all time zones. *No need to mess with complicated settings, all settings are optimized. Professional version of the indicator with added alarm and notification *All products: The source
FREE

The volume weighted average price (VWAP) is a trading benchmark used by traders that gives the average price a security has traded at throughout the day, based on both volume and price. VWAP is calculated by adding up the dollars traded for every transaction (price multiplied by the number of shares traded) and then dividing by the total shares traded. You can see more of my publications here: https://www.mql5.com/en/users/joaquinmetayer/seller
FREE

Nermal Round Levels is an indicator of round numbers in the form of a grid drawing horizontal lines. You can use it in many ways ... as it could be activating for an expert advisor to enter the market, confirmation of entry for your strategy, entrance area, mark areas of important levels, possible rebounds and others. Place it in your chart and verify as the price respects those round levels.
Inputs GridSpace linecolor lineStyle
FREE

LordChannel is an indicator for META TRADER 4 for all forex pairs and financial market metals.
The indicator is used to make detections of high/low channels, implementing a technical analysis on possible breakouts and making correct order entries.
LordChannel sends signals such as buy and sell in the graphical analysis, it is important to emphasize that the importance of these signals are safe in TIME FRAMES M30, H1, H4.
The indicator was created for using bullish/downtrend channels to compl

The Stochastic RSI indicator (StochRSI) is essentially an indicator of an indicator. It is used in technical analysis to provide a stochastic calculation to the RSI indicator. This means that it is a measure of RSI relative to its own high/low range over a user defined period of time. The Stochastic RSI is an oscillator that calculates a value between 0 and 1 which is then plotted as a line. This indicator is primarily used for identifying overbought and oversold conditions.
FREE

Arlene Sessions Background is an indicator that draws colored vertical background on the chart depending on your session. You can see the version 1 here: https://www.mql5.com/en/market/product/68822 You can see more of my publications here: https://www.mql5.com/en/users/joaquinmetayer/seller If you only want to paint a session on your chart, you must set the color "none" to deactivate it.
FREE

Arlene Sessions Background is an indicator that draws colored rectangles on the chart depending on your session, within the price range that has moved and when the sessions overlap, it will be painted in a color that will be the mixture of the colors of the respective sessions. You can see the version 2 here: https://www.mql5.com/en/market/product/68934
Inputs NumberOfDays AsiaBegin AsiaEnd AsiaColor EurBegin EurEnd EurColor USABegin USAEnd USAColor
If you only want to paint a session on your
FREE

Dark Sprint is an Indicator for intraday trading. This Indicator is based on Trend Following strategy, also adopting the use of the atr to determine the right volatility. We can enter in good price with this Indicator, in order to follow the strong impulse on the current instrument.
Key benefits
Easily visible sprint lines Intuitive directional arrows Automated adjustment for each timeframe and instrument Easy to use even for beginners Never repaints, never backpaints, Not Lag 100% compatibl

Привет! Предлагаю тебе индикатор который не требует больших знаний и умений. Нужно просто им пользоваться как удобным инструментом.
Индикатор создавался как механизм позволяющий взять максимум от тренда и с этой задачей он прекрасно справляется. Для работы с индикатором подойдут все подвижные инструменты EUR/JPY золото фунты. Таймфрейм можно выбрать любой, но лучший результат индикатор показывает на маленьких, от 5 минут до часового.

Идея индикатора очень проста и скорее всего пригодится тем, кто используют линейный график для технического анализа. Что-бы устранить "неровности" (-: линейного графика и был написан этот индикатор. Линия графика соединяет цены закрытия свечей, как и в классическом линейном графике, но игнорирует цены, которые шли в направлении линии и новый экстремум возникает только тогда, когда цена закрытия последней свечи явно ниже или выше предыдущего значения. Это облегчает визуальное восприятие при поиск
FREE

CityScape summarizes prices into an easy to read pattern that oscillates between 0 and 1. Repetition of CityScape pattern may indicate that the price pattern will also be repeated. CityScape pattern can be used as a quick reference to predict what the price may do by looking for a similar CityScape Pattern in the recent past. Cross currency pairs and cross timescale pattern comparisons may also provide insight into what the price will do.
Inputs Local Max period: Controls the width of the CityS
Anchor Line is a fast acting trendline indicator using proprietary algorithm to identify possible reversals. Tunable sensitivity and smoothing period helps to filter out small fluctuations
Buffers Buffer0: Moving Average Buffer (not displayed) Buffer1:Anchor Line Uptrend Buffer (Blue) Buffer2: Anchor Line Downtrend Buffer (Red) Buffer3:Reversal Buffer 1=Uptrend, -1=Downtrend (not displayed) Buffer4: Anchor Line Up and Down trends combined (Gray) *NEW*
Inputs Smooth Period: Period for Moving

This is MetaTrader 4 Professional Auto Pivot Indicator that you can use for any currency pairs. It's very professional strategy and it has higher accuracy if you know how to use it. It is built with mql4 language.
Features: It will change Pivot types according to your Timeframe. It has good accuracy to find out signals Daily Pivot is for H1 Timeframe. It has Daily Pivot with 3 Daily Support Resistance Level. It has Weekly Pivot with 3 Weekly Support Resistance Level. It has Monthly Pivot with 3

MA Cross indicator by 4Umbella
Create for traders both experienced and inexperienced to use it because it is a basic indicator
How to use : 1. MA Fast : Moving Average fast (Period 4 upto 50) 2. MA Middle : Moving Average Middle (Period 10 upto 100) 3. MA Slow : Moving Average Slow (Period 50 upto 200) to control trend markets.
and trader can be set for Apply to price (Close, Open,Low,High,Median,Typical,weightd)
For alert you can set to alert Next bar or instant bars.
The work is very
Mastery CDS is a trend indicator based on the BB Mastery Technical Analysis. This Mastery CDS indicator is specially designed for the practitioner of BB Mastery Technical Analysis. This indicator helps you to setup BB Mastery Indicators and label all the CDS signals. The CDS signals including TRZ, CT, and CC. What is so special with this indicator? This indicator able to label TRZ, CT and CC signal all all time frames. You can one glance all the signals without spending time to identify each of
FREE

Профиль рынка Форекс (сокращенно FMP) Чем это не является:
FMP не является классическим отображением TPO с буквенным кодом, не отображает общий расчет профиля данных диаграммы и не сегментирует диаграмму на периоды и не вычисляет их.
Что оно делает : Что наиболее важно, индикатор FMP будет обрабатывать данные, которые находятся между левым краем спектра, определяемого пользователем, и правым краем спектра, определяемого пользователем. Пользователь может определить спектр, просто потянув мышь
FREE

Симметричный треугольный паттерн представляет собой период сокращения и консолидации, прежде чем цена вынуждена совершить прорыв вверх или пробой. Пробой нижней линии тренда указывает на начало нового медвежьего тренда, а прорыв верхней линии тренда указывает на начало нового бычьего тренда. Получите приборную панель для одновременного мониторинга всех инструментов и таймфреймов, которыми вы торгуете, для паттернов симметричного треугольника! https://www.mql5.com/ru/market/product/69169/
Верси

Тренд позволяет прогнозировать движение цены и определять основные направления заключения сделок. Построение трендовых линий возможно различными методами, подходящими под стиль торговли трейдера. Этот индикатор рассчитывает параметры трендового движения на основе распределения фон Мизеса. Использование этого распределения дает возможность получить устойчивые значения уравнения тренда. Кроме расчета тренда, также рассчитываются уровни возможных отклонений вверх и вниз. Индикатор обновляет свои

Индикатор определяет, когда происходит расхождение между ценой и индикатором или осциллятором. Он выявляет бычьи и медвежьи скрытые или регулярные (классические) расхождения. В сочетании с вашими собственными правилами и методами этот индикатор позволит вам создать (или улучшить) вашу собственную мощную систему. Функции
Может обнаруживать дивергенции для следующих индикаторов / осцилляторов: MACD, OsMA (скользящая средняя осциллятора), Stochastics, RSI, CCI, RVI, Awesome (AO), ADX, ATR, OBV, MF
FREE
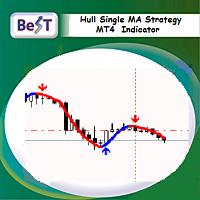
BeST_Hull Single MA Strategy is an Metatrader Indicator based on the famous indicator Hull Mov.Average . This indicator can display the Single HMA Strategy of just 1 Hull MAvg. It uses added internal filters locating the most likely Entries while it can be used as a standalone system or as an add-on to other ones.
Generally the Hull Moving Average (HMA - developed by Alan Hull) is a directional trend indicator . It captures the current state of the market and uses recent price action to determin

Праздничная распродажа: скидка 60% на Рождество! После покупки не стесняйтесь связаться со мной для получения доступа к комплексному торговому плану, который поможет вам достичь стабильного роста. Узнайте, как устанавливать реалистичные цели, управлять рисками и развивать дисциплину, необходимую для успеха в быстро меняющемся мире трейдинга. Индикатор RoboS версии 1.5 Теперь с улучшенными стрелками для покупки и продажи, индикатор RoboS помогает трейдерам всех уровней находить сигналы для входа.
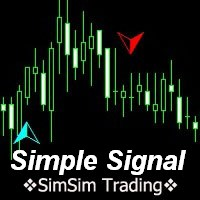
MT4 trend indicator works without redrawing. Provides signals for entering trades, works on charts of any instrument. Трендовый индикатор МТ4, работает без перерисовки. Выдает сигналы для входа в сделки, работает на графиках любого инструмента. Input parameters are for styling and messages only. / Входные параметры только для оформления и сообщений. All original signal calculations do not need additional parameters. / Все оригинальные расчеты сигнала, не нуждаются в дополнительных параметрах.
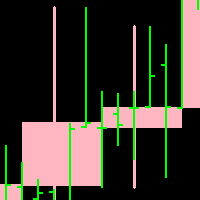
Candleline: candleline indicator. According to the specified period, draw the candle line of the specified period on the current chart. In addition, the new candlelight line is superimposed with the candlelight line of the current chart.
Note: the period of the current chart must be less than the period of the candle line to be drawn.
For the specific effect of self drawing candle line, please see the attached picture below. Parameter: 1.TimeFrame; 2. NumberOfBar; 3.Up candle li
FREE
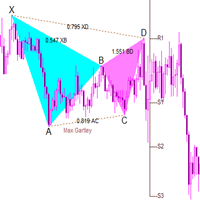
The full purchase discount is currently in progress! The best partner for any trader! This indicator is a classic butterfly indicator (harmonic trading). By default, it can identify 20 patterns and give prompts. You can also add custom shape parameters for custom prompts , prompting appropriate stop loss and profit levels. The built-in algorithm of this indicator is unique and is a unique band algorithm. Index characteristics Gartley pattern, also known as Gartley "222", was

Sends price alerts conveniently to your Android/IOS device. Make sure push notifications are enabled in Metatrader settings and the PC/VPS is online 24/7. Price levels are updated automatically, but you can modify them in global variables, if needed. Suitable for any market instrument, but if notifications are too frequent, increase point value of the indicator parameter.
FREE

Indicator values are in the range 0-100.
The greater is the indicator value, the greater is the market stability,
so the more likely we have trend.
The smaller is the indicator value - the less probable the trend is.
Tips:
Trading on unstable market:
Buy, when moving average (blue line) of the CMI indicator is below 40 and the histogram is red.
Sell when moving average (blue line) of the CMI indicator is below 40 and the histogram is green.
Close positions when CMI histogram is
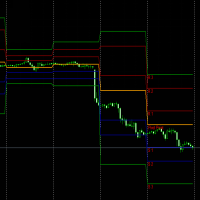
Instructions:
1. Pivot has an attractive effect. In the absence of large longs or shorts entering the market, the price moves around the axis between r1 and s1, but the movement may be irregular. Someone specializes in trading in this range, called floor trader.
2. Under the strong push of longs or shorts, the price will break through the s1-r1 area, and there will be a trend at this time, but it is still within the normal price movement range. Within this range, there will be a strong sense

Hypershot is a channel indicator that has the ability to do a commodity channel index. It is designed for short-term trading. This indicator can activate with the range of -150 and 150 in terms of value. The solid width for the histogram is 2. After backtesting it with currency pairs EURUSD, GBPUSD, USDCHF, and USDJPY, the histogram shows blue when the candlesticks go up and purple when they go down. Please invest at your own risk as this indicator does not promise any satisfactory results. With

Track Trend Triumph is a moving average indicator that allows you see candlesticks in multiple colors. It lets you see a trend in both short term and long term trading. Focus is the input of the indicator with the value of 5 and Focus 2 is the other input with 40 as it's value. This indicator is for anyone who enjoys moving average movement. It is set for current but can be use for all timeframes. When I backtested the product with currency pairs USDCAD, AUDUSD, GBPUSD,and EURUSD, it shows a div

Support and Resistance Levels Arrow Indicator please leave 5 stars to me A support level is a level where the price tends to find support as it falls. This means that the price is more likely to "bounce" off this level rather than break through it. However, once the price has breached this level, by an amount exceeding some noise, it is likely to continue falling until meeting another support level. A resistance level is the opposite of a support level. It is where the price tends to find re

Double Smoothed Price Momentum Oscillator
The Momentum Oscillator measures the amount that a security’s price has changed over a given period of time. The Momentum Oscillator is the current price divided by the price of a previous period, and the quotient is multiplied by 100. The result is an indicator that oscillates around 100. Values less than 100 indicate negative momentum, or decreasing price, and vice versa. Double Smoothed Price Momentum Oscillator examines the price changes in the deter

In this indicator, Heiken Ashi candles are calculated with the most optimal method. You can also customize the results by adjusting the amount of period and method input. But the most important advantage of this indicator is the adjustment of the time frame value. You can use this to calculate the Heiken Ashi chandels to See in time frames with lottery in the lower time chart. In this case, you get the best signal to buy or sell using two or more Heiken Ashi indicators with different timeframes

This indicator is profitable on 28/28 forex pairs on H1 timeframe WITHOUT SPREAD. You need to substract the spread to the profit amounts shown The code is robust with a high chance to continue being profitable no matter how the price action evolves. But profitable on 28 pairs doesn't mean you should trade all the pairs all the time: On less popular ones, liquidity is low, so spread will usually be high and will eat all the profits. You have to be careful and trade only when the spread is low
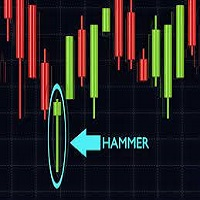
Japanese candlesticks can be used for any time frame, whether it be one day, one hour, 30-minutes ….whatever you want! They are used to describe the price action during the given time frame. Japanese candlesticks are formed using the open, high, low, and close of the chosen time period. CandleStick Scanner X provides market analysis through the detection and analysis of Japanese candlestick patterns. Candlestick based market analysis is one of the most popular technical analysis methods. Combina

FUNDING DEVIL INDICATOR has been developed by traders for traders and is not another combination out of existing indicators or a "magic, solve all situations" tool.
PASS THE FUNDED ACCOUNTS WITH IT.
It is the answer for beginners and experienced traders about the misleading concepts of the mainstream, causing 90% of retail traders, never making a living out of trading.
Successful traders are "following the smart money" and do NOT try to catch every move from start to end. Consistent traders
FREE

MACD ColorBars paints bar frames according to a trend, as well as changes the histogram color when MACD bars are rising or falling (if Color Bars is enabled in the inputs window). The growth of bars indicates a divergence between the fast and slow moving averages, while the decrease indicates their convergence.
Parameters
Fast Moving Average - period of the fast moving average; Slow Moving Average - period of the slow moving average; MA method - moving average smoothing method (simpl

Graphing calculator for quick calculation of order grids or averaging strategies. This is an improved English version of the "Grid calculator" program, which shows order volumes by level (lot), martingale ratio (MG), grid step (step), drawdown of each order and the entire grid, breakeven level (Line Breakeven). For the program to perform calculations, it is enough to pull the grid onto the chart by dragging the initial (Level 1) or control (Control line) levels with the mouse. The default param
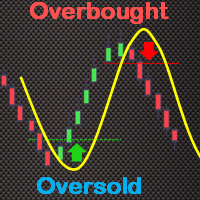
The True Oversold Overbought indicator provides you with ability to swiftly check whether the asset is oversold or overbought. Other than complementing your trading with True Oversold Overbought, you can use the indicator as your only trading system. It works with all forex instruments and will save you the headache of estimating when the market is due for a reversal or retracement. When the "Super Charge" feature is enabled, the areas where the price is in oversold/overbought status are ampl
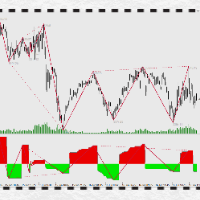
Introduction to PowerTrapezoid:
The application of market Power deviation system is not a secret, such as volume price deviation, MACD deviation, Chanlun deviation and so on. However, how to correctly understand and calculate, and accurately judge the increase or decrease of POWER is a threshold in application, which is difficult to cross with the conventional system. How to avoid reciting? How to implement multi level backflow parallel computing? How to intuitively show the range of backtrack
FREE

Smart Multi Systems
21 STRATEGIES IN 1
INPUT
FileComment = "";- trade log file EntryOnly = false;- "TRUE"- SIGNAL TO SIGNAL MODE Can Exit by Opposite Signal = false; IndicatorAlerts = false;- EntryAlerts = true; ExitAlerts = true; Reentry=false( ENABLE reentries) ENTRY SETTING PARAMETERS EntryStyle = EP-SIG+Rev Alert ( 21strategies ) ExitStyle = Rev Alert ( 8 EXITS strategies )
ENTRY and EXIT SETTINGS ===== KPeriod = 100; DPeriod = 12; Slowing = 3; method = 0; price = 0; äëÿ

What Is Market Imbalance? Market Imbalance, also known as "IPA" or Improper Price Action, is when price moves so quick in one direction with no orders on the other side of the market to mitigate the price movement. We all know Big Banks, or "Smart Money", can move the market by placing huge orders which in turn can move price significantly. They can do this because Big Banks are the top 10 Forex traders in the world . But unfortunately, the Big Banks cannot leave these orders in drawdown and mus

Аттракцион невиданной щедрости - треть цены! Индикатор разработан для отображения показаний индикатора Stohastic со старшего таймфрейма (ТФ) на младшем. Индикатор отличается симметричной шкалой. Для получения значений стандартного добавьте к показаниям 50.0. Не подсматривает в будущее на истории и не перерисовывает Может отображать показания текущего ТФ. Параметры: Timeframe - рабочий таймфрейм (должен быть равен или больше текущего иначе ошибка инициализации) Price Type - тип цены для расчета H

Currency Weight FX ( CW8) You are going to see the Forex Treasure If you think in Forex Trading you are dealing with one chart only, then you are on your way to be plunged into misery. The weight of one's currency will affect other currency or currencies. This Currency Weight FX is a breakthrough in trading tools
With Currency Weight FX ( CW8 ) indicator you will see each weight of major currency. This currency WEIGHT is very much different from currency STRENGTH most people usually mean.
CW
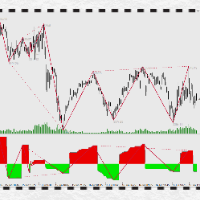
万能背驰指标简介(DivergenceLines) 注意注意,这个指标不能单独运作,对以下两个指标有依赖,请确保先获得以下两个指标后才购买本指标! 1) 动力之梯(PowerTrapezoid) (力度评估副图指标,本指标) 2) 万能分段(LinesSegment) (线段划分主图指标) 。 3)万能背驰(DivergenceLines,本指标) (比较力度背离主图指标)。 指标原理: 通过获取动力之梯指标的筹码堆积值,依照万能分段指标为依据,对同向线段向前回朔,进行一一对比,当后面线段力度比前面力度小时,定义为背驰(背离),背驰的两个高点(或两个低点)之间可以连接一条背驰线,当某个高点(或低点)连接的背驰线越多,这个点就构成了多个单级别背驰区间套。
FREE

Tom DeMark developed TD Sequential by hand, through a process of trial and error, in the 1970s. It never ceases to amaze me how something originally created to analyze daily price data can be applied so effectively, more than thirty years later, to any time frame—from one minute to one year—and to any market. The indicator has two components: TD Setup, which relies on momentum to define price ranges, and TD Countdown, which is trend based, and looks for low-risk opportunities to fade establishe
Scalper Signals Trader
Best and simple Indicator for clear and safe entry and exits. Predefines- multiple targets and stop loss, as per risk reward ratios Signals can be set – based on aggressive or safe algorithm Aggressive entries are also profitable but are raw signals without checking the higher time frame trends Safe entry meanwhile will check if the lower and the higher time frame are both in same direction, thereby having lesser trade entries and more quality. The very robust macd leve

万能线段划分指标简介: 万能线段划分是依照两根相互缠绕的均线,依金死叉为标准,将金死叉两边的高低点进行连接开成线段划分。本指标可以设定不同参数多级别叠加使用。 万能分段的原理: 在任意一组均线组成的均线系统中,均线之间的相互缠绕,形成的金死叉是有位次关系的。这点,作者在这里算是首次对外公开这个秘密。上图的均线系统中,走势处于一个较大级别的振荡行情中,均线之间相互缠绕比较频繁,金死叉的数量较多,所以,情况比较复杂。 我们知道,均线可按其周期大小进行位次排序。上图均线依照周期从小到大排序为:MA10,MA30,MA60,MA144,MA233,依照这组均线的位次关系,将每相邻两根均线金死叉做上标注。如:MA10&MA30金死叉标注为“1”,MA30&MA60金死叉标注为“2”,MA60&MA144金死叉标注为“3”,MA144&MA233金死叉标注为“4”。我们将两相邻均线金死叉完全标注完毕后,发现图上还有部份金死叉并未被标注到,这些未被标注到的金死叉全部是非相邻均线之间发生的金死叉。我们依照以上方法,可以识别出均线组之间金死叉的级别位次关系。市场行情的发展是依照此级别位次关系,从小到大
FREE

This incredible indicator allows you to overlay many moving averages to create a ribbon-like pattern. You can now easily visualize trend strength and determine pivot points by simply looking at the ribbon. Fully customizable Supports Simple , Exponential , Smoothed , and Linear Weighted moving average types Ability to use typical and median and weighted prices as input. Draw up to 32 (user-settable) moving average plots, with customizable period spacing (use length and start settings) Enable or

Woodies CCI is a momentum indicator that was developed by Ken Woods. It's based on a 14 period Commodity Channel Index (CCI) . It's a fully unbounded oscillator with a base value of 0 and has no lower or upper limit. Some traders use the indicator to spot a number of tradable CCI patterns both with and against the trend, such as the zero line reject, the reverse divergence and the trendline break. The 200 level signals an extreme reading. The indicator is often used in combination with other sig

The Price Action Alert Indicator MT4 is a custom indicator made for the traders which help the traders to distinguish the price ticks that make the market price action understood. This indicator utilizes bearish or bullish signs at its cost rates. This Price Action Strategy gives open doors for different examples in elements that are undetectable to the unaided eye. This indicator is exceptionally intended for Meta trader 4 .
You can undoubtedly make benefits by understanding this indicator
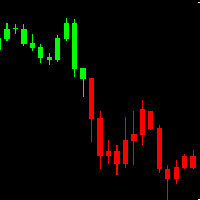
AH Candles MT4 AH Candles MT4 is a new product that allows identifying the current market phase (uptrend and downtrend ).
This indicator paints bars in different colors depending on the current state of the market trend ( Green and Red )
AH Candles MT4 is use for trading currencies
Advantages Suitable for intraday and swing trading. The indicator base on EMA method to calculate Period Parameters It can be used as a standalone tool or together with other indicators.
How to use the prod
FREE
This indicator: 1. Does not provide any signal for trading. 2. Shows chart symbol and timeframe more visible. 3. Shows spread in digit format. 4. Shows the value of each point of current symbol per one lot. 5. Changes the symbol of current chart by one click. 6. It is useful for someone who wants to analyze different symbols on one chart. by clicking on the desired symbol name at left side, indicator draws it fast.
By using of this indicator, you can easily set two alerts for each timeframe of each instrument. This is how it works: 1. Add the indicator to the chart. 2. Click on "New Alert" button. 3. Drag the drawn rectangle to your desired price. 4. Then click on "Add" button to active the alert. You can do the same for the second alert. Please: Keep in mind that for each rectangle only the side of the rectangle that is close to the price is important. For a different instrument, drag it from the market
Привет, ребята,
Для того чтобы безопасно торговать на Форекс, все, что вам нужно, - это индикатор "профессиональная внутридневная торговля".
Индикатор декабря определяет точки "Безопасной покупки/продажи", анализируя "самое низкое и самое высокое значение дня" этого инструмента в установленные вами временные интервалы, и мгновенно выдает вам "целевой канал декабрь" на живом графике.
Он предлагает Купить 1 декабря Купить 2 канала (2 зоны покупки с синей линией) в качестве безопасных точек п

MACD Intraday Trend - это индикатор, разработанный на основе адаптации оригинального MACD, созданного Джеральдом Аппелем в 1960-х годах.
За годы торговли было замечено, что, изменяя параметры MACD с пропорциями Фибоначчи, мы достигаем лучшего представления непрерывности движений тренда, что позволяет более эффективно определять начало и конец ценового тренда.
Благодаря своей эффективности в обнаружении ценовых тенденций, также можно очень четко идентифицировать расхождения вершин и оснований,
FREE

Pivot Point Fibo RSJ - это индикатор, который отслеживает линии поддержки и сопротивления дня с использованием ставок Фибоначчи.
Этот впечатляющий индикатор создает до 7 уровней поддержки и сопротивления через точку разворота с использованием ставок Фибоначчи. Замечательно, как цены уважают каждый уровень этой поддержки и сопротивления, где можно определить возможные точки входа / выхода из операции.
Функции До 7 уровней поддержки и 7 уровней сопротивления Устанавливайте цвета уровней индивид
FREE

MACD Intraday Trend PRO - это индикатор, разработанный на основе адаптации оригинального MACD, созданного Джеральдом Аппелем в 1960-х годах.
За годы торговли было замечено, что, изменяя параметры MACD с пропорциями Фибоначчи, мы достигаем лучшего представления непрерывности движений тренда, что позволяет более эффективно обнаруживать начало и конец ценового тренда.
Благодаря своей эффективности в обнаружении ценовых тенденций, также можно очень четко идентифицировать расхождения вершин и осно
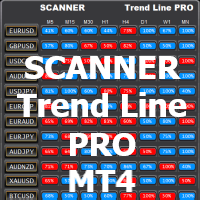
Работает с индикатором Trend Line PRO и set-файлами, созданными Optimizer Utility Вы можете скачать дополнительные программы: здесь
Сканер предназначен для приема новых сигналов индикатора Trend Line PRO на всех парах и таймфреймах от M5 до MN1
Для того чтобы сканер работал, у вас должен быть индикатор. Основным преимуществом сканер Trend Line PRO является возможность использовать индивидуальный файл набора для каждой пары и таймфрейма. Вы можете автоматически настраивать, изменят
FREE

Индикатор определяет направление тренда и раскрашивает свечи на графике в соответствующий цвет. Позволяет входить в сделку в самом начале движения Максимально простая настройка индикатора Можно использовать на любых валютных парах, металлах и криптовалюте, а так же при работе с бинарными опционами
Отличительные особенности Показывает направление тренда Не перерисовывается; Простая и точная настройка; Работает на всех таймфреймах и на всех символах; Подходит для торговли валютами, металлами, опц
FREE
Price Action Indicator gives you reverse or even continous trend signals depending on your timeframe and Strategy used. !!!This is not a holy grail indicator and it will not give 100% winning rate!!! As you can see, it is not giving a lot of signals because of the price movements in side way (flat) trend. You can use it on every major currency pairs and even on indices. Please be aware of using this indicator with other strategies and indicators. Use MM and Risk Management properly. Sometimes
FREE
An indicator for receiving a lot of signals Can be used in all time frames and all markets Trade professionally using professional indicators yourself . Using this indicator, you will have a signal at any time. Do not miss any market movement. Get the signal very simply and clearly.
----------------------------------------------------------------------------------------------------------------------------------------------------------------------------------------------------
How it work:
Th

This simple indicator paints with a darker color on the volume bar when the quantity traded is above the average of select number of periods of the volume itself, highlighting the moments when there was a large volume of deals above the average. It is also possible to use a configuration of four colors where the color tone shows a candle volume strength. The indicator defaults to the simple average of 20 periods, but it is possible to change to other types of averages and periods. If you like t
FREE

This indicator uses support and resistance, volume and some special formula to calculate the volume to filter the candles. If the volume reaches a specific value, And at the same time, Candle breaks the support/resistance line, There would be a signal and we can enter the market. Signals appear when the current candle closes. then you can enter the trade when a new candle appears. Please don't forget to follow your money management plan.
MT5 Version
Support/Resistance Breakout MT5 : https://

This is a Multi-currency multi-timeframe Support/Resistance Scanner Dashboard for Metatrader 4 (MT4) platform.
Get all extras and download free demo here: https://www.mql5.com/en/blogs/post/760210
Read detailed description in post above. And get the SR Indicator for individual charts.
Features: Scan Support/Resistance zones (also called Supply/Demand zones) Show alert when price is inside these zones and highlights the pair/timeframe Show or hide SR zones price nearest to current price (Price

////////////////////////////////////////////////////////////////////////////////////
Улучшенная версия стандартного индикатора Standard Deviation.
Теперь это адаптивная и сглаженная линия.
Настройка не совсем простая - но я надеюсь что вы справитесь. Понять показания этого индикатора очень просто, смысл такой же как и у обычного Standard Deviation .
/////////////////////////////////////////////////////////////////////////////////////
Надеюсь этот индикатор очень Вам пригодится в успеш
FREE
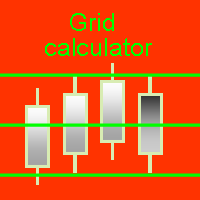
Графический калькулятор для быстрого расчёта сеток ордеров или стратегий усреднения. Показывает объёмы ордеров по уровням, коэффициент мартингейла, шаг сетки, просадку каждого ордера и всей сетки, уровень безубытка ( Loss = 0) . Чтобы программа выполнила расчёты достаточно натянуть сетку на график, перетащив мышкой начальный ( Level 1) или контрольный (Level control) уровни. Параметры по умолчанию можно изменить через окно настроек. Оно появляется при первой загрузке Grid calculator либо п

Аттракцион невиданной щедрости - треть цены!
Индикатор отображает показания RSI со старшего таймфрейма (ТФ) на младшем. Не перерисовывает начиная с 1 бара. Не подсматривает в будущее на истории на старшем ТФ. Индикатор отличается симметричной шкалой относительно 0. Для получения значений стандартного добавьте к показаниям 50.0. Может отображать показания текущего ТФ. Требователен к истории текущего и старшего ТФ. Параметры: RSI TimeFrame - рабочий таймфрейм (должен быть равен или больше текущег

Здравствуйте! Надоело постоянно подписываться на чужие сигналы и зарабатывать копейки? Хочешь сам управлять своей торговлей? Значит ты на правильной странице! Всё очень просто ==> покупаешь мой индикатор ==> ставишь на график ==> синяя стрелочка - заходишь в покупку ==> красная стрелочка - заходишь в продажу. Справится даже младенец! Удобная гистограмма для отслеживания направления движения рынка. Ты все еще тут? Тогда прочитай описание параметров и посмотри скриншоты: Stoch K period -
MetaTrader Маркет - торговые роботы и технические индикаторы для трейдеров, доступные прямо в терминале.
Платежная система MQL5.community разработана для сервисов платформы MetaTrader и автоматически доступна всем зарегистрированным пользователям сайта MQL5.com. Ввод и вывод денежных средств возможен с помощью WebMoney, PayPal и банковских карт.
Вы упускаете торговые возможности:
- Бесплатные приложения для трейдинга
- 8 000+ сигналов для копирования
- Экономические новости для анализа финансовых рынков
Регистрация
Вход
Если у вас нет учетной записи, зарегистрируйтесь
Для авторизации и пользования сайтом MQL5.com необходимо разрешить использование файлов Сookie.
Пожалуйста, включите в вашем браузере данную настройку, иначе вы не сможете авторизоваться.