Смотри обучающее видео по маркету на YouTube
Как купить торгового робота или индикатор
Запусти робота на
виртуальном хостинге
виртуальном хостинге
Протестируй индикатор/робота перед покупкой
Хочешь зарабатывать в Маркете?
Как подать продукт, чтобы его покупали
Новые технические индикаторы для MetaTrader 4 - 8

The KT Dynamic Price Oscillator (DPO) offers a specialized approach to analyzing the trend, momentum, and volatility of financial instruments. It excels at identifying trend continuations, overbought or oversold conditions, and potential reversal points with precision. It is specifically designed to assist traders in identifying short-term price cycles and potential reversals by effectively filtering out long-term trends.
How to use the DPO
Trend Confirmation: The DPO acts as a reliable confir

Trendfollow Indicator - with Stoploss and Trailingstop Accurate Signals – Identifies trend reversal candles Filter – for better trend detection Intelligent signal limitation - Only qualified signals in the trend direction are displayed Easy to use – Perfect for beginners & professionals Visual support – arrows in the chart + display in real time Notifications – Receive alerts & push notifications The indicator also provides the initial stoploss. As the position progresses, this is us
Volonacci Indicator It is an indicator that combines Fibonacci and volume to determine the price direction This indicator helps you identify Fibonacci angles according to the strategy The Volonacci indicator is indeed an interesting combination of Fibonacci levels and volume. This indicator uses Fibonacci tools to identify potential support and resistance levels, and enhances this by using volume to confirm the strength behind the price action.
MT5 Version https://www.mql5.com/en/market/produc

Session Liquidity is the most anticipated trading strategy among the ICT trader. With this indicator you could frame the trade by simply deploying it on the chart. By simply inputting the Asian Opening Time, New York Opening Time, and choose the color option and display option you like then you will get the session laid down for you on the chart. You can choose between showing session as box or horizontal line. I personally trade this strategies for quite sometimes.

Waterfall Trading Indicator Overview The Waterfall Trading Indicator is a powerful momentum detection tool designed to identify high-probability trading opportunities across multiple timeframes. Built on pure price action analysis, this indicator provides clear, non-repainting signals that are especially effective for binary options and forex trading. Key Features Non-Repainting Signals : Based on real-time price action, ensuring reliable trade signals Multi-Timeframe Compatibility : Effective a

Master alert is an indicator based on deep mathematical and statistical calculations. It generates two types of signals; Buy signals Sell signals It uses the following indicators to generate signals; Adx CCI SAR MACD MA WPR MOM When the indicator shows 6 or more of the above indicators with the same buy signal on the dashboard the market is trending up. It is a good time to place buy order. When the indicator shows 6 or more of the as above signals with the same sell signals the market is trendi
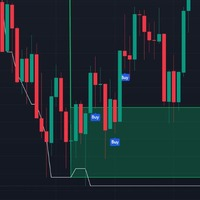
MACDx RSI Supply And Demand Indicator is a dynamic trading indicator designed to identify potential reversal zones in financial markets by combining the momentum insights of the Relative Strength Index (RSI) with order block (supply/demand) levels derived from a MACD-based custom tool. It visually highlights bullish and bearish zones on the chart, offering clear entry signals through directional arrows. Ideal for swing traders and reversal strategists, this tool aims to capture price reversals

Range indicator is a mt4 indicator that shows various levels to enter and Exit a trade. Once you have installed the indicator in the terminal you will see on the trading dashboard various values which include; Support level in pips from the current price, Resistance level in pips from the current price, Stop loss level in pips from the current price to exit if market conditions change
Range bound is a mt4 indicator that shows various levels to enter the market. It uses MACD as the primary reference indicator. When MACD oscillator is showing buy or sell signals these are displayed on your trading dashboard but as levels to buy or sell on the main chart. The indicator shows blue signals and red signals That are support and resistance levels. In short this indicator shows ranges where your trades should be safe from market changes against your order.

Arrow up down is a mt4 indicator that shows various levels to enter the market. It consists of two signals; Buy signal Sell signal Buy signals are shown as blue arrows on the chart once you install the indicator. Sell signals are shown as red signals on the chart. The indicator uses other underlying indicators like moving average together with statistical calculations to generate signals.

RSI bands indicator is a mt4 indicator that shows various levels to enter trades based on market conditions. It consists of the below buffers; Yellow buffer Blue buffer White buffer When the yellow buffer is above blue buffer the market is trending up good place to open buy order. When the blue buffer is above yellow buffer the market is trending downwards good time to place sell order. Also another alternative scenario is when yellow buffer is above upper white band buffer indicates strong uptr

Rsi with Bollinger bands is a mt4 indicator that shows various levels to enter trades in the market based on conditions. It consists of two main buffers; Yellow buffer that is the current price Grey buffer that shows overbought and oversold levels. When the yellow buffer crosses 70 zone in grey buffer market is trending upwards. When the yellow buffer crosses below 30 zone in the grey buffer the market is showing a strong downtrend. The overbought and oversold levels are customizable in the ind
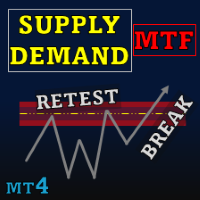
Special offer : ALL TOOLS , just $35 each! New tools will be $30 for the first week or the first 3 purchases ! Trading Tools Channel on MQL5 : Join my MQL5 channel to update the latest news from me Supply Demand Retest and Break Multi Timeframe , этот инструмент отображает зоны спроса и предложения на основе свечей с сильным импульсом, позволяя вам идентифицировать эти зоны на нескольких временных интервалах с помощью функции timeframe selector . С метками повторного тестирован
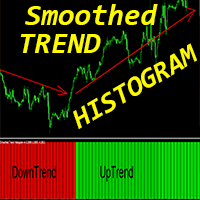
Индикатор Crypto_Forex "Сглаженная гистограмма тренда" для MT4, без перерисовки.
- Индикатор сглаженной гистограммы тренда гораздо эффективнее любого стандартного пересечения скользящих средних. - Он особенно ориентирован на обнаружение крупных трендов. - Индикатор имеет 2 цвета: красный для медвежьего нисходящего тренда и зеленый для бычьего восходящего тренда (цвета можно изменить в настройках). - С оповещениями для мобильных устройств и ПК. - Отличная идея для объединения этого индикатора с
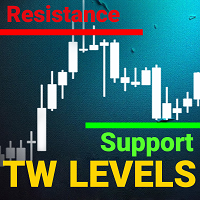
support resistance levels indicator mt4:
Этот инструмент является индикатором многовременных рамок, который определяет и отображает линии поддержки и сопротивления, а также уровни Фибоначчи на графике с такой же точностью, как человеческий глаз. Уровни поддержки и сопротивления TW для форекс имеют сложный алгоритм, который сканирует график для определения предыдущих уровней стабилизации цен и отскоков, фиксируя количество касаний.
Вы устали вручную рисовать уровни поддержки и сопротивления и

1.Спрос и предложение являются одной из основных стратегий, используемых в торговле. Он фокусируется на древних законах спроса и предложения, а также на движении цен на свободном рынке. Стратегия основана на том, что количество доступных инструментов и спрос покупателей на них определяют цену. Он указывает на диаграмме, где спрос преобладает над предложением (область спроса), регион, который способствует росту цен, или регион, где предложение преобладает над спросом (область предложения), котор
FREE
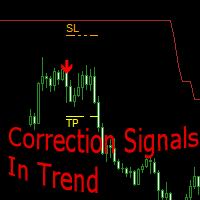
Correction Signals In Trend - технический индикатор анализирующий динамику рынка, помогает трейдеру определять направление тренда и находить точки для открытия ордеров.
Индикатор следящий за трендом в формате линий поддержки и сопротивления показывает восходящий или нисходящий тренд.
В трендовом направлении после окончания коррекции совершается поиск сигналов. Стрелками указаны потенциальные моменты для совершения торговых операций.
Для каждого сигнала отображаются рекомендуемые уровни установки

Индикатор силы быков и медведей Обновление 1.3
Индикатор силы быков и медведей теперь включает встроенный профиль объема для обнаружения областей с самым высоким объемом в пределах заданного диапазона бара. Этот профиль можно дополнительно настроить в соответствии с вашими предпочтениями для более точного определения силы быков и медведей с максимальным объемом.
Это помогает в: Раннем обнаружении и возможностях для точного входа. Обнаружении разворотов. Обнаружении откатов. Обзор:
Индикатор с

Откройте будущее торговли с Easy Entry Points! Разработанный известным Фелипе FX, Easy Entry Points - это следующее поколение индикаторов торговли, предназначенное для предоставления интуитивного и эффективного торгового опыта. С передовыми функциями и удобным интерфейсом, этот индикатор идеально подходит для торговцев всех уровней. Основные функции: Сигнал легкого входа: Определите идеальные точки входа на основе пересечений EMA быстрых и медленных, обеспечивая точные и своевременные торговые р
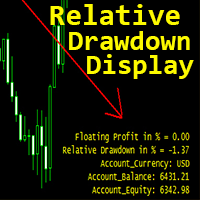
Crypto_Forex Indicator "Relative Drawdown Display" для MT4, полезный торговый инструмент.
Это ОБЯЗАТЕЛЬНЫЙ индикатор для трейдеров, использующих системы торговли по сетке!!!
- Индикатор Relative Drawdown Display показывает текущую относительную просадку или плавающую прибыль в % на вашем счете. - Встроенные оповещения для ПК и мобильных устройств с регулируемым уровнем срабатывания. - Индикатор также показывает баланс и капитал счета. - Можно расположить значения индикатора в любом углу графи
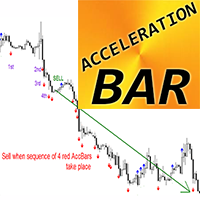
Индикатор Crypto_Forex Acceleration Bar для MT4 — способен улавливать огромные тренды.
- Индикатор "Acceleration Bar" — очень мощный инструмент для торговли по тренду — влияние флэта на рынке сведено к минимуму. - Bullish Acceleration Bar (синий) — это бар на графике, у которого Max выше, чем max предыдущих 5 баров, и Min ниже, чем min следующих 5 баров. - Bearish Acceleration Bar (красный) — это бар на графике, у которого Min ниже, чем min предыдущих 5 баров, и Max выше, чем max следующих 5 б

Индикатор Volume Bar POC — это инновационный инструмент, который обеспечивает точную визуализацию ключевых ценовых уровней (Point of Control, POC) на основе тикового объема сделок. Этот индикатор анализирует каждую ценовую точку внутри свечей и отображает наиболее значимые уровни, которые можно использовать в качестве зон сильной поддержки и сопротивления. Подходит как для внутридневных, так и для долгосрочных торговых стратегий. Как работает индикатор Volume Bar POC? Индикатор использует продви
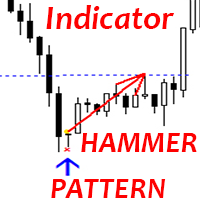
Индикатор Crypto_Forex "Молот" для MT4.
- Индикатор "Молот" - очень мощный индикатор для торговли по ценовому действию: без перерисовки, без задержки. - Индикатор обнаруживает бычьи модели Молот на графике: синяя стрелка на графике (см. изображения). - С оповещениями на ПК, мобильных устройствах и электронной почте. - Индикатор "Молот" отлично сочетается с уровнями поддержки/сопротивления.
// Больше отличных советников и индикаторов доступно здесь: https://www.mql5.com/en/users/def1380/seller
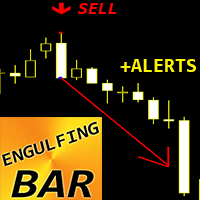
Индикатор Crypto_Forex ENGULFING Bar Pattern для MT4.
- Индикатор "ENGULFING Bar" - очень мощный индикатор для торговли по ценовому действию: без перерисовки, без задержки. - Индикатор обнаруживает паттерны ENGULFING Bar на графике: - Бычий ENGULFING Bar - сигнал синей стрелки на графике (см. рисунки). - Медвежий ENGULFING Bar - сигнал красной стрелки на графике (см. рисунки). - С оповещениями на ПК, мобильных устройствах и электронной почте. - Индикатор "ENGULFING Bar Pattern" отлично сочетае
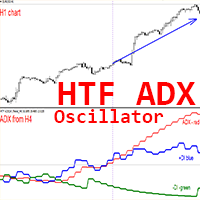
Индикатор Crypto_Forex HTF ADX для MT4.
- Обновите свои методы торговли с помощью профессионального индикатора HTF ADX для MT4. HTF означает - более высокий таймфрейм. - ADX (красная линия) используется для измерения силы тренда - если значение ADX выше 20 и имеет восходящую форму - тренд сильный. - Если +DMI (синяя линия) выше -DMI (зеленая): цена движется вверх, а ADX измеряет силу восходящего тренда. - Если -DMI (зеленая линия) выше +DMI (синяя): цена движется вниз, а ADX измеряет силу нисх
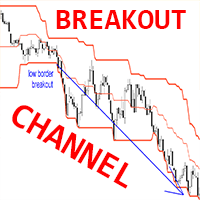
Crypto_Forex Индикатор BREAKOUT CHANNEL для MT4, без перерисовки.
- Этот индикатор можно использовать как полноценную торговую систему, основанную на прорывах максимумов/минимумов. - Он имеет всего 1 параметр - HYSTORY DEPTH, он отражает количество свечей, которые учитывает индикатор. - Рекомендуемые значения параметра HYSTORY DEPTH: таймфрейм D1 - 20 (один месяц), H4 - 30 (одна неделя), H1 - 24 (один день). - BREAKOUT CHANNEL состоит из 3 линий: High Border - максимальная цена последних N (па
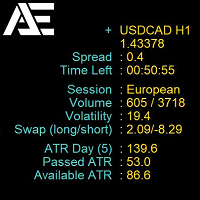
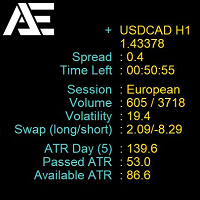
Market Info Display — это универсальный индикатор, отображающий важную рыночную информацию, организованную в удобном интерфейсе прямо на графике. Его функции рассчитаны на эффективное отображение данных, которые помогают трейдерам принимать взвешенные решения. Он предоставляет данные о текущем спреде, времени до закрытия свечи, текущей торговой сессии, объеме, волатильности, изменении цены за день и ATR (дневной волатильности). Индикатор поддерживает многоязычную настройку (русский и английски

Индикатор Grand Signal -это уникальный инструмент благодаря которому происходит не только понимание природы рынка,но и точное определение точех входа по тренду ,после предела коррекции внутри дня,с точностью до пяти минутной свечи!Имеются индивидуальные настройки для каждой валютной пары!После преобретение обязательно напишите мне в личное сообщение для обсуждения инструкций! Телеграм @Lapinsania или здесь в Маркете!
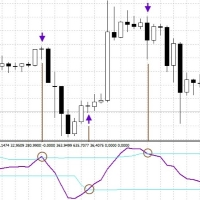
Cyclic Smoothed Relative Strength Indicator
The cyclic smoothed RSI indicator is an enhancement of the classic RSI, adding
additional smoothing according to the market vibration,
adaptive upper and lower bands according to the cyclic memory and
using the current dominant cycle length as input for the indicator. The cRSI is used like a standard indicator. The chart highlights trading signals where the signal line crosses above or below the adaptive lower/upper bands. It is much more responsive
FREE

Dynamic Center of Gravity Indicator Revolutionary Price Action Trading System Harness the power of price momentum with the Dynamic Center of Gravity indicator - an advanced price action trading tool designed for serious traders. This innovative indicator identifies powerful gravity zones that attract rapid price movements, creating high-probability trading opportunities when momentum breaks free from these zones. Key Features Pure price action analysis - no lagging indicators Works effectively a

Evolutionize Your Trading with the UT Alert Bot Indicator for MQL4 The UT Alert Bot Indicator is your ultimate trading companion, meticulously designed to give you an edge in the fast-paced world of financial markets. Powered by the renowned UT system, this cutting-edge tool combines advanced analytics, real-time alerts, and customizable features to ensure you never miss a profitable opportunity. Whether you’re trading forex, stocks, indices, or commodities, the UT Alert Bot Indicator is your k
FREE
This is an indicator that seeks to show support and resistance zones in channels through expansion .
Abraxis Indicator Discover our innovative Abraxis Indicator , a powerful tool designed for traders seeking to refine their chart analysis and maximize their trading opportunities. This indicator was developed to operate efficiently across different timeframes, allowing you to adjust your strategies according to your needs. Key Features Calculation of Lines Based on Previous Pil

Golden Trend Pulse — трендовый индикатор разработан специально для Золота,также может использоваться на Криптовалютном и Фондовом рынках. Индикатор предназначенный для точного определения рыночных тенденций с помощью передовых аналитических методов. Инструмент объединяет многофакторный анализ ценовой динамики и адаптивную фильтрацию рыночного шума, обеспечивая высокую точность определения ключевых точек входа и выхода. Благодаря интеллектуальной системе индикатор эффективно справляется с изменч

Adjustable Volume Profile Indicator The Adjustable Volume Profile is a custom MetaTrader 4 (MT4) indicator designed to visually display the volume distribution of a financial instrument across a specific price range and time period. This indicator allows traders to analyze the volume profile based on either real volume or tick volume, helping to identify key levels of support, resistance, and market activity.
Key Features: Customizable Timeframe: The indicator can be set to any available timefr

Стрелочный индикатор «Пигмент» Этот продукт отлично подходит для бинарных опционов. Хорошо показал себя на таймфреймах М5 М15. Мультивалютность также хорошо работает в новостных выпусках. Не рисует и сигнал появляется на текущей свече Синяя стрелка купить красная стрелка продать Вы также можете установить частоту сигнала по своему вкусу: В настройках просто измените Период, по умолчанию — Период 3.

The Colored MACD indicator is a versatile and powerful tool designed to enhance your technical analysis by providing an intuitive visualization of market momentum and trend changes. Built on the foundation of the popular Moving Average Convergence Divergence (MACD) indicator, this version introduces color-coded histograms to easily distinguish between bullish and bearish momentum. Key Features: Color-Coded Visualization : The indicator features a lime-colored histogram when the MACD is above the
FREE

Trend Graf - это инструмент позволяющий видеть тренд текущего момента,имея стартовые диапозоны которые появляются каждые шесть часов ,способен давать нам уровень предела коррекции как по тренду так и на смену ему.Работает на всех валютных парах!В настройках мы имеем смещение для проекции стартового диапозона от текущей установки ,для каждой валютной пары можно подобрать то смещение, которое лучшим образом будет показывать предел коррекции.Следующее обновление будет включать сигнальные указатели!
FREE
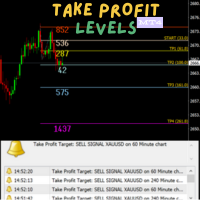
This indicator outlines take profit (TP) stations derived from the Dinapoli ABC price projections. The key levels identified include COP (the critical operation point) designated as TP1, OP (the optimal point) marked as TP3, and SXOP (the secondary operation point) noted as TP4.
This indicator proves to be especially beneficial for traders entering positions without clearly defined exit points. The Dinapoli levels provide precise price projections that highlight where the market is most likely
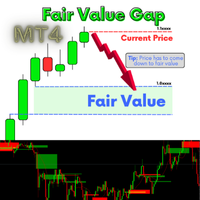
A fair value gap (FVG) is a temporary price gap that occurs when the price of a stock or security is out of line with its fair value. This gap is often caused by an imbalance between buyers and sellers. How it works Price imbalance When there is an imbalance between buyers and sellers, the price of a security can move too quickly. Price gap This creates an unadjusted area on the price chart, known as the fair value gap Price correction The price is often drawn back to the fair value gap, as i
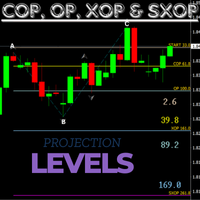
If you're familiar with COP, OP, and XOP levels, this indicator is definitely worth considering. There's no need to manually plot the ABC levels, as the indicator automatically calculates and displays the OP projection levels for you, updating regularly as the price changes.
This is an essential indicator for your trading toolkit. Please if you are unsual on how to use this indicator feel fell to ask me for help and i can assist you where i can.
Happy trading!

If you're familiar with trading using Dinapoli levels, then this indicator is definitely worth your attention. It automatically plots key levels such as COP (Change of Polarity), OP (Objective Price), and XOP (Extended Objective Price) on your charts, regardless of the timeframe you choose to work with.
One of the standout features of this indicator is its ability to generate alerts. Whenever a new ABC pattern is automatically identified and plotted by the indicator, you will receive a notifica
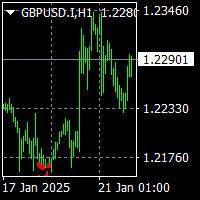
To get access to MT5 version please click here . This is the exact conversion from TradingView: "Fearzone - Contrarian Indicator" by " Zeiierman ". The screenshot shows similar results from tradingview and Metatrader when tested on ICMarkets on both platforms. This is a light-load processing and non-repaint indicator. All input options are available. Buffers are available for processing in EAs. You can message in private chat for further changes you need. Thanks for downloading

Trump Arrow is for trading the trends of the markets. It uses convergence and divergence. Use it during active times to get behind a trend and follow it with MA filters or other strategies you have. The indicator works well for small time frames just and it suggests using 15 min. Others work too but for day trading 5-15 is best. 1 hr charts if you want to filter for longer term trends.
На графике EURUSD это БЕСПЛАТНО. Версия со всеми символами! Свяжитесь со мной по любым вопросам
Market Info Display — это универсальный индикатор, отображающий важную рыночную информацию, организованную в удобном интерфейсе прямо на графике. Его функции рассчитаны на эффективное отображение данных, которые помогают трейдерам принимать взвешенные решения. Он предоставляет данные о текущем спреде, времени до закрытия свечи, текущей торговой сессии, объеме, волатильности, изменении цены за де
FREE

Индикатор DYJ BoS MT4 автоматически определяет и отмечает основные элементы изменений структуры рынка, включая:
Прорыв структуры (BoS): обнаруживается, когда цена совершает значительное движение, прорывая предыдущую точку структуры.
Он отмечает возможные линии восходящего тренда и линии нисходящего тренда (UP & DN, то есть непрерывные новые максимумы и новые минимумы), и как только цена пробивает эти линии, он отмечает красные (МЕДВЕДЬ) и зеленые (БЫЧЬИ) стрелки.
BoS обычно происходит, когда
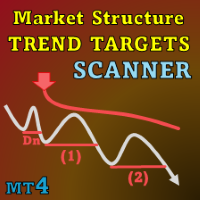
Special offer : ALL TOOLS , just $35 each! New tools will be $30 for the first week or the first 3 purchases ! Trading Tools Channel on MQL5 : Join my MQL5 channel to update the latest news from me I. Введение
Market Structure Trend Targets Scanner — мощный инструмент для анализа рыночных трендов, выявления точек прорыва и управления рисками с помощью динамического стоп-лосса. Отслеживая предыдущие максимумы и минимумы для определения прорывов, этот инструмент помогает трейдерам б
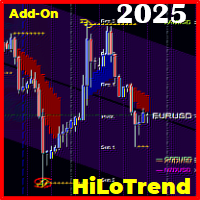
[Ограниченное время запуска, загрузите как можно скорее!] Отказ от ответственности: Этот продукт « [#1] HiLoTrend CyberBot » доступен для бесплатной загрузки как один из бесплатных дополнительных продуктов в дополнение к бесплатному продукту « [#1] Oscillator CyberBot », работу которого можно наблюдать в прилагаемом видеопрезентационном ролике. Как бесплатный дополнительный продукт, он не может быть активирован независимо; он функционирует только тогда, когда активен продукт Expert Advis
FREE
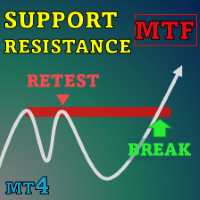
Special offer : ALL TOOLS , just $35 each! New tools will be $30 for the first week or the first 3 purchases ! Trading Tools Channel on MQL5 : Join my MQL5 channel to update the latest news from me В постоянно меняющемся мире финансовых торгов точное определение и анализ уровней поддержки и сопротивления имеют решающее значение для принятия обоснованных инвестиционных решений. SnR Retest and Break Multi-Timeframe — это индикатор поддержки и сопротивления, разработанный для улучшени
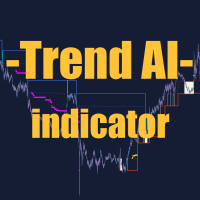
Trend AI Indicator Описание:
Trend AI Indicator — это мощный инструмент для анализа рынка, использующий искусственный интеллект для определения трендов и ключевых уровней. Индикатор автоматически адаптируется к изменяющимся рыночным условиям, предоставляя точные данные для принятия решений. Основные функции: Определение тренда: Индикатор использует алгоритмы машинного обучения для точного определения направления тренда (восходящий, нисходящий, боковой). Ключевые уровни: Автоматически строит
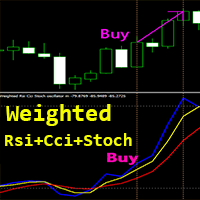
Индикатор Crypto_Forex «Взвешенный RSI Cci Stoch Oscillator» для MT4, без перерисовки.
- Этот уникальный индикатор объединяет 3 в 1: RSI, CCI и Stochastic для расчета! - Точные возможности импульсной торговли с этим программным обеспечением - см. примеры на картинках. - Индикатор состоит из 3 линий: - Сам Weighted Rsi Cci Stoch Oscillator (синий цвет); - Быстрая скользящая средняя осциллятора (желтый цвет); - Медленная скользящая средняя осциллятора (красный цвет); - Зона выше 50 - зона переку

Версия MT4 https://www.mql5.com/en/market/product/129411 Версия MT5 https://www.mql5.com/en/market/product/129412
Dashboard Scanner Kalman — это усовершенствованный многосимвольный и многотаймфреймовый инструмент сканирования, разработанный для упрощения вашего торгового процесса за счет использования мощных расчетов уровня тренда и поддержки-сопротивления Калмана. Этот индикатор сочетает в себе алгоритмы следования за трендом и точный анализ поддержки-сопротивления, чтобы помочь вам быстро оп
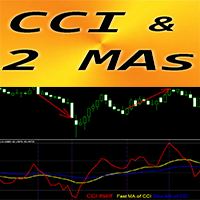
Crypto_Forex Indicator "CCI and 2 Moving Averages" для MT4, без перерисовки.
- Commodity_Channel_Index (CCI) отлично подходит для импульсной торговли в направлении тренда. - Индикатор "CCI and 2 Moving Averages" позволяет вам видеть быстрые и медленные скользящие средние индикатора CCI. - Восходящий тренд - быстрая скользящая средняя выше медленной; нисходящий тренд - быстрая скользящая средняя ниже медленной. - CCI - один из самых популярных осцилляторов для торговли - он измеряет разницу меж

Максимизируйте свои результаты с продвинутым индикатором тренда RSI+EMA! Откройте новый уровень точности в техническом анализе с этим мощным индикатором, созданным для трейдеров, которые хотят четко определять тренды и действовать в нужный момент. Основные функции : Визуальные сигналы на графике : Легко определяйте лучшие моменты для покупки и продажи с помощью стрелок, четко отображаемых на графике. Комбинация EMA и RSI : Передовая технология, использующая экспоненциальные скользящие с

Обзор:
Индикатор Цветной Parabolic SAR – это визуально улучшенный торговый инструмент, разработанный для облегчения следования за трендом и идентификации сделок. Этот настраиваемый индикатор предоставляет четкие визуальные подсказки с цветными сигналами для бычьих (покупка) и медвежьих (продажа) трендов прямо на вашем графике MT4. Основные особенности: Цветные сигналы: Лаймовый зеленый символ "o" для сигналов на покупку. Красный символ "o" для сигналов на продажу. Настраиваемые параметры: Регул
FREE
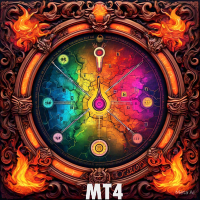
Индикатор тепловой карты для анализа объема Индикатор тепловой карты предоставляет практичный и визуальный подход к анализу рыночных объемов, позволяя трейдерам быстро принимать обоснованные решения. Основные характеристики 1. Представление тепловой карты Отображает интенсивность объема с использованием понятной цветовой шкалы. Синий : Низкая активность Зеленый : Умеренная активность Оранжевый : Высокая активность Красный : Максимальный объем 2. Настраиваемый интерфейс Настройка цветовой схемы п

**"Discounted Price."**
We are always in pursuit of the perfect time to achieve the desired price, as timing is a pivotal factor in trading. This is exactly what the indicator does: It seamlessly combines time and price, dynamically mapping them onto the chart using two lines that represent both time and price together, introducing a completely innovative conept. • No more complex settings. Simply place the indicator on your chart, and it will handle everything for you. ---------------------

Одним из ключевых элементов в трейдинге является определение зон или уровней, которые позволяют трейдерам принимать решения о покупке или продаже во время торговли. Индикатор отображает уровни Фибоначчи , рисуя уровни на основе исторических дневных или недельных данных. Ежедневные уровни обновляются с открытием каждого нового дня, в то время как недельные уровни остаются неизменными в течение текущей торговой недели. Интерфейс прост и понятен, не содержит ненужных сложностей, что обеспечивает п
When time converges with price in a critical zone, it creates a pivotal area that simplifies decision-making. This is precisely the functionality of this indicator, as it integrates time and price to highlight a robust zone you can rely on.
Key Features of the Indicator: • Dynamic Time-Price Zones: The indicator draws a time-price zone determined by the user, based on customizable settings available in the configuration. • Customizable Day Selection: A dedicated field allows you to choose th
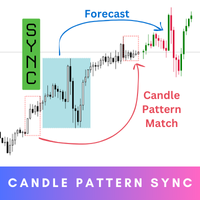
Candle Pattern Sync is your ultimate tool for precision and insight in trading. Step into the future of trading with this innovative indicator that’s designed to help you understand market behavior by analyzing historical patterns and giving you an idea of what might come next. While the forecasts provide valuable probabilities based on history, they’re not guarantees – think of them as a powerful guide to inform your decisions, not a definitive answer. MT5 Version - https://www.mql5.com/en/mar

When geometric shapes meet with time and price, they give more confidence in the chart The indicator plots daily and weekly price triangles So that the weekly is kept until the end of the trading week While the Daily is changing with each opening The size of the triangles varies based on the previous data They will be an aid in decision-making, especially on both sides of the Triangle * Contains options to activate and disable triangles * Merge weekly and daily triangles together, each c
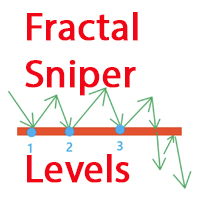
Fractal Sniper Levels - это мощный технический индикатор, находит отбой фрактальных формаций от одной ценовой зоны. Главная особенность индикатора: он анализирует фракталы не просто как экстремумы, а как полноценные разворотные формации, что значительно повышает надежность определяемых уровней.
Ключевые преимущества Работа с фракталами как с разворотными формациями, а не просто как с локальными экстремумами Интеллектуальный анализ отбоя каждого фрактала от уровней одной и той же ценовой зоны А
This indicator is free and shows you the trading volume on all timeframes. You can manage your open positions by time and volume by drawing a moving average based on the desired period, as well as adding multiple levels with a better understanding of the trading volume change.
But to fully use this indicator, you can visit the Utilities section of MQL5.com and download the "ّ Forex Time Zones " Expert Advisor and watch how to use it on our YouTube channel.
These two tools complement each other a
FREE

Enter/Exit indicator Try trading on signal change BUY/SELL to Sell SELL/BUY to buy or exit by signal change. Very good for trading news. - - - - - - - - - - Please leave positive comments. - - - - - - - - - - - - - - - - - - - - - - - - - - - - - - - - - - - - - - - - - - - - - - - - - - - - - - - - - Info: CalculatedBars = Indicator Calculated Bars; AlertConfirmation = true On false Off LongBarPoints = maximum point value for signal long bar size. Buffer0[] = Arrow Up; Buffer1[] = Arrow Down;
CrossPoint4 - индикатор, помощник начинающим трейдерам. В дополнение к стандартной функции "Перекрестие" (Ctrl + F), CrossPoint4 покажет как правильно установить уровни StopLoss и TakeProfit с учетом минимально допустимого уровня, рассчитает количество пунктов между двумя точками и переведет это в валюту счета, учитывая предполагаемый лот сделки. Бывает, при открытии сделки, начинающий трейдер совершенно забывает про спред. В едь по умолчанию линия Ask отключена и на инструментах особенно с бо
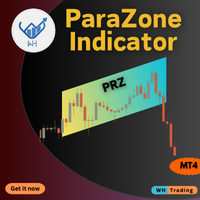
The ParaZone Indicator MT4 helps you spot areas where price trends are likely to reverse. It marks these zones on your chart using a unique parallelogram shape, making it easier to find the best points to enter or exit trades. Whether you’re a beginner or experienced trader, this tool can help improve your trading decisions. Key Features: Accurate Reversal Detection: Identifies key zones where price may change direction. Dynamic Zone Adaptation: Zones adjust in real-time to follow market
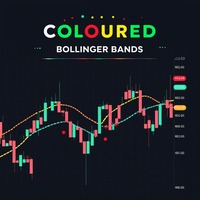
Coloured Bollinger Bands The Coloured Bollinger Bands indicator is an enhanced version of the standard Bollinger Bands, offering customizable features to suit your trading needs. It uses the classic Simple Moving Average (SMA) as the middle band, and allows you to easily change the appearance of the bands, including the option to select colors and line types, ensuring better visual clarity and adaptability on your charts
FREE

Are you a newbie who feels like trading is rocket science? Fear not! With our new Indicator, you’ll trade like a pro—without the awkward space suit!Say goodbye to the confusion and hello to profits! Now you can impress your friends with your "expert" trading skills—even if you just learned what a stock is! :money_mouth:Trade smart, not hard! Grab the Trade Wiz-A-Matic today and let’s launch your trading journey! Key Features: Dynamic Levels : The indicator calculates and plots key levels based o

The indicator plots levels based on an internal equation So that it automatically draws levels as soon as it is placed on the chart Levels can be used as supports and resistors So that entry is based on testing the level And close down or up, depending on the direction It is also an effective tool and help in making the right decision *There are two options in the settings 1. Zone A 2. zone B Where Zone A shows the levels starting from 123-369 The zone B shows the levels to start 693-96
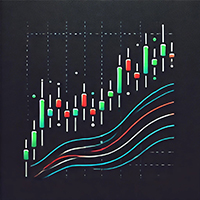
This is simple indicator for displaying Multi Moving Average line in chart, with one single Indicator. Just place the indicator in your chart, select how many MAs you want to display. And you are ready to go. Parameters can be changed on the fly by the control panel provided by the Indicator. This indicator are still in development, if you have any further feature request, please let me know in the comment.
FREE
The product has been removed from sale。 Sales suspended, do not download. 2025/1/28 The product has been removed from sale。 Sales suspended, do not download. 2025/1/28 产品已下架 产品已下架 The product has been removed from sale。Sales suspended, do not download. 2025/1/28 The product has been removed from sale。Sales suspended, do not download. 2025/1/28 产品已下架 产品已下架 The product has been removed from sale 产品已下架 The product has been removed from sale 产品已下架 The product has been removed from sale The product
MetaTrader Маркет предлагает каждому разработчику торговых программ простую и удобную площадку для их продажи.
Мы поможем вам с оформлением и подскажем, как подготовить описание продукта для Маркета. Все продаваемые через Маркет программы защищаются дополнительным шифрованием и могут запускаться только на компьютере покупателя. Незаконное копирование исключено.
Вы упускаете торговые возможности:
- Бесплатные приложения для трейдинга
- 8 000+ сигналов для копирования
- Экономические новости для анализа финансовых рынков
Регистрация
Вход
Если у вас нет учетной записи, зарегистрируйтесь
Для авторизации и пользования сайтом MQL5.com необходимо разрешить использование файлов Сookie.
Пожалуйста, включите в вашем браузере данную настройку, иначе вы не сможете авторизоваться.