Смотри обучающее видео по маркету на YouTube
Как купить торгового робота или индикатор
Запусти робота на
виртуальном хостинге
виртуальном хостинге
Протестируй индикатор/робота перед покупкой
Хочешь зарабатывать в Маркете?
Как подать продукт, чтобы его покупали
Новые технические индикаторы для MetaTrader 4 - 32
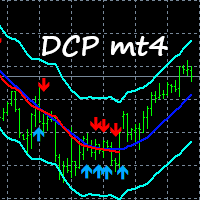
Use this indicator to help determine when to open buys or sells based on the slope and direction of the channel. Excellent for scalping. Settings: TrendPeriod. Deviation. ChannelPeriod. Features Alerts. How to use: Simply attach to any chart. To use on lower timeframes (M1,M5,M30), you'll need to start setting the Deviation from 0.01 and increase it if needed. If used on lower timeframes ( M1,M5,M30,H1), confirm on higher timeframes (H4,D,W) before entering trades. H1: Set Deviation to 0.5. H4:

** All Symbols x All Timeframes scan just by pressing scanner button ** *** Contact me after the purchase to send you instructions and add you in "Wolfe Wave Scanner group" for sharing or seeing experiences with other users. Introduction: A Wolfe Wave is created with five-wave patterns in price. It shows supply and demand and a fight towards a balance price. T hese waves of price actions can help traders identify the boundaries of the trend . Also It helps forecast how the price will move

FTU Idioteka Indikator prednaznachen dlya platformy MT4, yego mozhno ispol'zovat' otdel'no, no luchshe vsego sochetat' s drugimi indikatorami ili strategiyami. Sochetayet v sebe razlichnyye indikatory, takiye kak macd, adx, dlya risovaniya strelki, ukazyvayushchey na vkhod ili izmeneniye trenda. Posmotrite korotkoye vstupitel'noye video na YouTube: https://youtu.be/lCRJ3mFNyOQ Osobennosti indikatora: Prodat' i kupit' strelki Vizual'noye i zvukovoye opoveshcheniye Prodolzheniye trenda/ranniy sig
FREE

ФТУ Корвус Индикатор для платформы mt4, можно использовать исключительно для торговли, лучше всего сочетать с другими индикаторами. Разработан с использованием различных индикаторов, таких как macd и adx, для рисования стрелки, указывающей на вход или изменение тренда. Этот индикатор похож на FTU Idioteque — см. другие мои индикаторы, такие как FTU Predictor. Посмотрите короткое вступительное видео на YouTube: https://youtu.be/n_nBa1AFG0I Функции: Продать и купить стрелки Визуальное и звуковое
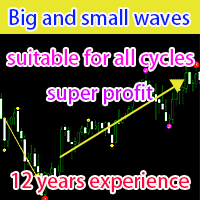
Это отличная система технических индикаторов, которая анализирует периодические восходящие или нисходящие торговые тенденции с малых, средних и больших аспектов.
Period1 в параметрах — малый период времени, Period2 — средний период времени, Period3 — большой период времени, small_symbol — идентификатор сигнала 1, middle_symbol — идентификатор сигнала 2, big_symbol — идентификатор сигнала 3 ;alert — переключатель кнопки предупреждения, Mail — переключатель отправки электронной почты, а Not

(Перевод Google) Стандартное представление свечи Heikin Ashi имеет значение открытия, эквивалентное экспоненциальному показателю. Скользящее среднее (EMA) от Общей цены , из которых альфа значение EMA является фиксированным с периодом 0,5 (эквивалентно периоду EMA 3,0). В этой динамической версии период может быть изменен на любое значение, которое вы хотите использовать, что также позволяет приблизительный анализ нескольких таймфреймов или используйте минимальное или максимальное значение в кач
FREE

CONGESTION BREAKOUT PRO
This indicator scans the breakout of congestion zones . This indicator unlike any other congestion indicator you will find in the market right now, it uses an advanced algorithm not peculiar to most traditional congestion indicators available today . The advanced algorithm used to define the congestions is greatly responsible for the high rate real congestion zones and low rate fake congestion zones spotted by this product.
UNDERSTANDING CONGESTION
Congestion are
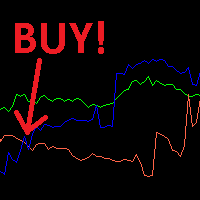
Готовая торговая стратегия для скальпинга. Когда синяя линия пересекает красную линию снизу вверх - открываем ордер на покупку. Когда красная линия пересекает синюю линию снизу вверх - открываем ордер на продажу. Период индикатора 14. Валютные пары: GBPUSD, EURUSD, XAUUSD, AUDUSD, USDJPY. USDCHF, USDCAD. Стоплосс ставим от 45 до 75 пунктов, в зависимости от валютной пары (нужно эксперементировать). ТейкПрофит ставим от 20 до 40 пунктов, в зависимости от валютной пары. Лучшее время для торговли с
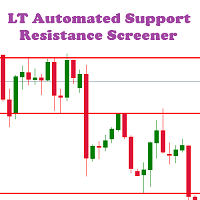
LT Automated Support Resistance Screener is a level indicator or a support resistance indicator that can be used to determine the level of support and resistance values. This indicator is free and easy to used in the Metatrader 4 platform which is built using the MQL4 programming language. Support resistance indicator is an important indicator that is often to used, but it is not available on the MT4 platform. This indicator can be used for all markets like forex, indices, gold etc and all time
FREE

Индикатор "Strategic scalping" отображает возможные точки разворота тренда на графике. Индикатор выделяет две различные точки разворота: верхние точки (точки разворота сверху) и нижние точки (точки разворота снизу). Верхние точки разворота обозначаются стрелками, направленными вниз, и появляются на графике, когда цена достигает максимума и начинает падать. Нижние точки разворота обозначаются стрелками, направленными вверх, и появляются на графике, когда цена достигает минимума и начинает расти.
Робот, который торгует по сигналам этого индикатора https://www.mql5.com/en/market/product/46338
Данный индикатор является высокочастотным и ориентирован на технический анализ ценовой динамики на рынке Forex в краткосрочном периоде. Скальпинговый подход, в рамках которого используется данный индикатор, направлен на быстрое выполнение сделок и получение небольших результатов на коротких временных интервалах. Индикатор базируется на анализе ценового графика и использует высокочувствительные мат
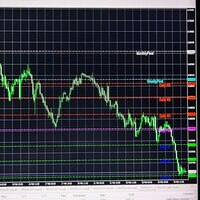
Этот индикатор разработан, чтобы помочь трейдерам идентифицировать опорные уровни на рынке. Некоторые люди также называют это уровнями или зонами поддержки и сопротивления. Наконец-то мы публикуем самый продвинутый пивот-индикатор на рынке mql5, потому что он разработан с использованием только точных пивот-зон. Помните, что всегда используйте более крупные таймфреймы, чтобы получить сильные опорные уровн и. Это

This dynamic indicator allows you to measure retracements of price between any two points in either direction. It displays the price points, percentages and also displays the extension levels.
User may Modify and Add addition levels and extensions." User may also Add multiple Fibonacci indicators on the chart and change their colors, style and sizes.
Can be used on any timeframe.
This is the only Fibonacci Tool you'll need to measure and trade on Structure.
MT5 Version Available as we
FREE

False Breakout Detector Detect new highs and new lows in price action. When the market tries to break these highs and lows but fails, the indicator places an arrow on the chart and sends out an alert.
Simple and easy to use Does not require strange configurations Works on all assets and time frames
------------------------------------------------------

Next Trend Pro INDICATOR - лучший трендовый индикатор на рынке, индикатор работает на всех таймфреймах и активах, индикатор построен на основе 12-летнего опыта работы на форексе и многих других рынках. Вы знаете, что многие индикаторы тренда в Интернете не совершенны, опаздывают и с ними трудно торговать, но индикатор Next Trend Pro отличается от всех, индикатор Next Trend Pro показывает сигнал на покупку или продажу, цветные свечи подтверждают сигнал, уровни поддержки и сопротивления придают ув
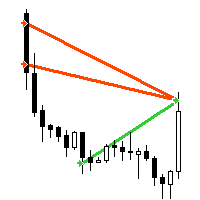
"AV Trade History" is an indicator for MetaTrader 4, which similar to the MetaTrader 5 "Trade History" or "Show trade history" setting, shows the closed trades in the chart. It also shows the orders history in the strategy tester, makes it easier to see them when testing expert advisors automated trading.
Improvements :
- Visibility is increased by line thickness and free choice of color.
- Additional information about the trade is visible when hovering over it, e.g. ticket, magic, co

'Circle Rising Point' is an indicator based on the cycle theory. No matter whether your trading cycle is short or long, you can use this indicator to find the rise and fall points of different cycles and different bands. Therefore, the signals displayed to you on charts of different cycles are different, and applicable to left side transactions. This indicator is recommended to be used together with the multi cycle window for analysis. Indicator introduction Applicable products This indicato
FREE

Engulfing candlestick patterns are comprised of two bars on a price chart. They are used to indicate a market reversal. The second candlestick will be much larger than the first, so that it completely covers or 'engulfs' the length of the previous bar.
By combining this with the ability to look at trend direction this indicator eliminates a lot of false signals that are normally generated if no overall trend is taken into consideration
FREE

Scalping Boss It is an oscillator with a programming where the golden line marks you buy or sell, is %100 for scalping , clearly it is accompanied by an rsi that also helps you capture the trend and rebounds, It works for all forex pairs, it works very well in the EUR/USD, USD/JPY pair works for any season It also works for the synthetic indices market. works very well in all pairs of VOLATILITY / JUMPS good profit, World Investor.
Buy Sell Signal It is an indicator specialized in capturing inputs in various temporalities, where in the square of the indicator it marks you with red or green (IN THE POINTS) giving you the entry trends be red Sell , be green BUY , It works very well in all pairs. It is a pearl of indicator since it marks entries at all points either scalping or long! in any temporality. from now to enjoy! good profit World Investor.

DigitalTrend is an indicator of bands and fractals at certain points that marks multiple entries buy and sell! somewhat similar to bolinger bands, but more advanced where when the candles go out of the band, and mark the points blue or red, the red dot marks buy, when it leaves the band, the blue dot marks sale when it leaves the band, perfect for scalping and lengths! works for all forex pairs and synthetic indices! from now to enjoy! good profit World Investor.
Unlike many other indicators including the moving average indicator, Pivot Point can be a leading indicator. In these systems, the price levels of the previous period are used to determine the critical points instead of relying on the current price performance. Such an approach provides a clear framework for traders to plan their trades in the best possible way.
You can use this method and its combination with the methods you want to build and use a powerful trading setup. MT5 version
Let us k

Spirit mt4 - это индикатор, который работает без перепрошивки, сигналы срабатывают после стрелки в начале следующей свечи Включает несколько индикаторов для уровней перекупленности и перепроданности. Работает с любой валютной парой: EUR/USD, AUD/USD и прочие . После покупки отправьте мне личное сообщение, и я вышлю вам настройки , которые я использую для этого индикатора. Подходит для торговли криптовалютами. Мне нравится больше торговать криптовалютой, потому я испол

green up = buy red down = sell with alerts! that's how easy it is. --this indicator follows trend --based on moving averages and rsi and macd and pivot points --good for scalping and intraday trading and daytrading --works for swing --recommended time frame is 15m or 5m contact me after purchase to receive a trading strategy with the indicator with another bonus indicator!
FREE

A percent graphic is a type of graph or chart used to represent data as a percentage of a whole. Percent graphics are often used to illustrate how a given set of data is distributed between different categories or how certain trends have changed over time. Percent graphics can be used to show the composition of a dow jones , or the performance of a company over a given period of time d1 percet w1 perncet m1 percent y1 percenty

This dynamic indicator will identify when Fast Moving Averages (EMA, SMA, or LW) cross Slow Moving Average lines on any timeframe and with any symbol.
When the moving averages cross and price close above or below the crossing, the User will receive an alert via pop-up, push, or email.
Choose any two Moving Averages to cross to receive an alert and the Indicator will also paint the Moving Average Lines and Arrows.
You can choose Exponential Moving Averages (EMA). Simple Moving Averages (SMA
Простой, но полезный индикатор для контроля волатильности при внутридневной торговле. Индикатор наносит на текущий график уровни средней волатильности (ATR) за указанное количество дней. На текущем торговом дне уровни динамические и перемещаются в зависимости от минимума и максимума цены текущего дня в режиме "реального времени". Во входных параметрах мы задаем: - количество дней для расчета и отрисовки уровней среднего АТР - цвет линий уровней среднего АТР - толщину линий уровней среднего АТР
FREE

A cycle is a recognizable price pattern or movement that occurs with some degree of regularity in a specific time period. The analysis of cycles shows us support and resistance that represent smart places to anticipate a reaction in the price of an asset, and therefore represent a basic tool in technical analysis. Cycle lengths are measured from trough to trough, the most stable portion of a cycle. The information you find on this page is useful to combine with Elliott wave analysis .

Pivots Points are price levels chartists can use to determine intraday support and resistance levels. Pivot Points use the previous days Open, High, and Low to calculate a Pivot Point for the current day. Using this Pivot Point as the base, three resistance and support levels are calculated and displayed above and below the Pivot Point. and below the Pivot Point.

A Market Profile is an intra-day charting technique (price vertical, time/activity horizontal) devised by J. Peter Steidlmayer, a trader at the Chicago Board of Trade (CBOT), ca 1959-1985. Steidlmayer was seeking a way to determine and to evaluate market value as it developed in the day time frame. The concept was to display price on a vertical axis against time on the horizontal, and the ensuing graphic generally is a bell shape--fatter at the middle prices, with activity trailing o

The best way to identify the target price is to identify the support and resistance points. The support and resistance (S&R) are specific price points on a chart expected to attract the maximum amount of either buying or selling. The support price is a price at which one can expect more buyers than sellers. Likewise, the resistance price is a price at which one can expect more sellers than buyers.

This is first public release of detector code entitled "Enhanced Instantaneous Cycle Period" for PSv4.0 I built many months ago. Be forewarned, this is not an indicator, this is a detector to be used by ADVANCED developers to build futuristic indicators in Pine. The origins of this script come from a document by Dr . John Ehlers entitled "SIGNAL ANALYSIS CONCEPTS". You may find this using the NSA's reverse search engine "goggles", as I call it. John Ehlers' MESA used this measurement to
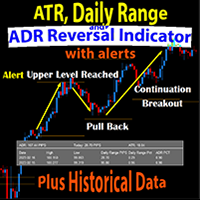
The Daily Range and ADR Reversal Indicator shows you where price is currently trading in relation to its normal average daily range. You will received alerts via pop-ups when price exceeds its average daily range. This alert is a signal for a potential pullback or reversal. This gives you an edge on identifying and trading pullbacks and reversals quickly.
The Indicator also shows you the Daily Range of Price for the current market session as well as previous market sessions. It shows you the A
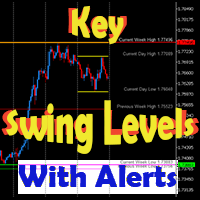
This dynamic indicator will draw the Key Swing High and Low Levels for any symbol on any timeframe!
User may Hide or Show any Level or Label and also Receive Alerts when price returns to that key level via Pop-Up, Push, Email or Sound.
Levels include Current Day High/Low, Previous Day High/Low, Current Week High/Low, Previous Week High/Low and Monthly High/Low.
The Key Levels are labeled with the Price Point Data Listed next to it for quick easy reference.
You can change the Style,

This indicator takes input from the ADX, and presents the output in a separate indicator window as a histogram. Great for scalping. Settings: ADXPeriod Features Alerts. How to use: Simply attach to any chart with default setting, or set the ADXPeriod to your preference. Zoom chart in to get a better view of the histo color. Buy: Blue histo color on multiple timeframes. (e.g., M30-H1-H4-D) Sell: Red histo color on multiple timeframes.
Or backtest and use as you see fit for your strategy. Best

This indicator takes input from the OBV and a trend filter, and presents the output in a separate indicator window as a histogram. Great for scalping. Settings: TrendPeriod Features Alerts. How to use: Simply attach to any chart with default setting, or set the TrendPeriod to your preference. Zoom chart in to get a better view of the histo color. Buy: Blue histo color on multiple timeframes. (e.g., M15-M30-H1-H4) Sell: Red histo color on multiple timeframes.
Or backtest and use as you see fi

Classical Divergence , Hidden Divergence both available . Enter a trade with the arrow on lower indicator. Nexus Divergence Pro is the best Divergence tool one can imagine with trade signals you will experience the super functionality. Needless to say how accurate divergence trading can be . Do your research on google you will understand its a standalone super accurate strategy.

Looking to take your forex trading to the next level? Look no further than my revolutionary forex indicator. Here are j many reasons why you should start using my indicator today: Easy to Use: With an intuitive interface and simple setup process, my forex indicator is easy for traders of all levels to use. Comprehensive Data Analysis: My forex indicator is backed by rigorous data analysis and machine learning algorithms, giving you a comprehensive view of the market. Real-Time Updates: Stay up-t

Supp & Resist Every Trader Need that an Indicator will show you zones for weak, Untested, Verified, Proven and Reversal Support and Resistance with smart calculation. take a look for the Screenshots there some explanations. i don't want to talk a lot :) try it by yourself for FREE because everything is clear in the inputs parameters. If you have any question feel free to ask me.

TELEGRAM ID > armanshayaan i did not upload main file here for security reason Life chaNge forever with forex
This Indicator is a Full Forex System with 96 to 98% accurate. It is the BEST and EASIEST, most PROFITABLE thing that you have ever seen. With this Indicator you have the Ability to look behind the Candles.
The System detect how much Volume is in the Market. It detects if big Players are in the market.Than you will get a Signal. So you have a MASSIVE ADVANTAGE ove

Индикатор TrendChangeZone отображает глобальные и локальные максимумы и минимумы цены на графике. Также индикатор показывает глобальный тренд на графике и коррекционные волны. Этот индикатор создан для определения направления и смены тренда. Самое главное, индикатор показывает зоны продолжения или разворота тренда. Незаменимый помощник в торговле. Индикатор не перерисовывается. Индикатор может работать на всех торговых инструментах.
Важно !!! Тренд верхний если 2 (два) и более синих отрезка п

Я добавил очень востребованный запрос на диаграмму следа. Индикатор очень простой и показывает объемы спроса и предложения. Это не сигнальный индикатор, он просто показывает объемы в свечах, а также отображает прошлые значения. Форекс не имеет централизованного объема, но он разбивается и показывает тиковый объем. Продажа свечей покажет аски, а покупка свечей покажет биды. Возможна торговля как в одиночной системе анализа, так и с другими факторами. Может быть ценной информацией, если кто-то на

Индикатор, отображает на одном графике две различных пары, предназначен для упрощения отображаемой информации, Способен работать практически со всеми доступными в терминале инструментами (не только валютными парами, но и металлами, сырьем). Особенность использования для визуального метода корреляции для любых валютных пар SubSymbol. Валютная пара выводится на экран цветными свечами. Это та самая коррелируемая пара. Mirroring. Вспомогательная валюта. Средствами индикатора отражается два тип
FREE

(перевод Google) Этот индикатор основан на оригинальном " Time Segmented Volume (TSV) ", разработанном Worden Brothers, Inc . Однако я добавил к этому несколько дополнительных функций. Можно выбрать цену, которая будет применяться, вместо того, чтобы использовать только цену закрытия по умолчанию, используемую оригиналом. Также можно выбрать, какое взвешивание по объему использовать, включая псевдообъемное взвешивание на основе истинного диапазона или вообще без взвешивания по объему. (Original
FREE

(Google Переводчик) Этот индикатор был вдохновлен средним истинным диапазоном (ATR) Джона Уэллса Уайлдера , но с некоторой дополнительной информацией. Точно так же он вычисляет экспоненциальное скользящее среднее истинного диапазона, но использует стандартный альфа-вес вместо Уайлдера . Он также вычисляет среднее отклонение от среднего диапазона и отображает его как смещение. Это помогает не только быстрее определить изменение, но и его влияние. (Original text) This indicator was inspired by Joh
FREE

(Перевод Google) Этот индикатор основан на оригинальном индикаторе ZigZag , предоставленном в качестве примера исходного кода при установке MetaTrader . Я переписал его, добавив некоторые дополнительные функции для отображения канала «глубины» и соответствующих прорывов. Это также позволяет наблюдать предыдущие точки зигзага. При необходимости он может предупреждать пользователя о прорывах. Оповещения могут быть просто на терминале или в виде push-уведомлений на мобильном устройстве с вашим собс

Стандартный индикатор Relative Strength Index (RSI) в который мы добавили функции оповещения на телефон и email. В настройках индикатора Вы можете указать верхнюю и нижнюю границы индикатора, при достижении которых индикатор будет отправлять Вам на телефон и email оповещение. Оповещение будет отправляться в формате: валютая пара + таймфрейм + время опоыещения. Если Вы применяете в своей торговой стратегии этот бесплатный стандартный индикатор, тогда Вам может быть полезна наша улучшенная версия

50% Off Today Only! Price Goes Back Up at 11 PM (EST)
uGenesys Volume Indicator: Your Key to Mastering Market Volume Analysis What Traders Are Saying: "A must-have indicator...really a game-changer." – wuzzy66 "Amazing indicator...strongly recommend to beginners." – joinbehar Understanding Market Volume: Volume in the market is a critical indicator of movement and opportunity. The uGenesys Volume Indicator is specially crafted to pinpoint when the market has the most volume, allowing you to

С помощью алгоритма форекс индикатора Impulses Enter, вы можете достаточно быстро понять, какая именно тенденция в данный момент развивается на рынке.Индикатор Elephant сопровождает длинные тренды, можно использовать без ограничений по инструментах или таймфреймах. При помощи этого индикатора можно пытатся прогнозировать будущие значения. Но основное применение индикатора заключается в генерации сигналов на покупку и продажу. Индикатор отслеживает рыночный тренд с игнорируя резкие колебания рын

Мы публикуем индикатор как полезный инструмент в трейдинге и называем этот индикатор "Швейцарский армейский нож" , потому что он предоставляет множество возможностей и комбинаций, помогающих понять материал по торговой системе "Masters of Risk" . Сам индикатор не входит в состав инструментов, используемых в торговой системе "Masters of Risk" .
Индикатор состоит из 3-х отдельных мультитаймфреймовых индикаторов, которые в сочетании друг с другом помогают уменьшить "шум" ложных сигналов. Первым

Трендовый индикатор Gibrid Trend используют для определения силы и направления тренда и нахождения точек разворота цены. Индикатор Gibrid Trend применяют на рынках форекс. Индикатор создан для того чтобы отображать тренд в наглядном виде. Одним из главных определений для мониторинга рынка валют является тренд.
Тренд может быть возрастающим (бычий тренд) и убывающий (медвежий тренд). В большинстве случаев тренд растёт долго и резко падает, но во всём бывают исключения. На движение цены могут

Устали подбирать настройки индикатора, теряя драгоценное время? Надоела неуверенность в их оптимальности? Пугает неизвестность в их прибыльности? Тогда индикатор Trend IM предназначен именно, для вас. Индикатор сэкономит вам уйму времени, которое можно будет потратить на более полезные занятия, например, на отдых, но при этом эффективность возрастет многократно. Использует всего один параметр для настройки, который задает количество баров для расчета.
Trend IM - индикатор разворота, является

Note : New in 1.6: the indicator now exports the trade signal (but not displayed). Go long with light blue. Go short with red. Exit otherwise. Signal to be imported to your EA using iCustom. This indicator provides Best of the Best linear filter momentum oscillators that I am aware of (Low Pass Differentiators, LPD's) . All of them are recent developments by this developer, or other researchers. The oscillator line is the first buffer of the indicator, and can be called in other indicators or
FREE
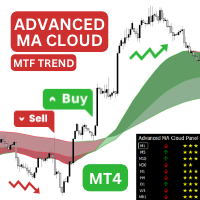
Introducing the Advanced MA Cloud indicator for MetaTrader 4 - a powerful indicator system that will help you identify potential buy and sell opportunities, as well as potential trend reversals. Advanced MA Cloud indicator is a great trend following indicator based on three fully customisable Moving Averages. In addition, t he indicator can also act as a support and resistance using the two clouds formed by the moving averages. Each moving average and each cloud changes its color according to

Trade History for MT4 This indicator is specially developed for that traders want to display his trades on the charts. Shows history and current deals on the chart. Trades show on the chart with a dotted line, and profit will show realtime. Buy trades are displayed in bull color, Sell trades in bear color.
Tip: The historical order displayed by the indicator is associated with the "Account History", so please set the historical order display in the "Account History" of MT software.
If yo
FREE

PURCHASE THIS INDICATOR AND GET OUR SECRET BONUS! Why is TREND Important? This is one of the biggest questions asked by beginner traders. Trend is important because that is primarily when the market moves the most. When a market has good volume, many banks, hedgefunds and large institutions are participating and driving price up or down in strong trends. THIS IS THE PERFECT TIME TO TRADE. The uGenesys Multi-Trend Indicator was specifically designed to identify when a trend has started in the ma

Индикатор Trend PT отслеживает рыночные тренды игнорируя резкие колебания и рыночный шум. Индикатор может работать как для точек входа, так и как фильтр.
Индикатор Trend PT отражает информацию в наглядном виде. Поможет в поиске точек входа при анализе. Подходит для торговли на малых таймфреймах, потому как он игнорирует внезапные скачки цен или коррекции ценового движения благодаря снижению рыночного шума вокруг среднего значения цены.
One of the basic needs of every trader is to have a checklist to enter every position. Of course, using pen and paper may not be convenient forever. With this indicator, you can have a small checklist next to the screen for each of your charts and use it for better use in your trades. MT5 Version This indicator will have many updates and special settings will be added to it.
You can contact us via Instagram, Telegram, WhatsApp, email or here. We are ready to answer you.
You can identify the strength of the main forex currencies with this tool. You can combine it with different styles and get the best strategy out of it. It has very high power. It can be customized.
MT5 version
This indicator will have many updates and special settings will be added to it.
You can contact us via Instagram, Telegram, WhatsApp, email or here. We are ready to answer you.

Индикатор тренда Trend Oracle, показывает сигналы для входа. Отображает как точки входа, так и сам тренд. Показывает статистически рассчитанные моменты для входа в рынок стрелками. При использовании индикатора можно оптимально распредилить коеффициент риска. Индикатор можно использовать как для пипсовкы на мелких периодах, так и для долгосрочной торговли. Использует все один параметр для настроек. Length - количеств баров для рассчета индикатора. Подбирая параметр необходимо визуально подобие т

Zone Buy Sell It is an indicator that is about input marks in different areas of the graph when it starts the brands in green, it marks the purchase area, When you mark the lines in red, you mark the sales area, It is used to scalp and long in h1 or h4 It is used in any temporality! works for forex markets! All pairs, It also works for synthetic index markets! no more to enjoy Good profit. World Investor

Rsi Versace It is an indicator programmed only for sales and purchases, It is very clear when the bearish wedge forms, it marks the entry with the change of color in red for the drop Also when it marks the bullish wedge it changes color to green when it is bought! used on all forex pairs also in synthetic indices! It works very well for volatility and forex pairs as well as gold! used at any time to scalp and long! To enjoy , good profit, World Investor
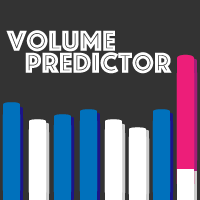
Volume predictor is an essential indicator if you trade with volumes, this indicator predicts the final volume of the current candle and increases it's precision as the time goes by. In order to predict the final volume the current volume and market conditions are used, the predicted volume adjust in real time. You can change every individual color of the indicator to your liking, the default colors were assigned to be easy on your eyes while using a dark theme. Don't forget to leave your revie

This indicator offers a unique perspective; it looks a lot like Envelopes but is totally different.
The default parameters are the same as I use in my strategies, every day and with all pairs, although each pair has its own characteristic.
By changing the parameters you can enter Fibonacci levels that you prefer, I use 0.5/1.0/1.5 which equals 50/100/150 .
NO-REPAINT unlike other similar indicators Hot Range does not redraw level lines, I use a simple strategy, when the 1.5 level is reach

MACD (short for Moving Average Convergence/Divergence) is one of the most famous and oldest indicators ever created and is widely used among beginners . However, there is a newer version of the MACD that is named Impulse MACD which have less false signals than the standard MACD. Classic MACD helps us to identify potential trends by displaying crossovers between two lines. If MACD line crosses above the Signal line it shows us that the market is potentially up trending and that it would be a go
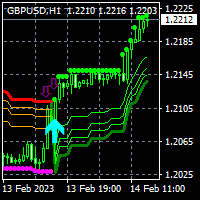
To get access to MT5 version please click here . This is the exact conversion from TradingView: "SwingArm ATR Trend Indicator" by " vsnfnd ". Also known as : "Blackflag FTS" by "Jose Azcarate" This is a light-load processing and non-repaint indicator. All input options are available except multi time frame Buffers are available for processing in EAs. Extra option to show buy and sell signal alerts. You can message in private chat for further changes you need.
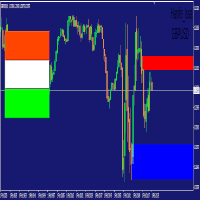
This indicator will draw you strong supply-demand level that we may see some reactions in the market. You can use it from H1 TO M5. Everything is set, you don't need to configure something, all you need is to wait for confirmation entry in lower timeframe like rejection at the zone, engulfing, break of structure... depends on your trading criteria. If the zone failed to hold and the zone is still on the chart, use again confirmation entry once the price came back. enjoys!!!
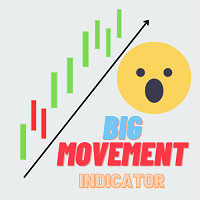
Big movement indicator is a very simple indicator which draws a pattern of boxes where price has moved significantly on a particular timeframe. It also displays the number of candles the strong movement is continuing till now. This indicator work based on zig zag indicator when there is a minimum gap between the last 2 zigzag values we draw a box around this. We can also capture the point where it meet the criteria as buffer values
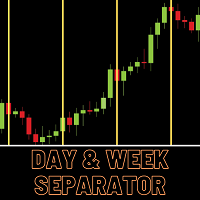
Day and Week separator is a very simple tool to show day and week separator lines from a specific time mentioned in the input. This is specially helpful for the trades who has time zone differences in their broker terminal. Let us take an example If user know that at 7:00 in the chart his local time 00:00 then he will simply put 7:00 in the input . Separator lines will starts drawing from current day's 7:00 There is also a bold line for weekly separator
FREE
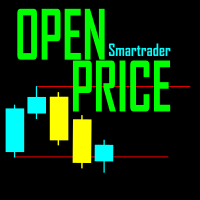
The ORB The Opening Range Breakout or the OPR 'Open Price Range' MT5 Indicator is a powerful tool designed to enhance your trading experience by automatically tracking market openings range , custom ranges, sessions, and Asian ranges. This dynamic indicator is perfect for price action traders, offering unparalleled precision and accuracy without any manual effort. Key Features: London ORB The Opening Range Breakout : Automatically displays the London open price range. New York ORB The Ope
Узнайте, как легко и просто купить торгового робота в MetaTrader AppStore - магазине приложений для платформы MetaTrader.
Платежная система MQL5.community позволяет проводить оплату с помощью PayPal, банковских карт и популярных платежных систем. Кроме того, настоятельно рекомендуем протестировать торгового робота перед покупкой, чтобы получить более полное представление о нем.
Вы упускаете торговые возможности:
- Бесплатные приложения для трейдинга
- 8 000+ сигналов для копирования
- Экономические новости для анализа финансовых рынков
Регистрация
Вход
Если у вас нет учетной записи, зарегистрируйтесь
Для авторизации и пользования сайтом MQL5.com необходимо разрешить использование файлов Сookie.
Пожалуйста, включите в вашем браузере данную настройку, иначе вы не сможете авторизоваться.