Смотри обучающее видео по маркету на YouTube
Как купить торгового робота или индикатор
Запусти робота на
виртуальном хостинге
виртуальном хостинге
Протестируй индикатор/робота перед покупкой
Хочешь зарабатывать в Маркете?
Как подать продукт, чтобы его покупали
Новые технические индикаторы для MetaTrader 4 - 26
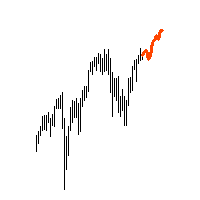
"AV Forecast" is a preview or forecast indicator for MetaTrader 4, which draws forecast future price changes on the chart from historical data. To do this, it primarily uses the everyday rhythm and the seasonality of the year. For timeframes below H1 closer dates can be selected. The lines for calculation can be made visible.
Settings:
- Draw line for x candles: draw x candles in the future
- Show all lines: yes/no
- Look back years or mixed (> H1 same): one year back or less beneath H

Индикатор тренда Shock Trend, показывает моменты для входа в рынок стрелками. Это гибридный индикатор, так как основывается на сигналах нескольких двух достаточно известных продуктов - индикатор среднего истинного диапазона, который определяет диапазон минимальных и максимальных ценовых колебаний, а также цен закрытия. В результате - указывает текущую рыночную волатильность. Также индикатор семейства осцилляторов. Индикатор помогает рассчитать уровни перепроданности и перекупленности торгового

Love Trend индикатор, показывающий области покупок и продаж. Индикатор следует за движением цены вокруг цены открытия. Он также отображает информацию о тренде, следующем за пробоем минимума и максимума. У индикатора очень простая, но эффективная графика: выше цены открытия отображается оранжевая точка цвет, ниже цены открытия - синяя. Индикатор включает также звуковое оповещение и всплывающее окно, оповещающие о закрытии свечи в этих важных уровнях. Индикатор позволит всегда быть в курсе тренда

The ICT Concepts indicator regroups core concepts highlighted by trader and educator "The Inner Circle Trader" (ICT) into an all-in-one toolkit. Features include Market Structure (MSS & BOS), Order Blocks, Imbalances, Buyside/Sellside Liquidity, Displacements, ICT Killzones, and New Week/Day Opening Gaps. It’s one kind of Smart money concepts. USAGE: Please read this document ! DETAILS Market Structure Market structure labels are constructed from price breaking a prior extreme

Форекс-индикатор "Search for a reversal" представляет собой технический инструмент, разработанный для трейдеров, занимающихся скальпингом на валютном рынке Форекс. Скальпинг - это стратегия торговли, которая направлена на получение небольших прибылей от частых сделок на краткосрочных временных интервалах. Индикатор "Search for a reversal" помогает трейдерам идентифицировать оптимальные точки входа и выхода из рынка, учитывая краткосрочные тренды и колебания цен.
Основная цель индикатора "Sear
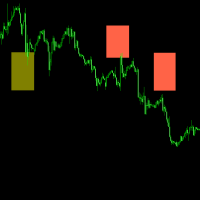
The indicator is very effective in currency exchange, for example EURUSD GBPUSD AUDUSD NZDUSD USDCHF USDCAD and it is very easy to identify the position of top and bottom. Suggest using it on the MT4 platform of SwissQuote Bank.
SwissQuote Link: https://trade.swissquote.ch/signup/public/form/full/fx/com/individual?lang=cn&partnerid=daf9af43-2f95-443e-86c5-89ce1ab2bd63#full/fx/com/individual/step1
Exness Link: https://one.exness.link/a/t2v0o2v0
With a little understanding of trading and the
FREE

This indicator is based the principle of breakout candle. Every candle that breaks out from the cluster may not lead to a rally. There are various factors that determine how a breakout candle will behave. This indicator calculates all those factors to suggest BUY/SELL signal once a breakout happens. This is a universal indicator that can work for all kind of instruments eg stock, currency, oil, crypto etc. This also works in every timeframe. PARAMETERS ================= move = 20 strongCandle =

Introducing the Gold Multiply Funds EA - a revolutionary trading tool that is based on the powerful principle of compounding. MT4 Version : https://www.mql5.com/en/market/product/90177
MT5 Version : https://www.mql5.com/en/market/product/95784
Brief description EA for XAUSUD: AI & machine learning detect/respond to market trends with precision. Trading Strategy Advanced pattern recognition using AI and Machine learning for profitable trades 65-70% correct prediction accuracy in 10
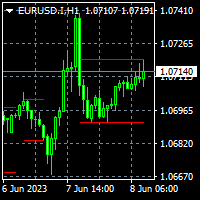
To get access to MT5 version please contact via private message. This indicator is not a standard indicator and you may get into trouble installing it. Please contact via private chat if you face trouble. This is exact conversion from TradingView: "Consolidation Zones - Live" by "LonesomeTheBlue". This is a light-load processing indicator. Updates are available only upon candle closure. Buffers are available for processing in EAs. It is a repaint indicator. So previous buffer values do not repre
Market screener: Spread and Swap, for selected Symbols. You can customize the list: set only the Symbols (currency pairs) that are needed. The number of Symbols is unlimited. The list can be sorted in ascending or descending order (Symbol name). The panel can be moved to any place on the chart. You can also minimize the panel. Displayed values: Current market price (BID); Spread size; Swap, for Long positions; Swap, for Short positions; Overall P/L of the entire account; My #1 Utility : includ

TrendXplorer indicator is designed to provide valuable insights into market trends, helping you navigate the dynamic world of trading with confidence. Key Features: Accurate Trend Analysis: TrendXplorer utilizes a special algorithm to analyze trends combined with price action. This enables easier trend detection and is less prone to change during price manipulation. Built-in Risk Calculator: Take control of your risk management with TrendXplorer's built-in risk calculator. This feature assesses

TruRange is a Next-Level trend and range detection created from algorithms based on price action. No other indicator apart from ATR is used in the computing of the main line indicator
It separates Trending and Ranging market conditions without any lag. It's good to separate mean reverting strategies from trending/breakout strategies.
Settings : Bars : number of bars to compute Sensitivity : a lower value will have longer range periods while a higer value will have more smaller ranging peri

Introducing Round Range 5, a versatile and dynamic indicator designed to optimize your trading strategies on MT4. Let's explore how this indicator can revolutionize your trading experience by adapting round number levels to suit the unique characteristics of each instrument.
In the fast-paced world of financial markets, round numbers play a crucial role. These price levels, ending with multiple zeros or other significant digits, often act as psychological barriers that influence market sentim
FREE

Dynamic Price Volatility Indicator (DPVI)
The Dynamic Price Volatility Indicator (DPVI) is designed to provide traders with valuable insights into market volatility and potential price movements. It combines elements of volatility analysis and trend identification to assist traders in making informed trading decisions.
Features: Dynamic Volatility Bands: utilizes a proprietary algorithm to calculate dynamic volatility bands that adjust in real-time based on market conditions. These bands act
FREE
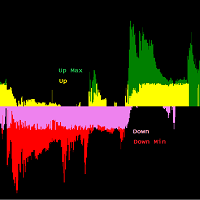
Trend Reversal Identifier es un indicador de análisis profundo que no repinta de alto rendimiento que sirve para detectar y confirmar Pullbacks, Soportes y Resistencias. También posee un alto valor para detectar divergencias al tener los movimientos alcista y bajistas dados por separado con mucha claridad. Debido a la estructura implícita del algoritmo es plenamente válido para cualquier par/periodo y no necesita configuración. Tenemos dos zonas principales: Zona Up y Zona Down, las cuales a s

Currency Strength Wizard — очень мощный индикатор, предоставляющий вам комплексное решение для успешной торговли. Индикатор рассчитывает силу той или иной форекс-пары, используя данные всех валют на нескольких тайм фреймах. Эти данные представлены в виде простых в использовании индексов валют и линий силы валют, которые вы можете использовать, чтобы увидеть силу той или иной валюты. Все, что вам нужно, это прикрепить индикатор к графику, на котором вы хотите торговать, и индикатор покажет вам ре
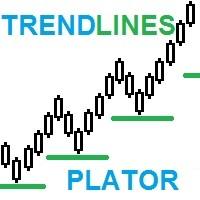
TrendLines Plator: Улучшите свои торговые стратегии с помощью передового индикатора прогнозирования трендов Исследуйте потенциал нашего инновационного индикатора! Способность анализировать и прогнозировать трендовые линии с более широких временных интервалов прямо на вашем текущем временном графике создает стратегическую поддержку, которая привлекает внимание трейдеров. Эти точки становятся стратегическими уровнями поддержки или сопротивления для ваших операций, укрепляя вашу торговую стратегию.

Tendenceris - Индикатор тренда для MT4 Усилите свою торговлю с помощью Tendenceris ! Этот невероятный индикатор для MetaTrader 4 показывает вам тренды в режиме реального времени на разных таймфреймах. Не упустите ни одной возможности для торговли! Основные возможности: Определение и визуализация трендов на разных таймфреймах, от 1 минуты до 1 дня . Интуитивно понятный и простой интерфейс, который предоставляет четкую и конкретную информацию на графике. Обновление в режиме реального времени, чтоб
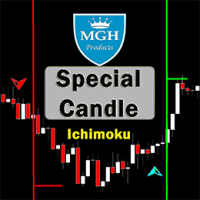
Вела Эспециал
Вы бы хотели использовать один из лучших индикаторов валютного обмена, основанный на стратегии Ишимоку, которая является очень успешной? Вы можете использовать отличный индикатор, основанный на стратегии Ишимоку.
Версия MT5 доступна здесь .
Первая стратегия:
Эта стратегия включает в себя выявление похожих и редких, но мощных пересечений.
Самые подходящие временные интервалы для этой стратегии - 30 минут (30M) и 1 час (H1).
Подходящие символы для графика 30 минут:
• CAD/JPY

Представляем индикатор Hull Crossover Alert для MT4, мощный инструмент, предназначенный для улучшения ваших торговых решений. Этот индикатор использует Hull Moving Average (HMA) и включает в себя расширенные функции для фильтрации ложных сигналов и предоставления быстрых и надежных предупреждений.
С помощью индикатора Hull Crossover Alert вы можете воспользоваться уникальными характеристиками скользящей средней корпуса. Его чувствительность к изменениям цен и плавная кривая помогают

Pips forex - готовая торговая система . Этот индикатор показывает стрелками на графике когда и в каком направлении нужно открывать ордер. Если зеленая стрелка, значит открываем сделку на покупку, а если красная стрелка, значит открываем сделку на продажу. Все очень просто и достаточно эффективно. ТейкПрофит ставим 15-25 пунктов. СтопЛосс ставим на уровне точек. Когда точки передвигаются, мы сразу передкигаем СтопЛосс. Рекомендуемый таймфрейм для торговли М1 и М5. Это скальпинговая стратегия и он
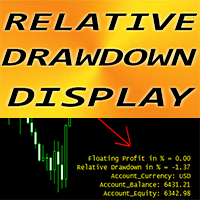
Forex Indicator "Relative Drawdown Display" for MT4 , Trading Support tool. This is MUST HAVE indicator for traders who use grid trading systems !!! Relative Drawdown Display indicator shows current Relative DD or Floating Profit in % on your account. PC and Mobile Alerts are built-in with adjustable Trigger level Indicator also indicates account Balance and Equity It is possible to locate indicator values in any corner of the chart : 0 - for top-left corner, 1 - top-right, 2 - bottom-le
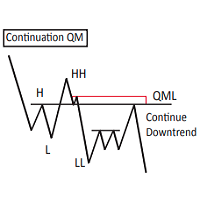
Custom Mapping Tool by Shredderline is an innovative MT4 indicator that simplifies the process of marking and mapping charts. With this tool, you no longer have to waste time rewriting repetitive words, rectangles, and trendline colors every time. New Feature V5.60:
Draw path - Same as the TV Path drawing mode, which is very useful for naked chart trader. You can draw zigzag, draw your patterns manually. Change style in indicator setting. Crop function disabled by default. Can be enabled and s
FREE

Представляем вам индикатор Donchian Channels для MQL4 — мощный инструмент технического анализа, разработанный для повышения вашей торговой успешности. Этот индикатор состоит из четырех линий, которые представляют верхние и нижние границы ценового движения за определенный период. С помощью индикатора Donchian Channels вы легко сможете определить потенциальные прорывы и развороты на рынке. Верхняя линия показывает наивысший пик за указанный период, а нижняя линия представляет наименьший минимум. П
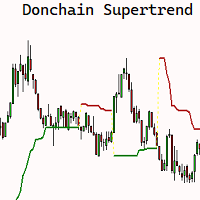
The SuperChannel indicator for MQL4 is a POWERFUL technical analysis tool designed to help you make informed trading decisions. BASED ON the popular SUPERTREND indicator, this indicator offers a UNIQUE approach Using HIGHS and LOWS over an n-period instead of the Average True Range (ATR) to construct the line. The SuperChannel indicator allows you to easily identify market trends and pinpoint optimal entry and exit points for your trades. By using historical highs and lows, the indicator plots a

Чрезвычайно удобный индикатор, воистину делающий легким процесс заработка денег на бирже. Основан на разработанной автором научно-строгой теории рынка, начало которой представлено здесь . Полный алгоритм работы данного индикатора представлен в статье . Индикатор рассчитывает наиболее вероятную траекторию движения цены и отображает это на графике. Из прогнозируемой траектории движения цены индикатор рассчитывает направление позиции

Индикатор MAtrio, отображает на любом таймфрейме сразу три скользящих средних с периодом 50 -дневная ,100 -дневная , 200 -дневная . После присоединения к графику сразу отображает три скользящих средних с параметрами простой (SMA) скользящей средней SmoothingType50 , простой (SMA) скользящей средней SmoothingType100, простой (SMA) скользящей средней SmoothingType200. Соответственно с типом цены ValuePrices50, ValuePrices100, ValuePrices200 по умолчанию везде стоит цена Close price .
FREE

"TOP G ARROWS" shows price reversal points designed for scalping and intraday trading.
Contains internal reversal filters (ATR, HHLL, RSI). Can be used on all time frames and trading instruments. Can be used on M1, M5, M15 time frames for scalping or M30, H1, H4 for intraday trading, Recommended for M30 and H1. The arrows are built on candle close (appears on previous bar at the open of the new candle)

*This is tradingview bot converted to mql4*
The UT Bot Alert Indicator is an advanced technical analysis tool designed to help traders optimize their trading performance. This innovative indicator is based on the proven UT Bot system, which utilizes multiple indicators to deliver accurate signals that can help traders make better decisions. The UT Bot Alert Indicator provides a range of features that can help you stay on top of market trends and capitalize on opportunities. Here are some of i
FREE

If you have been anywhere near Forex forums or social media lately, you have no doubt been hearing people talk about Smart Money Concepts (SMC) trading. You may be wondering what SMC is, and whether it deserves all the hype. In this post, we will introduce Smart Money Concepts trading to you so you can make an informed decision about whether or not to give this strategy a try in your own trading. What is SMC Forex trading? Smart Money Concepts (SMC) is one of many forex trading methods. SMC

The indicator has been designed to function on any time-frame and any pair. This regime filter will help the trader better evaluate whether the current market is trending, and in which direction. It quickly reacts to changes in market dynamics using a series of advanced calculations. The user is able to select whether the calculation remains standard, or if a further filter constraint is added to the calculation. A Yellow moving average of the signal has been included for the trader to smoot
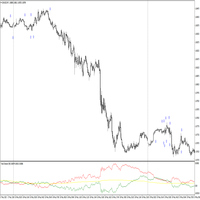
The indicator has been designed to function on any time-frame and any pair, although it is best suited for 5-minute charts. This trend filter will help the trader better evaluate whether the current market is trending, and in which direction. A dynamic filter threshold has been added to help the trader avoid choppy market conditions, and add greater confidence when entering, with an added functionality of plotting signal arrows on the chart to aid in detecting possibly entries. The Yellow in
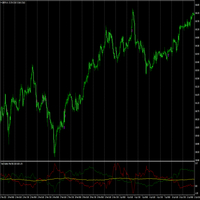
The indicator has been designed to function on any time-frame and any pair, although it is best suited for currency pairs on 5-minute charts, and used in conjunction with the Trend Direction Filter Indicator . This trend volatility filter will help the trader better evaluate whether the current market is trending, and in which direction. A dynamic filter threshold has been added to help the trader avoid choppy market conditions, and add greater confidence when entering, with an added functiona
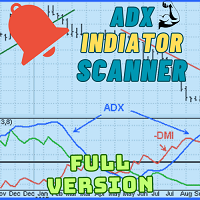
Welcome to advanced trading with the ADX Multicurrency Scanner! Elevate your trading experience with our powerful MT4 indicator, designed for seamless currency scanning and real-time insights. Key Features: Effortless Multicurrency Scanning: Unlock the full potential of the ADX Multicurrency Scanner by effortlessly scanning multiple currencies. Receive instant alerts when specific conditions are met, ensuring you stay ahead of the market and capitalize on every trading opportunity. Comprehensiv

Unleash the Power of Repetitive Market Price Levels (Markets often repeat structure ).
Are you tired of guessing the crucial support and resistance levels in your trading strategy? Do you want to enhance your decision-making process with reliable and accurate market insights? Look no further! We proudly present the interactive digital product designed to transform your trading experience – the Ultimate Support and Resistance Zones Indicator.
Unlock the Potential of Critically Watched Sup
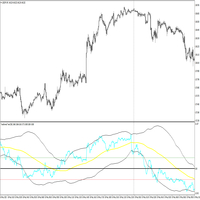
The indicator has been designed to function on any time-frame and any pair, although it is best suited for 5-minute charts. This price transformation will help the trader better evaluate whether the current market is trending, and in which direction. A dynamic filter has been added to help the trader avoid possibly entering against the trend. Two filter threshold lines may enable the trader to avoid choppy or flat market conditions. The Yellow indicator line is the filter and the Blue indica

Welcome to the world of advanced trading with the RSI Multicurrency Scanner! Maximize your trading experience with our powerful MT4 indicator designed for seamless analysis and real-time insights. Key Features: Effortless RSI Scanning: Unlock the full potential of the RSI Multicurrency Scanner by effortlessly scanning multiple currency pairs. Receive instant alerts when specific Relative Strength Index (RSI) conditions are met, ensuring you stay ahead of market movements. Comprehensive Dashboar
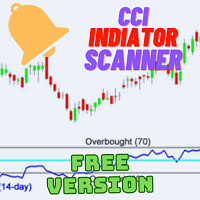
Introduction: Welcome to the world of advanced trading tools! Introducing the CCI Multicurrency Scanner, an exceptional MT4 indicator designed to revolutionize your trading experience. With its powerful features and comprehensive insights, this tool will empower you to make informed decisions and maximize your profitability. Features: Efficient Multicurrency Scanning: Our CCI Multicurrency Scanner swiftly scans multiple currencies based on your inputs. Receive instant alerts when specific condit
FREE
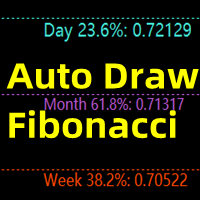
This indicator is mainly used to analyze future support and resistance levels for better trade analysis.
If the support level is effectively supported for many times, the market will break through the previous high point, and the effective trend breakout will be long.
After the down, the market cannot overshoot the pressure level for many times, and then goes down and breaks through the previous low price again, and the effective trend breaks through the short position.
When the marke

Thanks to this indicator, you can easily see the new ABCD harmonic patterns in the chart.
If the two price action lengths are equal, the system will give you a signal when it reaches the specified level.
You can set the limits as you wish. For example, You can get the signal of the price, which occurs in the Fibonaci 38.2 and 88.6 retracements, and then moves for the same length, at the level you specify. For example, it will alarm you when the price reaches 80% as a percentage.
In vertic
Welcome to the world of advanced trading with the Parabolic SAR Scanner Full! Maximize your trading experience with our powerful MT4 indicator designed for seamless analysis and real-time insights. Key Features: Effortless Parabolic SAR Scanning: Unlock the full potential of the Parabolic SAR Scanner Full by effortlessly scanning multiple currency pairs. Receive instant alerts when specific Parabolic SAR conditions are met, ensuring you stay ahead of market movements. Comprehensive Dashboard In
Welcome to the world of advanced trading with the CCI Multicurrency Scanner! Elevate your trading experience with our powerful MT4 indicator designed for seamless analysis and real-time insights. Key Features: Effortless CCI Scanning: Unlock the full potential of the CCI Multicurrency Scanner by effortlessly scanning multiple currency pairs. Receive instant alerts when specific Commodity Channel Index (CCI) conditions are met, ensuring you stay ahead of market movements. Comprehensive Dashboard

The Time Segmented Volume (TSV) is a technical indicator that measures the volume of a financial instrument within specific time segments. It helps traders identify buying and selling pressure based on volume analysis. The TSV indicator can be used as part of a trading strategy to generate trade signals and confirm market trends. Let's explore how to use the TSV indicator as a trading strategy. To begin, add the TSV indicator to your trading platform. The TSV is typically represented as a line o

The Chaikin Oscillator is a technical indicator developed by Marc Chaikin that combines price and volume data to measure the accumulation and distribution of a financial instrument. It aims to identify potential buying and selling opportunities in the market. The Chaikin Oscillator is calculated by subtracting a 10-day exponential moving average of the Accumulation Distribution Line (ADL) from a 3-day exponential moving average of the ADL. Here's how to use the Chaikin Oscillator indicator in tr

Indicator show best signals for buy and sell orders. Indicator uses only 2 inputs: DEMA Fast Period - fast double exponential moving average period DEMA Slow Period - slow double exponential moving average period Crossings of fast and slow double double exponential moving averages shows buy and sell signals, which are drawn as green and magenta arrows respectively.

Indicator show best signals for buy and sell orders. Indicator uses only 3 inputs: DEMA Fast Period - fast double exponential moving average period DEMA Slow Period - slow double exponential moving average period DEMA Trend Period - trend double exponential moving average period
Position of price according to trend double double exponential moving average and crossings of fast and slow double double exponential moving averages shows buy and sell signals, which are drawn as gree

Indicator show best signals for buy and sell orders. Indicator uses only 2 inputs: PEMA Bounce Period - bounce percentage exponential moving average period PEMA Confirm Period - confirm percentage exponential moving average period Positions of price according to bounce and confirm percentage exponential moving averages and directions of bounce and confirm percentage exponential moving average shows buy and sell signals, which are drawn as green and magenta arrows respectively.
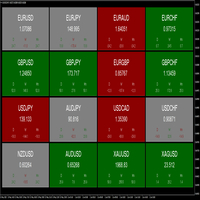
The dashboard indicator has been designed to quickly show the trader the price movements of various currency pairs. The user is able to select 3 different timeframes to analyse. When the pip difference for each respective timeframe is either positive or negative, the pair block will be coloured green or red respectively. This allows the trader to view which timeframes are in agreement, as well as the pip movements therein. A good visual tool to view multiple pairs and timeframes at once. T
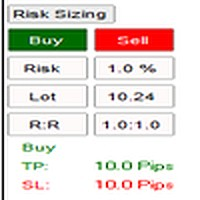
The indicator has been designed to function on any time-frame and any pair. The user is able to input their desired risk percentage per trade based on their account size, and choose whether they wish to calculate risk based on a limit order or market order. When initialised, a non-invasive button will appear on the left-hand side of the chart. Upon selection, a drop down will appear with a Buy and Sell button, these will in turn place movable lines on the chart that are used to appropriately
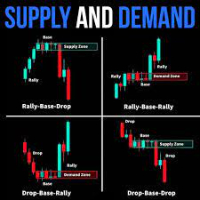
indicators included supply and demand indicator Specification Buy trade A SUPPORT zone (or immediately forms above the support zone) if the candle sticks are below either the middle or the lower band NO BUY TRADE IN THE RESISTANCE ZONE (RED HIGHLIGHTED ZONE), Sell trade A RESISTANCE zone (or immediately forms below the resistance zone) if the candle sticks are above either the middle or the upper band NO SELL TRADE IN THE SUPPORT ZONE (GREEN HIGHLIGHTED ZONE), In the supply zone, the prices are
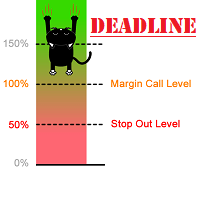
The indicator can display Stop Out, Free Margin and Margin Call lines on the chart. Y ou can also set your own line at the custom level.
Displaying these lines on the chart is especially useful for people who trade with high leverage or go all-in, where the risk is very high. You can adjust the line color, style, thickness and visibility ( for each one separately). The last parameter that can be changed is the refresh interval. If you have open orders on several stocks, the line levels will c

Discover PM - Your Ultimate Precision Forex Indicator for Informed Trading Decisions! In the fast-paced and ever-changing world of Forex trading, having a reliable and accurate indicator can make all the difference between success and missed opportunities. Say hello to PM, the revolutionary Precision Momentum indicator, engineered to empower traders with unparalleled insights into market dynamics, volatility, and trends. At the heart of PM's power lies its ability to precisely identify moments
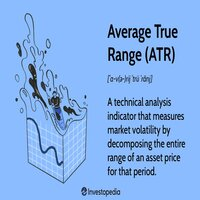
The "Wilder's Average True Range (ATR)" tool is used to measure the volatility of a financial instrument. It was developed by J. Welles Wilder Jr. and is commonly used by traders to assess the potential price range and volatility of an asset. The ATR indicator provides valuable information for setting stop loss levels, determining position sizes, and identifying potential breakouts. Here's how to use the "Wilder's Average True Range (ATR)" tool: Install the indicator: Add the ATR indicator to yo

Представляем Quantum Breakout PRO , новаторский индикатор MQL5, который меняет ваш способ торговли в зонах прорыва! Разработанная командой опытных трейдеров с опытом торговли более 13 лет, Quantum Breakout PRO предназначена для того, чтобы вывести ваше торговое путешествие на новые высоты благодаря своей инновационной и динамичной стратегии зон прорыва.
Quantum Breakout Indicator покажет вам сигнальные стрелки на зонах прорыва с 5 целевыми зонами прибыли и предложением стоп-лос

Ловец трендов:
Стратегия Ловец трендов с индикатором оповещения - это универсальный инструмент технического анализа, который помогает трейдерам определять рыночные тренды и потенциальные точки входа и выхода. Он представляет собой динамичную стратегию Ловец трендов, адаптирующуюся к рыночным условиям для четкого визуального представления направления тренда. Трейдеры могут настраивать параметры в соответствии со своими предпочтениями и уровнем риска. Индикатор помогает в идентификации тренда,
FREE
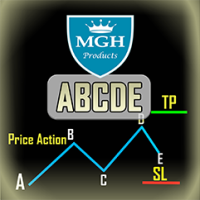
Индикатор ABCDE
Этот индикатор основан на первичных abc-шаблонах ценового движения (то есть прорыв, откат, движение). Эти шаблоны напоминают шаблон ралли-основание-ралли, и для выдачи точного сигнала проверяются такие анализы, как анализ тренда и анализ расхождения. Он обеспечивает достаточно точные торговые сигналы и сообщает вам, когда лучше открывать и закрывать сделки. Он может быть применен к любому финансовому активу: форекс, криптовалюты, металлы, акции, индексы.
Основные возможности

The Breaker Blocks with Signals indicator aims to highlight a complete methodology based on breaker blocks. Breakout signals between the price and breaker blocks are highlighted and premium/discount swing levels are included to provide potential take profit/stop loss levels.
This script also includes alerts for each signal highlighted.
SETTINGS
Breaker Blocks
Length: Sensitivity of the detected swings used to construct breaker blocks. Higher values will return longer te

Was: $69 Now: $34 Blahtech VWAP - Volume Weighted Average Price (VWAP) is the ratio of price to total volume. It provides an average price over a specified time interval. Links [ Install | Update | Documentation ] Feature Highlights
Configurable VWAP Line Sessions, intervals, anchored or continuous Previous day settlement line Standard Deviation bands Alerts at bar close or real time Automatic Broker or Tick volumes Significantly reduced CPU usage
Input Parameters
Expert Advis

Urgent reminder> Only 13 copies remaining for the price to double on all renting options. Get your copy Today!
Introduction Dear Traders, I am always working to come up with tools that may help you to become a better trader and investor. Due to my experience in trading and market analysis and trading software design and development, I am glad to introduce to you my other tool called " Amazing Entries Indicator ". The Indicator is designed in a way that it combines different strategy to provide

Сглаженный осциллятор основанный на базовых индикаторах DeMarker. Показывает изменчивость направления цены. Может применяться для определении внутридневных точек входа и выхода из рынка.
Подходит для использования на всех тайм-фреймах и торговых инструментах. Рекомендуется использовать На M5, M15 и M30.
Зеленая линия показывает направление цены вверх, синяя линия показывает направление цены вниз. Красная линия сглаженное представление цены.
Входные параметры
Period - Период основного инди
FREE

Стандартный индикатор RSI хороший помощник в определении зон "перекупленности" или "перепроданности" во время флета , но дает много ложных сигналов, когда на рынке тренд. Например: при тренде вверх, стандартный индикатор часто заходит в зону "перепроданности" и крайне редко (чаще всего когда тренд уже заканчивается) заходит в зону " перекупленности". Данный индикатор учитывает трендовое движение и при подобранных настройках может заходить в зону противоположной направлению тренда, давая сигнал
FREE

Здесь все очень просто. Никогда не понимал индикаторы без внешних параметров. И Awesome Oscillator не исключение. Теперь вы можете настраивать этот индикатор под свои потребности и стратегии. Справка: Индикатор Awesome Oscillator показывает расстояние в пунктах между двумя скользящими средними (быстрой и медленной). Индикатор AO_Robex имеет в параметрах изменение периода скользящих средних.
FREE

Популярный сигнальный индикатор отмечающий точки покупки/продажи. В данной версии дополнен точками оптимального SL. Рекомендуется к применению совместно с индикатором тренда, для фильтрации сигналов. Индикатор имеет лишь один настраиваемый параметр, определяющий его чувствительность, что сильно упрощает настройку индикатора к текущему рынку и стилю торговли пользователя. Сигналы индикатора подаются только после полного формирования бара. Индикатор может быть использован для торговли на любом ры
FREE
Данный индикатор идентифицирует смену тренда ориентируясь по точкам преодоления индикатором WPR уровней перекупленности и перепроданности. Индикатор не перерисовывается. Данный индикатор:
Подходит для любых рынков; Не перерисовывается; Интуитивно понятен и прост; Может быть полезен как новичкам так и опытным трейдерам; Позволяет идентифицировать точки входа в рынок, где высока вероятность значительного движения цены, достаточного для результативной сделки; Настройки: Ind_Period (>1) - период
FREE
Данный индикатор идентифицирует смену тренда ориентируясь по точкам преодоления индикатором RSI уровней перекупленности и перепроданности. Индикатор не перерисовывается. Данный индикатор:
Подходит для любых рынков; Не перерисовывается; Интуитивно понятен и прост; Может быть полезен как новичкам так и опытным трейдерам; Позволяет идентифицировать точки входа в рынок, где высока вероятность значительного движения цены, достаточного для результативной сделки; Настройки: Ind_Period (>1) - период
FREE
Индикатор определяет точки входа в рынок, основываясь на данных индикатора Stochastic. Пересечение индикатором нулевой линии свидетельствует о смене тенденции. Если значение осциллятора равно 1.5- цена растет, тенденция сохраняется; Если значение осциллятора равно 0.5 - цена растет, тенденция отсутствует; Если значение осциллятора равно -1.5 - цена падает, тенденция сохраняется; Если значение осциллятора равно -0.5 - цена падает, тенденция отсутствует; Оптимальным моментом входа является преодо
FREE
Индикатор отображает в виде гистограммы разницу текущей цены с ценой за предыдущий период. Подобный метод анализа рынка используется в классическом индикаторе Momentum. В то же время, представленный индикатор использует первичное сглаживание данных фильтром Laguerre, что позволяет сохранить чувствительность индикатора и минимизировать "шум". Сигналами индикатора являются: Пересечение гистограммой 0. Смена направления сигнальной линии.
FREE
Данный индикатор идентифицирует смену тренда ориентируясь по точкам преодоления индикатором CCI уровней перекупленности и перепроданности. Данный индикатор: Подходит для любых рынков; Не перерисовывается; Интуитивно понятен и прост; Может быть полезен как новичкам так и опытным трейдерам; Позволяет идентифицировать точки входа в рынок, где высока вероятность значительного движения цены, достаточного для результативной сделки; Настройки: Ind_Period (>1) - период индикатора; Price - цена для р
FREE

Стандартный индикатор RSI хороший помощник в определении зон "перекупленности" или "перепроданности" во время флета , но дает много ложных сигналов, когда на рынке тренд. Например: при тренде вверх, стандартный индикатор часто заходит в зону "перепроданности" и крайне редко (чаще всего когда тренд уже заканчивается) заходит в зону " перекупленности". Данный индикатор учитывает трендовое движение и при подобранных настройках может заходить в зону противоположной направлению тренда, давая сигнал

*This is TradingView indicator converted to mql4*
The SuperTrend V indicator is a popular technical analysis tool used to identify trends and potential trend reversals in financial markets. It is based on the concept of the SuperTrend indicator but incorporates additional features and variations. The SuperTrend V indicator uses a combination of price action and volatility to determine the trend direction and generate trading signals. Here are the key components and features of the indicator:
FREE
MetaTrader Маркет - уникальная площадка по продаже роботов и технических индикаторов, не имеющая аналогов.
Памятка пользователя MQL5.community расскажет вам и о других возможностях, доступных трейдерам только у нас: копирование торговых сигналов, заказ программ для фрилансеров, автоматические расчеты через платежную систему, аренда вычислительных мощностей в MQL5 Cloud Network.
Вы упускаете торговые возможности:
- Бесплатные приложения для трейдинга
- 8 000+ сигналов для копирования
- Экономические новости для анализа финансовых рынков
Регистрация
Вход
Если у вас нет учетной записи, зарегистрируйтесь
Для авторизации и пользования сайтом MQL5.com необходимо разрешить использование файлов Сookie.
Пожалуйста, включите в вашем браузере данную настройку, иначе вы не сможете авторизоваться.