Смотри обучающее видео по маркету на YouTube
Как купить торгового робота или индикатор
Запусти робота на
виртуальном хостинге
виртуальном хостинге
Протестируй индикатор/робота перед покупкой
Хочешь зарабатывать в Маркете?
Как подать продукт, чтобы его покупали
Новые технические индикаторы для MetaTrader 4 - 16

note: this indicator is for METATRADER4, if you want the version for METATRADER5 this is the link: https://www.mql5.com/it/market/product/108106 TRENDMAESTRO ver 2.4 TRENDMAESTRO recognizes a new TREND in the bud, he never makes mistakes. The certainty of identifying a new TREND is priceless. DESCRIPTION TRENDMAESTRO identifies a new TREND in the bud, this indicator examines the volatility, volumes and momentum to identify the moment in which there is an explosion of one or more of these data a

- Real price is 80$ - 50% Discount ( It is 39$ now ) Contact me for instruction, any questions! Introduction The breakout and retest strategy is traded support and resistance levels. it involves price breaking through a previous level. The break and retest strategy is designed to help traders do two main things, the first is to avoid false breakouts. Many false breakouts start with a candlestick that breaks out of a level but ends with an immediate candlestick that brings the price back into t

ЭНИГМЕРА: ядро рынка https://www.enigmera.com
Введение Этот индикатор и торговая система представляют собой удивительный подход к финансовым рынкам. ENIGMERA использует фрактальные циклы для точного расчета уровней поддержки и сопротивления. Он показывает подлинную фазу накопления и дает направление и цели. Система, которая работает независимо от того, находимся ли мы в тренде или в коррекции.
Как она работает? ENIGMERA состоит из трех линий: линии поддержки/сопротивления, линии цели и ли
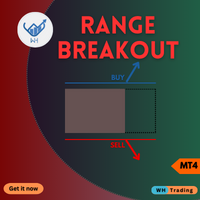
ткройте новое измерение торговли с нашим передовым индикатором MQL4 Range BreakOut MT4.
Этот мощный инструмент предназначен для выявления и извлечения выгоды из движений цен, когда они выходят за пределы установленных диапазонов.
предоставляя вам точность и уверенность, необходимые для процветания в динамичном мире финансовых рынков.
Версия MT5 : WH Range BreakOut MT5
Функции:
Точное определение диапазона. Сигналы прорыва в реальном времени. Настраиваемые параметры. Инструменты у
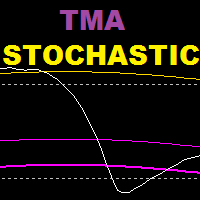
TMA Stochastic — это индикатор, основанный на стохастическом осцилляторе и индикаторе полос tma. Этот индикатор основан на разворотной стратегии.
Рекомендуемый временной интервал: 15 лет и старше.
Рекомендуемые настройки: более низкие значения для скальпинга, более высокие значения для свинг-трейдинга.
=============================================== =====================
Параметры:
История tma: сколько баров назад, чтобы показать полосы tma на стохастике
Период К (Стохастик)
Перио
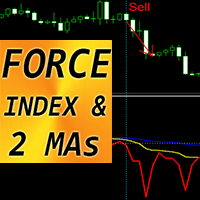
Forex Indicator "FORCE index and 2 Moving Averages" for MT4 This indicator is excellent for Momentum trading into the trend direction. " FORCE index and 2 Moving Averages" Indicator allows you to see Fast and Slow Moving Averages of Force index Force index is one of the top indicators that combines price and volume data into a single value Force index itself is powerful oscillator - that measures the amount of power used to move the price Indicator gives opportunities to see the t

The "Yesterday High Low" indicator for the MetaTrader 4 (MT4) trading platform is a powerful tool designed to help traders identify key price levels from the previous trading day. This indicator provides a visual representation of the high prices, low prices, high/low price averages, and intermediate average levels on the chart.
Primarily used by institutional and professional traders, this indicator offers an instant view of price levels that are often considered crucial in financial markets
FREE

Индикатор DataSource AC — инструмент технического анализа разработанный автором на основе, Accelerator Oscillator (осциллятор ускорения). Все знают общие принципы работы с индикатором AC. Поэтому я не буду описывать их отдельно. Я сосредоточусь на различиях. Различия являются чисто технической реализацией и расширенной функций индикатора. Также важной особенностью является то, что индикатор не меняет свои значения даже при использовании цены закрытия, поскольку индикатор использует алгоритм

This indicator integrates the Bollinger Band strategy in calculation with a volume-over-MA
calculation to further narrow down "Areas of Interest" levels for a potential re-test zone to the right of the chart.
We added a Moving Average calculation for a multi-level cloud and further broke down more conditions to highlight both
volume flow crossover on the High and Extreme High MA's and also high and extreme high volume spikes on set period average
without bull\bear conditions. Original Bull
FREE

Индикатор SFT Fibo Smart Pivot - это мощное торговое средство, основанное на золотом сечении Фибоначчи, которое помогает определить ключевые уровни поддержки и сопротивления на рынке. Этот индикатор обладает способностью выявлять важные ценовые уровни, которые могут стать точками входа и выхода из сделок. Он позволяет трейдерам более эффективно анализировать рынок и принимать более обоснованные решения. Вычисляет несколько уровней поддержки и сопротивления, что позволяет трейдерам видеть целый с
FREE

Head and Shoulders Pattern Indicator - Your Key to Recognizing Trend Reversals Unlock the power of pattern recognition with the "Head and Shoulders Pattern Indicator." This cutting-edge tool, designed for MetaTrader, is your trusted ally in identifying one of the most powerful chart patterns in technical analysis. Whether you're a novice or an experienced trader, this indicator simplifies the process of spotting the Head and Shoulders pattern, allowing you to make informed trading decisions. Key
FREE
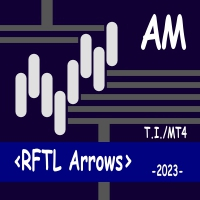
Представленный индикатор основан на быстром цифровом фильтре (RFTL) с помощью которого прогнозируется краткосрочный тренд. Данный продукт отмечает точки разворота тренда и линии поддержки/сопротивления. Индикатор имеет шесть вариантов расчета: 1. Идентифицирует выход цены закрытия за пределы канала; 2. Идентифицирует выход/вход цены закрытия за пределы канала; 3. Идентифицирует выход цены закрытия за пределы канала и боковое движение цены; 4. Идентифицирует выход средней цены за пределы канала;
Представленный индикатор основан на медленном цифровом фильтре (RSTL) с помощью которого прогнозируется долгосрочный тренд. Данный продукт отмечает точки разворота тренда и линии поддержки/сопротивления. Индикатор имеет шесть вариантов расчета: 1. Идентифицирует выход цены закрытия за пределы канала; 2. Идентифицирует выход/вход цены закрытия за пределы канала; 3. Идентифицирует выход цены закрытия за пределы канала и боковое движение цены; 4. Идентифицирует выход средней цены за пределы канала;
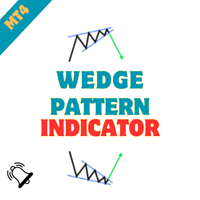
Wedge Chart Pattern Indicator - Unleash the Power of Wedge Patterns in Your Trading Embark on a journey of precision trading with the "Wedge Chart Pattern Indicator." Crafted for MetaTrader, this advanced tool is your ultimate companion for identifying wedge chart patterns, empowering you to make informed and strategic trading decisions. Whether you're a seasoned trader or just starting, this indicator simplifies the process of spotting wedge patterns, providing you with a valuable edge in the m
FREE

Flag Pattern Indicator - Your Guide to Flagging Profitable Trade Setups Welcome to the world of precision trading with the "Flag Pattern Indicator." Designed for MetaTrader, this powerful tool is your go-to solution for identifying one of the most reliable and versatile chart patterns in technical analysis: the flag pattern. Whether you're a seasoned trader or just starting, this indicator simplifies the process of spotting flag patterns, giving you an edge in your trading decisions. Key Feature
FREE

Introducing the South African Sniper indicator created by a small group of traders with a few years trading trading the financial market profitably . This is a plug and play indicator that provides you with BUY and SELL (SNIPER ENTRY) signals with TARGET and trail stops. The indicator Works with all MT4 trading instruments. The indicator uses previous chart data as receipt to speculate on future market moves.
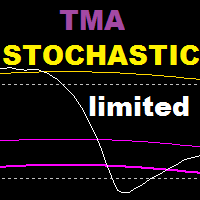
TMA Stochastic is an indicator based on stochastic oscillator and tma bands indicator , this indicator is based on a reversal strategy . Recommended time frame : 15 and above Recommended settings : lower values for scalping , higher values for swing trading WORKS ONLY ON EURUSD , GET THE FULL VERSION : https://www.mql5.com/en/market/product/108378 ======================================================================= Parameters : tma history : how many bars back to show tma bands on stochas
FREE

Daily supply and demand levels for breakouts or reversals. Use on 1 Hour charts No nonsense, for the confident trader who trades price action supply and demand levels with daily projections without the fluff using 1 Hour charts. MT5 Version: https://www.mql5.com/en/market/product/108522 The Bank Trader Indicator is a sophisticated tool employed by institutional traders, particularly those in banking institutions, to navigate the complex world of forex markets. Rooted in the principles of daily

Symmetrical Triangle Pattern Indicator - Mastering Trend Recognition in MetaTrader Unlock the power of trend recognition with the "Symmetrical Triangle Pattern" indicator for MetaTrader. This innovative tool simplifies the identification of symmetrical triangle patterns, providing traders with clear signals for potential trend continuation or reversal. Elevate your trading strategies with this MQL offering. Key Features : Accurate Pattern Recognition : The Symmetrical Triangle Pattern Indicator
FREE
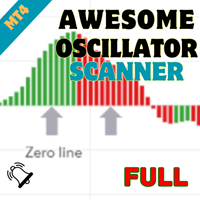
Welcome to the world of advanced trading with the Awesome Oscillator Scanner! Maximize your trading experience with our powerful MT4 indicator designed for seamless analysis and real-time insights. Key Features: Effortless Awesome Oscillator Scanning: Unlock the full potential of the Awesome Oscillator Scanner by effortlessly scanning multiple currency pairs. Receive instant alerts when specific Awesome Oscillator conditions are met, ensuring you stay ahead of market movements. Comprehensive Da
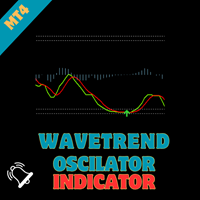
WaveTrend Oscillator - Bringing Tradingview's Renowned Indicator to MQL Elevate your trading strategies with the "WaveTrend Oscillator," an MQL port of the renowned TS/MT indicator created by Lazybear on tradingview. This powerful indicator provides valuable insights into market dynamics, offering clear signals for optimal entry and exit points in your trades.
Key Features : Proven Effectiveness : Based on the popular TS/MT indicator, the WaveTrend Oscillator brings a time-tested and proven ap

Supreme Direction is an indicator based on market volatility , the indicator draws a a two lined channel with 2 colors above and below price , this indicator does not repaint or back-paint and signal is not delayed. how to use : long above purple line , short below golden line. Parameters : channel period ========================================================
FREE

Supreme Stoploss is an indicator for metatrader 4 that is based on the ATR indicator , it gives stoploss/takeprofit as lines drawn above and below the price , this indicator does not repaint/back paint and is not delayed. can be used to determine the stop loss or take profit of a trade using ATR value multiplied by the number set by user. ====================================================================================================== Parameters : ATR SL period : ATR period identity : leave
FREE
Supreme MaChannel is an indicator based on moving averages , the indicator gives dynamic support and resistance in bands format. Recommended for reversal traders , add it to your reversal strategy. Parameters : Supreme MA Period : ma periods Supreme MA Price : close/open/high/low..etc Supreme MA Type : Simple/Exponential/Smoothed/Linear Weighted Deviation : bands deviation the distance between the two band lines
Supreme Entry is an arrow signal based indicator that give buy and sell signals , the indicator gives buy/sell signals with alert on candle open/close (depends what you set it to be from inputs) . this indicator does not repaint/back-paint and signal is not delayed. Strategy : Open buy same moment buy arrow appear and open sell same moment a sell arrow appear , close on well or on opposite signal . Recommended Time frame : 15 and above this arrow is good as ? : addon to your existing strategy ,
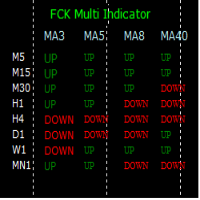
The FCK Multi Indicator for MT4 displays trend direction of multiple indicators on multiple time frames for a pair. So, forex traders can see the trend direction at a snap and trade with confluence of multiple indicators. Furthermore, it helps traders to see the trend in multiple time frames and trade in the direction of the overall market trend. Additionally, it shows the stop loss, pips to stop, pips in profit of any open position. The indicator display is very neat and is very helpful for bot
STOCH ARROW is a long short arrow signal type indicator that is based on standard stochastic oscillator this indicator has 3 methods of giving long and short signal that are as follow : 1.whenever stochastic lines cross 2.when a cross happens in overbought and oversold zones (short arrow on overbought zone cross , long arrow on oversold zone cross) 3.when stochastic lines leave overbought and oversold zones (short arrow on leave from overbought zone , long arrow leave on oversold zone) this ind
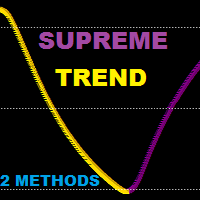
Supreme Trend is a reversal/continuation type Oscillator type indicator that is based on Moving average and stochastic indicators this indicator can be used in two methods : Reversal Method : short when golden arrow appear after arrows were above upper level (e.g 70) Reversal Method : long when Purple arrow appear after arrows were below lower level (e.g 30) Trend Method : long when arrows cross above 50 level line , short when arrows cross below 50 level line. use higher ma and stochastic peri
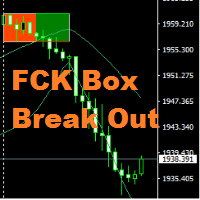
Hi All, " FCK Box Break Out " indicator is very simple indicator for new users. You can choose which indicators and timeframes you want to calculate. "FCK Box Break Out" provides the day's trend for buy/sell trades. Opposite side you the stop loss or hedging trade. NON-REPAINT Buy/Sell signals Recommendations Timeframes: Recommended - H 1 (Still, EA technically works on any Time frames ) Spread : up to 20 Recommended pairs: works on any metal, indices and currency pair

This indicator smoothes the value of CCI (Commodity Channel Index) and reduces its volatility. By using this indicator, the fluctuations created by the CCI indicator are reduced. The smoothed CCI value is placed in a buffer that you can use in your EA and strategy. Leave me a comment if you want By using this indicator, you no longer need to use the Moving Average indicator on the CCI indicator.
FREE
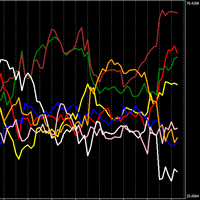
Мощный индикатор, показывающий силу отдельной валюты.
Чем он выше, тем сильнее валюта, и наоборот, чем он ниже, тем она слабее.
Торговая стратегия N1: Открывайте позицию при пересечении линий, если одна пересекает вверх, а другая вниз, открывайте позицию по валюте, которая растет.
Торговая стратегия N2: Откройте позицию, покупая самую сильную валюту и продавая самую слабую валюту.
В настройках можно изменить таймфрейм, я использую по умолчанию (ТАЙМФРАММ 1 ЧАС) и с периодом 24. Я также
FREE

Это индикатор за самые большие деньги. Он обладает исключительными характеристиками. Какой бы интерес ни был на рынке, вы увидите его.
Почти во всех случаях он дает вам только долгосрочный взгляд на рынок, но не обманывайтесь, думая, что он привязан к событиям. Ничего подобного. Он находит, где на рынке находится наибольший интерес, и показывает его вам. Не забывайте, что самые большие деньги (проценты) не отображаются на рынке каждый день. Это то, с чем вы еще не сталкивались. Цена разумная
Supreme Diamond — это мультитаймфреймовый индикатор, основанный на торговой стратегии разворота и тренда, индикатор не перерисовывается и не перерисовывается, а сигналы не задерживаются, индикатор подает сигналы на покупку и продажу с предупреждением.
Индикатор имеет 2 режима сигналов, которые можно выбрать из входных данных (используйте лучший вход в виде ромба). Если для него установлено значение true, индикатор будет фильтровать сигналы обычного режима и выдавать наилучший из возможных сигн

Supreme Arrow — это стрелочный индикатор для mt4, основанный на стратегии индикаторов RSI и демаркеров.
стратегия подходит для трендовых рынков, но также работает и на ранжированных рынках, особенно если она используется для скальпинга.
Рекомендуемый срок: любой.
Рекомендуемые дополнения: 200 SMA.
Индикатор Supreme Arrow не перерисовывается и не перерисовывается, а сигнал не задерживается.
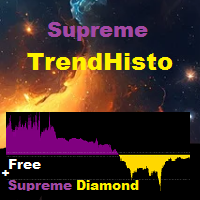
Supreme TrendHisto — это трендовый индикатор, который подает сигналы нисходящего и восходящего тренда. Индикатор действует как гистограмма, индикатор не перерисовывается/обратно не рисуется/задерживается.
Стратегия
Сделка на покупку: пересечение гистограммы выше 0,65, мы открываем сделку на покупку, а для выхода вы можете либо выйти, когда гистограмма достигнет уровня 0,70, либо выйти при достижении уровня 0,70.
Сделка на продажу: пересечение гистограммы ниже -0,65, мы открываем сделку на
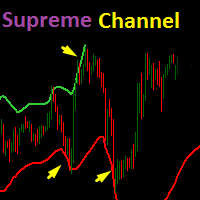
Основанный на индикаторе канала TV ATR, индикатор Supreme Channel представляет собой динамическую полосу поддержки и сопротивления, которая дает трейдеру подсказку о потенциальном развороте текущего тренда.
Рекомендуемый таймфрейм: 15M и выше.
Рекомендуемые настройки: По умолчанию, но трейдер может изменить их по мере необходимости.
Параметры:
1. Длина канала
2.Пропускная способность (расстояние между двумя линиями канала)
3.Множитель (множитель значения ATR)
4. показать канал (Пр
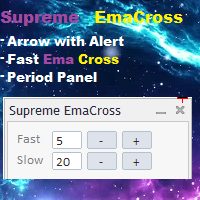
Supreme EmaCross - это индикатор, основанный на пересечении двух экспоненциальных скользящих средних, он генерирует стрелки покупки и продажи на основе пересечения EMA и выдает предупреждение при появлении сигнала, индикатор не перерисовывается и не перерисовывается, а стрелки не задерживаются, индикатор имеет быстрый Панель изменения периода EMA, где трейдер может изменять значения EMA, не заходя в настройки индикатора, панель является подвижной.
=============================================

Forex Indicator "MACD with Trend ZigZag" for MT4 MACD indicator itself is one of the most popular tool for trend trading "MACD with Trend ZigZag" is excellent for using with Price Action entries or in combination with other indicators Use this indicator to select most accurate entry signals: - If MACD is above 0 (green color) and ZigZag line is upward - search only for Buy Price Action patterns - If MACD is below 0 (pink color) and ZigZag line is downward - search only for Sell Price Action
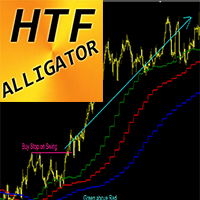
Forex Indicator Alligator H igher Time Frame for MT4 Alligator indicator is one of the most powerful trend indicators. H TF means - H igher Time Frame This indicator is excellent for Trend Traders as well as combination with Price Action entries. HTF Alligator Indicator allows you to attach Alligator from Higher time frame to your current chart. Consider Buy entries only when Green line is above Red one & Red is above Blue - arrange Buy Stop pending order on maximum of latest

Трендовый анализ, возможно, самая важная область технического анализа и является ключом к определению общего направления движения инструмента. Индикатор Quest Trend определяет господствующую тенденци. Они помогает анализировать рынок на выбранном временном интервале. Тренды основаны на принципе более высоких максимумов, более высоких минимумов (для восходящего тренда) и более низких максимумов, более низких минимумов (для нисходящего тренда). У них могут быть разные временные периоды, и они мог

С помощью этого инструмента вы можете создать некоторые полезные данные в файле CSV.
Вы можете:
- Определить временные рамки - количество загружаемых свечей - Назовите файл как хотите - Выберите дополнительные наборы данных для загрузки.
Следующие данные записываются в файл CSV.
- Время создания свечи. - Открытая цена - Цена закрытия - Высокая цена - Низкая цена
Вам также доступен следующий выбор:
- Объем - RSI (также можно выбрать период) - Скользящая средняя (период и метод опреде
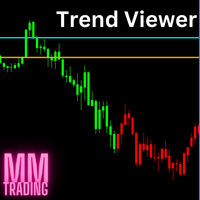
Этот индикатор меняет цвет графика, когда цены более бычьи или медвежьи. Рекомендуется использовать этот индикатор на небольших тайм фреймах и только в часы пик торговли. И не забывайте свой стоп-лимит. Это не оракул и не Святой Грааль.
В настройках вы можете изменить цвет свечей, а также их настроение. Для этого используйте настройки Set 1 и Set 2 и протестируйте.
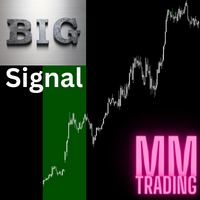
Это мультитаймфреймовый индикатор, который собирает данные с нескольких таймфреймов. Он пытается определить тренд и предсказать откат. Надо понимать, что тренды появляются внезапно и откат превращается в новый тренд. Это не Святой Грааль. Всегда помните о своем стоп-лоссе. Используйте этот индикатор, чтобы дополнить вашу существующую стратегию.
Линии, отображаемые на графике, можно изменить так, чтобы они отображались только в окне индикатора и, следовательно, не мешали работе. Логично, что к
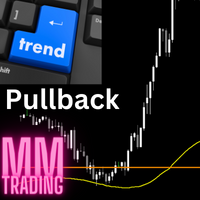
Этот индикатор не является обычным скользящим средним, хотя и ведет себя аналогично. Мне очень нравится использовать это для выявления откатов. Эту стратегию я использую только один раз в день по одному инструменту, не чаще. Лучше всего, если утром цена будет находиться дальше от линии, а когда произойдет откат, вы сможете создать сетап для входа с помощью этого индикатора. Используйте дополнительные индикаторы или используйте их в качестве дополнения к существующей стратегии.
Это не Святой Г

The indicator is the advanced form of the MetaTrader 4 standard Fibonacci tool. It is unique and very reasonable for serious Fibonacci traders.
Key Features
Drawing of Fibonacci retracement and expansion levels in a few seconds by using hotkeys. Auto adjusting of retracement levels once the market makes new highs/lows. Ability to edit/remove any retracement & expansion levels on chart. Auto snap to exact high and low of bars while plotting on chart. Getting very clear charts even though man
Данный индикатор является модификацией классического индикатора Parabolic support and resist (PSAR). Индикатор имеет два настраиваемых диапазона что позволяет идентифицировать долгосрочный и краткосрочный тренд. Индикатор имеет возможность подавать сигналы и отправлять уведомления о них на электронную почту и терминал. Проверенный временем продукт позволяющий не только определять точки входа/выхода но и обоснованные уровни для установки защитных стоп ордеров.
FREE
Индикатор технического анализа описанный в статье Владимира Кравчука: "Цифровые индикаторы в техническом анализе финансовых рынков" . В предложенном варианте индикатор подает два типа сигналов: 1. Пересечение нулевого значения; 2. Смена направления. Для эффективного использования необходимо учитывать долгосрочный тренд и открывать позицию только в его направлении. Рекомендуется использовать подтверждение сигналов. Сигнал считается подтвержденным если текущая цена преодолела максимальное (для с
FREE

The Supreme HmaSignal indicator is an indicator for trend trading , its main character is the hull moving average colored line , and secondary is buy and sell arrows , arrows are fair but the main focus is on the colored hma , this indicator does not repaint or back paint or delay its signals. if you like this indicator please check my Supreme Trendhisto: here , and my Supreme Diamond indicator : here
Parameters: HMA Period HMA Smoothing HMA Price (close/open) Signal Period (Arrows)
FREE

Introducing the Consecutive Green/Red Candle Alert Indicator for MT4 - Your Trend Spotting Companion! Are you ready to take your trading to the next level? We present the Consecutive Green/Red Candle Alert Indicator, a powerful tool designed to help you spot trends and potential reversals with ease. Whether you're a new trader looking for clarity in the market or an experienced pro seeking additional confirmation, this indicator is your trusted companion. Key Features of the Consecutive Green/Re
FREE

Rsi indicator and Stochastic Combined into one indicator , the Supreme StochRsi doesnt repaint / Back-paint / delay. can be used as overbought oversold strategy , or trend following on 50 level cross. if you like this indicator please check my Supreme Trendhisto: here , and my Supreme Diamond indicator : here ========================================================================= Parameters : Stochastic K and D value , Stochastic period Rsi Period Rsi price ====================================
FREE

Property of Vertical Capital Edition: Gugol_Quants About USA INDEXES QUANT_INDICATOR: This is a indicator created by math modulation to be used as a trading tool, which was developed in MQL. (MT4) This indicator is for use only with US500(S&P500), NAS100(Nasdaq Composite) and US30(Dow Jones). Signals are activated on "Open" Candle. It’s based on Intraday/Swing Trades whose main timeframe is H1, H2, H3 and H4. However you can use it with other assets by testing with the appropriate settings. *
FREE

Behaving in a similar fashion as the price action of a chart, the indicator uses " Trix " to opportune itself to the exposure of divergency, flat/low market volume, and price action expansion . The TRIX indicator nicknamed after the Triple-Exponential-average, is a momentum-based oscillator that filters minor price changes and fluctuations that are considered insignificant for forex trading whilst providing money making opportunities! Overall, TRIX is a leading indicator that shows diverge
FREE

WONNFX create arrow tester. Сonstructor/Tester. Tester for buffer indicators. Converting a buffer indicator into an arrow signal on the chart. Combining two buffer indicators into one arrow signal. Filter by candle color. You can move the arrow signal several bars forward (useful in cases where the indicator gives signals 2-3 bars late
"WONNFX create arrow tester" is a tool designed specifically for traders who use buffer indicators in their trading strategies. This tester converts the buffer
FREE

Daily Reverse - Day Number-Based Reversal Predictor Description: Experience a revolutionary approach to price reversal prediction with our "Daily Reverse" indicator. This innovative tool leverages day numbers to forecast potential market reversals by drawing vertical lines on the hourly timeframe, giving you valuable insights into intraday trading opportunities. How It Works: "Daily Reverse" harnesses the power of day numbers to predict price reversals. By calculating day-specific patterns, this
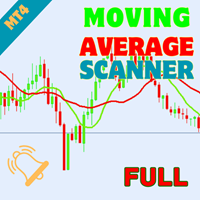
Welcome to the world of advanced trading with the Moving Average Crossover Multicurrency Scanner! Elevate your trading experience with our powerful MT4 indicator designed for seamless analysis and real-time insights. Key Features: Effortless Moving Average Crossover Scanning: Unlock the full potential of the Moving Average Crossover Multicurrency Scanner by effortlessly scanning multiple currency pairs. Receive instant alerts when specific Moving Average Crossover conditions are met, ensuring y
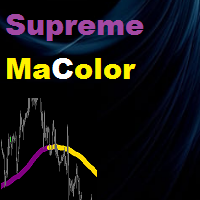
Supreme MaColor is an indicator based on moving average indicator , it gives up and down trend colors and it has different moving averages types and has multi time frame function , this indicator does not repaint/back-paint/delay signal. =================================================================================== Parameters : Timeframe (what time frame to use to draw Supreme Ma) Ma Period Ma Type Ma Price (close/open...etc) Average Shift (Ma shift) Multi Time frame on/off ===============

This indicator softens the value of the RSI (Relative Strength Index) and reduces its volatility. You can use this indicator in your expert advisors, indicators and strategies. With this indicator, you don't need to have two indicators on the chart at the same time. For example, an RSI indicator and a Moving Average indicator If you have any questions or concerns, contact me.
FREE
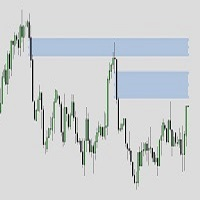
ICT Fair value gapes / Balanced price ranges it marks the fvgs i.e., bisi and sibi both filled and unfilled based on your requirements. it can work on mtf while your on any other time frame i.e., seeing on 5 min. you can watch from filled (BPRs) to unfilled (imbalances) of monthly/weekly/daily/H4/H1 to your likings It can be using multiple times using unique ID with buttons option to on and off the required TF or keeping them all.
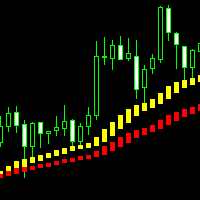
这是 一款可以直观识别波段趋势的分析指标,手工交易最佳选择,不重绘不漂移。 适应任何新手和量化交易的朋友。 参数设置(您购买指标后若不知道如何使用,请私信我): 快线: g_period_88 20
慢线: g_period_88 40
===========交易信号 ===========
快线:黄/蓝线;慢线:红/绿线 多头方向:快线上穿慢线,快线在慢线上方 空头方向:快线下穿慢线,快线在慢线下方
做多信号: 当快线上穿慢线形成一轮多头方向时,首轮多单进场条件为出现两根以上连续阴线,第3根以上K线出现一根阳线,且收盘价格在慢线上方,慢线为红线,即可成交第一单多单,同时如果满足价格回踩触碰到快线,出现一条阳线,且收盘价格在慢线上方,慢线为红线时,也可成交第一单多单;当第一轮多单结束后,此轮多头方向的多单只能满足价格回踩触碰到快线后,出现一条阳线收盘价格在慢线上方,慢线为红线时,才可继续做多进场,即不管快线是黄线或蓝线,只要阳线收盘价格在慢线上方,慢线为红线时就可以做多进场;当快线在慢线上方,阳线收盘价格在慢线上方,但慢线为绿线时,则不进场
做空信号: 当快线下穿

Gold Channel is a volatility-based indicator, developed with a specific timing algorithm for the XAUUSD pair, which consists of finding possible corrections in the market.
This indicator shows two outer lines, an inner line (retracement line) and an arrow sign, where the theory of the channel is to help identify overbought and oversold conditions in the market.
The market price will generally fall between the boundaries of the channel. If prices touch or move outside the channel it is a tra

Market Cycles это уникальный авторский индикатор, который использует нейросеть для определения текущей рыночной фазы. Для обучения нейронная сеть используют циклические (разворотные) паттерны. Валютные рынки имеют тенденцию циклически двигаться от медвежьих периодов к бычьим и обратно. В этом продукте мы объединили паттерны с четырех таймфреймов (M5, M15, M30, H1), это позволило значительно увеличить точность сигналов! Market Cycles нужно использовать на валютной паре EURUSD, таймфреме M30 !

Прежде всего стоит подчеркнуть, что эта торговая система является индикатором без перерисовки, без перекрашивания и без задержек, что делает ее идеальной для профессиональной торговли.
Онлайн-курс, руководство пользователя и демонстрация. Торговая система "Умная система торговли на уровнях поддержки и сопротивления" является продвинутым индикатором, созданным для новичков и опытных трейдеров. Он дает трейдерам точность и уверенность на рынке Форекс. Эта всесторонняя система объединяет 7+ ст

Сигнальный торговый индикатор Sea Candles MT4 определяет направление движения цены с помощью осциллятора CCI, генерируя сигналы на открытие позиции. Индекс товарного канала [CCI] — измеряет отклонение цены от ее скользящего среднего. Дивергенция появляется, когда цена достигает нового максимума, и CCI не может вырасти выше предыдущих максимумов. За этой классической дивергенцией обычно следует коррекция цены. CCI обычно колеблется в пределах ±100. Значения выше/ниже ±100 информируют о состоянии

Форекс индикатор Advanced Scalper MT4 – это формула в основе которого лежит торговля скальпингом, так же по уровням перепроданности и перекупленности. Индикатор работает на всех валютных парах, криптовалютах, акциях, индексы. Универсальный индикатор, который можно настроить под свои нужды и он никогда не будет лишним в любой торговой стратегии.
ИНФОРМАЦИЯ О ИНДИКАТОРЕ Форекс индикатор Advanced Scalper MT4 представлен в виде цветной гистограммы, которые не режут глаз и приятны восприятию. К

Форекс индикатор Wave Wold MT4 предназначен для поиска волн Вульфа и их отображения в текущем окне торгового терминала. Отличный индикатор для трейдеров, использующих в торговле волны Вульфа. Его применение в торговых стратегиях значительно повысит их эффективность и прибыльность.
ИНФОРМАЦИЯ О ИНДИКАТОРЕ В отличие от других индикаторов волн Вульфа, форекс индикатор Wave Wold MT4 обладает рядом особенностей, которые значительно повышают его эффективность: Первая – это параметр Open Windo

Scanning Multi Symbols Scalping Signals based on 3 kinds of Market Analysis methods. Trend, Signal, and Reversator. And each method consists of its own multi timeframes algorithm functions. Summarized to become clear signals direction BUY/SELL, including the signals strength scoring and sending message to all available alert tools. Displayed on a User Friendly and customizable Dashboard. Size, colors, coordinates, highlight, hidden/show and more. Base Timeframe: M15. And M5 to Daily to confirm

Quarterly Cycles
Quarterly Cycles is based on the Quarterly Theory developed by Daye ( traderdaye on X ) T his is an aid to the user to find Cycles and it is NOT automatic detected, user can select AMDX or XAMD in each Cycle and it will be visually draw on the chart. Quarterly Cycles: Yearly, Monthly, Weekly, Daily, 6 Hour (90 minutes)
Yearly Cycle: The year is divided in four sections of three months each Q1 - January, February, March Q2 - April, May, June Q3 - July, August, September Q4
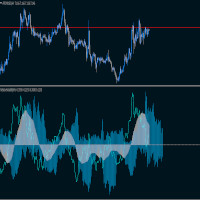
Индикатор показывает отклоненние средней скользящей относительно волатильности, преведущей половины своего периода.
Серая гистограмма показывает среднею скользящею относительно точки привязки.
Голубая гистограмма показывает волатильность относительно преведущей половины
средней скользящей.
Голубая линия имитерует цену относительно средней скользящей.
Индикатор отлично подойдет как для сеточной торговли, так и для торговли по тренду. из плюсов Сигнал не меняется при смене таймфейма

Trend Channel это трендовый стрелочный индикатор форекс для определения потенциальный точек входа. Нравится он, прежде всего, тем, что в нём заложен простой механизм работы, адаптация ко всем временным периодам и торговым тактикам. Создан на основе канала регрессии с фильрами. Отображаем сигналы индикатора Trend Channel на графике функции цены используя математический подход.
Принцип работы - при пробитии цены в зоне перекупленности/перепроданности (уровней канала) генерируется сигнал на пок
This indicator uses a formula based on bollinger bands to determine if the market is in Range or not. It can be used to filter entries and not operate in a sideways market.
It has a minimum value of 0.2 from which it could be operated, although you can modify it in the options to adjust it to your trading style or the market you use.
If the histogram below is red, the market is in range, if it is green, volatility is higher.
FREE
MetaTrader Маркет - торговые роботы и технические индикаторы для трейдеров, доступные прямо в терминале.
Платежная система MQL5.community разработана для сервисов платформы MetaTrader и автоматически доступна всем зарегистрированным пользователям сайта MQL5.com. Ввод и вывод денежных средств возможен с помощью WebMoney, PayPal и банковских карт.
Вы упускаете торговые возможности:
- Бесплатные приложения для трейдинга
- 8 000+ сигналов для копирования
- Экономические новости для анализа финансовых рынков
Регистрация
Вход
Если у вас нет учетной записи, зарегистрируйтесь
Для авторизации и пользования сайтом MQL5.com необходимо разрешить использование файлов Сookie.
Пожалуйста, включите в вашем браузере данную настройку, иначе вы не сможете авторизоваться.