Смотри обучающее видео по маркету на YouTube
Как купить торгового робота или индикатор
Запусти робота на
виртуальном хостинге
виртуальном хостинге
Протестируй индикатор/робота перед покупкой
Хочешь зарабатывать в Маркете?
Как подать продукт, чтобы его покупали
Новые технические индикаторы для MetaTrader 4 - 107
Super signals is an indicator that generates trade arrows. It generates trade arrows with its own algorithm. These arrows give buying and selling signals. The indicator certainly does not repaint. Can be used in all pairs. Sends a signal to the user with the alert feature.
Trade rules Enter the signal when the buy signal arrives. In order to exit from the transaction, an opposite signal must be received. It is absolutely necessary to close the operation when an opposite signal is received. The

A tall upper shadow occurs when the price moves during the period, but goes back down, which is a bearish signal. A tall lower shadow forms when bears push the price down, but bulls pull it back up, which leaves a long line or shadow. This is considered a bullish signal.
Some technical analysts believe a tall or long shadow means the stock will turn or reverse. Some believe a short or lower shadow means a price rise is coming. In other words, a tall upper shadow means a downturn is coming, whil

This is indicator signals entry buy or sell for trader. It notification price entry to trader and price Stop Loss and price Take Profit. Indicator price for entry orders Pending Limit.
Input Parameters On Alert - true/false (Displays a message in a separate window.) On Send Notification - false/true. (Sends push notifications to the mobile terminals, whose Meta Quotes IDs are specified in the "Notifications" tab. (Strict use restrictions are set for the SendNotification() function: no more tha
Signal Trend Arrows is an indicator designed to generate trading signals. This indicator uses a number of different indicators and generates a signal using a number of historical data. It generally tries to calculate the trend return points. These trend returns may be sometimes very large, sometimes small. The investor should act with the belief that the signal may be small. These signals vary according to market conditions. The signals do not repaint. Currency pairs: Any. Work with at least 20

This is the indicator of trading signals. Signal special will be not repair.
Input Parameters On Alert - True/False (displays a message in a separate window). On Send Notification = True/False. (Sends push notifications to the mobile terminals, whose MetaQuotes IDs are specified in the "Notifications" tab. (Strict use restrictions are set for the SendNotification() function: no more than 2 calls per second and not more than 10 calls per minute. Monitoring the frequency of use is dynamic. The

Представляем технический индикатор Fibo Channels Ultimate , мощный инструмент, разработанный для того, чтобы коренным образом изменить вашу торговую стратегию Фибоначчи. Благодаря своей расширенной функциональности этот индикатор автоматически рисует все прошлые каналы Фибоначчи на вашем графике, экономя ваше время и усилия. Что отличает Fibo Channels Ultimate, так это его исключительные возможности настройки, позволяющие профессиональным трейдерам рисовать любой уровень Фибоначчи по своему

Линейный график Volume Percentage Line Graph — это индикатор, предназначенный для предоставления информации об объеме данных. Он извлекает информацию об общем объеме для каждой свечи и представляет ее в процентах от общего объема. Индикатор отображает эти данные в виде линий графика в отдельном окне, что позволяет пользователям легко визуализировать битву между покупателями и продавцами. Одной из ключевых особенностей этого индикатора является его способность отображать объем в процентах в в
FREE

Алгоритм работы индикатора основан на том, что цена привлекается к медленной скользящей средней То же самое относится и к быстрой скользящей средней, которая движется вокруг медленной скользящей средней Эти скользящие средние имеют специальный алгоритм сглаживания. Когда быстрая Moving average идет вверх и находится ниже медленная Moving average, имеем потенциальной сигнал для открытия позиция - Buy entry Когда быстрая Moving average идёт вниз и находится выше медленная Moving average, имеем по
WPR Mtf
Это мультифреймовый вариант стандартного индикатора " Williams Percent Range ". Также, как и остальные индикаторы автора, он позволяет видеть любой набор таймфремов одновременно, и все они будут представлены в масштабе текущего графика цены. Можно выбрать любой набор таймфреймов индикатора и свободно переключаться на ценовом графике как в младшую, так и в старшую сторону. Для каждого ценового периода графики индикаторов всегда будут отображаться в правильном масштабе. Проверено на Ju
This indicator detects Inside Bar Narrow Range 4 and Inside Bar Narrow Range 7 two powerful patterns on 28 pairs on all timeframes. "Inside Bar Narrow Range 4" is an inside bar with the narrowest range out of the last 4 bars so "Inside Bar Narrow Range 7" an inside bar with the narrowest range out of the last 7 bars.
Hence, IBNR4 and better IBNR7 are an objective criterion for identifying decreased range and volatility. Once we find an IBNR4 or an IBNR7 pattern, we aim to trade the breakou

Это кластерный индикатор, являющийся развитием линейки CCFpExtraSuperMulti . Теперь он более приспособлен для работы со смешанными кластерами, в которые могут быть включены символы с разных рынков. Например, можно одновременно смотреть валюты Forex и биржевые индексы, CFD, товары. Количество отображаемых линий увеличено до 16. Появилась возможность включить интерактивную линейку для измерения разницы между линиями. Как и в CCFpExtraSuperMulti, индикатор создает внутри себя набор встроенных класт

Реализация индикации трендового движения с моментами для потенциальных стопов в индикаторе TrendCloud . Может легко употребляться как самостоятельная торговая система. Интерпретировать можно так: расположение курса выше или ниже теней показывают наличие тренда. Переход в тень предупреждает о возможном развороте. Вхождение цены внутрь тени говорит в флэтовом движении. Индикатор отслеживает рыночный тренд с непревзойденной надежностью, игнорируя резкие колебания рынка и шумы вокруг средней цены. П
RSI Mtf
Это мультифреймовый вариант стандартного индикатора " Relative Strength Index ". Здесь реализована та же идеология, как и в других индикаторах автора, таких как " Ma_Multi ", " CCI MTF ", " DeMarker Mtf ", " Force Multi ". Их общим отличительным признаком является соблюдение правильного масштаба времени. В окне индикатора вы можете создать любой набор таймфреймов, и масштаб каждого всегда будет соответствовать масштабу ценового графика, который открыт в данный момент. Таким образом м

Strong Pivot trend indicator is a trend indicator that uses standard pivot calculation and some indicators. The purpose of the indicator is to calculate the possible trends using the pivot point. And to give the user an idea about trend direction.
You can use this indicator as a trend indicator. Or with other indicators suitable for your strategy.
Features The blue bar represents the upward trend. The yellow bar represents the downward trend. The blue pivot point represents the upward trend.

Always Strong indicator, an indicator that uses MacD and Bollinger bands. It is a coded indicator to find trends. It finds these trends by its own algorithm. This indicator requires visual monitoring. It does not give any warning because it needs visual follow-up. The main trendline should turn down to find the down trend. The main trend line should go under the white line and then go under the yellow line. The main trendline should turn upward to find the upward trend. The main trend line shoul

Trend Waves indicator is a trend indicator that uses Average True Range and Standard Deviation indications. It is aimed to find more healthy trends with this indicator. This indicator can be used alone as a trend indicator.
Detailed review 4 different trend colors appear on this indicator. The aqua color represents the rising trend. Dark aqua color means the train is getting weaker. pink color represents the downtrend trend. The dark pink color means the trend is weaker. Parameters Stdeviati

Colored Trend Bars indicator is a trend indicator working with a set of algorithms and a set of indicators. Trend finds trends by using many factors while you are there. This indicator has 4 mode features. Mode 1 represents short-term trends. Mode 2 represents medium to short term trends. Mode 3 represents medium to long term trends. Mode 4 represents long term trends. Easy to use and simple indicator. The user can easily understand the trends. This indicator has 3 trend features. Up trend, down
EASY AND SIMPLE STRATEGY - NON REPAINTING - HIGH TIMEFRAME FILTER - EASY TO BACKTEST
*For Desktop MT4 Only *Great For Scalping *Great For Swing Trading *Mobile Alerts, Desktop Alerts *Works On Any Timeframe *Works On Forex, Indices, Crypto *Perfect For New Traders And Expert Traders
We very often use Average Directional Movement Index (ADX) to identify a trend in forex. We use a simple rule: - If the indicator is above level 25, the market is in strong trend and we then study the values
Our custom RSI indicator uses the standard RSI calculation, but it adds a few super-useful upgrades. In our opinion this is the RSI indicator that should come standard with MT4! Have a look and decide for yourself!
Our indicator has the following benefits:
Never miss another RSI set-up when you are away from your computer A colored RSI line makes it easy to see when price is overbought or oversold Get alerts when price moves into overbought/oversold, out of overbought/oversold, or both Custo

Trade Trend indicator is an oscillator designed to calculate trend reversal points. A set of bar calculations and a set of algorithms to calculate trend reversals. Level probing system with high probability trends. All of these features combine to make it easier for investors to find trends.
Suggestions and Features There are two levels on the Trade Trend indicator. They are at levels of upper level and lower level. The oscillator bar should be below lower level to find the upward trend. And a

Индикатор VR Donchian - это улучшенный вариант канала Дончиана. Улучшения коснулись практически всех функций канала, но при этом был сохранен основной алгоритм работы и построение канала. В индикатор бала добавлена смена цвета уровней в зависимости от текущей тенденции - это явно показывает трейдеру смену тренда, флета. Была добавлена возможность информировать трейдера о пробитии одного из двух уровней канала на смартфон, электронную почту или в самом терминале MetaTrader. Были добавлены ценовые
FREE

Представляем Entry Point Dashboard Ultimate , мощный технический индикатор, предназначенный для предоставления уведомлений о покупке/продаже для 6 валютных пар. Этот индикатор анализирует 5 скользящих средних, CCI, RSI, Stochastic, индикаторы Билла Вильямса и индикаторы объема на 3 разных таймфреймах для генерации точных сигналов. Он предлагает неограниченные возможности настройки для профессиональных трейдеров, позволяя им адаптировать индикатор на основе своего опыта и стратегий. Entry Poi

About
Holy Renko is a trend identifier capable of identify small and long market movements. This indicator should be use in Renko Charts.
VIDEO (information and tips) [HERE]
How to install Renko Charts [HERE]
Features
Developed for Renko Charts Easy to analyze Fast signals Not repaint (when candle close) Statistics panel Filters false signals
Alerts, emails and push notifications
Advantages of Renko Chart Easy to install Easy to analyze Filter out the noise of wicks Easy ident

Индикатор показывает текущий тренд. Он отлично "чувствует" смену тренда. Стрелка-сигнал после закрытия бара не исчезает и не перерисовывается. Открывать ордер в сторону стрелки можно уже на следующем баре после появления сигнала. Пользование индикатором интуитивно понятно. При появлении первой стрелки бирюзового цвета - предпочтительны покупки. Красного цвета – продажи. Использовать индикатор рекомендую на таймфрейме H1. При появлении первой стрелки противоположного цвета и закрытии часового бар
Relative Trend Bias
The Relative Trend Bias indicator is a simple indicator that helps you identify the current directional movement bias of a financial instrument based on the number of bars specified. Helps you identify the current trend based on a bar period of your choice Shows you level "safety zones" for reversals Shows you when the trade bias changes while the indicator is active on the chart
Indicator is forward facing. It does not backdraw/backpaint but it can be tested on the indi

Description
The base of this indicator is an ZigZag algorithm based on ATR and Fibo retracement. The ZigZag can be drawn like a classic ZigZag or like Arrows or needn't be drawn at all. This indicator is not redrawing in sense that the ZigZag's last shoulder is formed right after the appropriate conditions occur on the market. The shoulder doesn't change its direction afterwards (can only continue). There are some other possibilities to show advanced information in this indicator: Auto Fibo on

"Giant" - гибкая в отношении к торговым стратегиям система. Состоит из двух качественных индикаторов, которые устанавливаются на пять разных таймфреймов одной валютной пары (см. скриншот). Она следит за трендом и даёт сигналы на открытие. Система прошла большое количество проверок и показала высокую точность. Индикаторы продаются по отдельности. Второе слово в основном названии - это сам индикатор. В данном выпуске продаётся индикатор "Nicely" .
FREE

"Giant" - гибкая в отношении к торговым стратегиям система. Состоит из двух качественных индикаторов, которые устанавливаются на пять разных таймфреймов одной валютной пары (см. скриншот). Она следит за трендом и даёт сигналы на открытие. Система прошла большое количество проверок и показала высокую точность. Индикаторы продаются по отдельности. Второе слово в основном названии - это сам индикатор. В данном выпуске продаётся индикатор "Attention" .
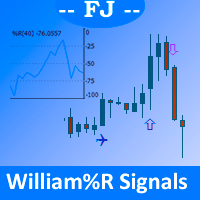
It draws on the main price chart icons indicating clearly the different crosses produced by the William% R oscillator signal as it passes through the overbought, oversold, and intermediate lines.
Allowed customization: - Position of overbought/oversold lines - Your prefered icons - The color of each icon - Periods to use in William% R
Parameters: - WilliSignalsOn_Off: It allows you to hide/show the indicator without having to delete / re-add and configure this indicator - WilliPeriods: Perio
Данный индикатор отмечает участки разворота тренда, в точках разворота давая сигнал на вход в рынок в виде стрелок соответствующего цвета и направления движения в виде линий, а также звукового оповещения. Основан на закономерностях рынка FOREX, точных определениях текущего экстремума и нахождения свечных моделей на вершинах/низах рынка. Универсальный алгоритм помогает определить точки разворота указывая стрелками где осуществить вход в рынок. Дополнительно Индикатор не перерисовывается. Выводит

Индикатор Pallada Manual System представляет собой полностью готовую ручную торговую систему, не требующую использования каких-либо ещё индикаторов. Очень простой и понятный в использовании. Торговля станет для вас приятным занятием без стресса и нервов, при которой в конце дня всегда понятно - получили ли вы прибыль или убыток, без долгих просадок и долгих ожиданий прибыли. Расчетные показатели прибыльности в зависимости от настройки варьируются. Индикатор идеально подойдет для тех кто хочет
Description
The base of this indicator is an ZigZag algorithm based on ATR and Fibo retracement. This indicator is not redrawing in sense that the ZigZag's last shoulder is formed right after the appropriate conditions occur on the market. The shoulder doesn't change its direction afterwards (can only continue). Note: An indicator with advanced possibilities is also available.
Indicator input parameters
The input parameters allow to change the sensitivity of the ZigZag. ATR period ATR mul
FREE
Highly configurable Momentum indicator.
Features: Highly customizable alert functions (at levels, crosses, direction changes via email, push, sound, popup) Multi timeframe ability Color customization (at levels, crosses, direction changes) Linear interpolation and histogram mode options Works on strategy tester in multi timeframe mode (at weekend without ticks also) Adjustable Levels Parameters:
Momentum Timeframe: You can set the lower/higher timeframes for Momentum. Momentum Bar Shift
FREE
Highly configurable Demarker indicator.
Features: Highly customizable alert functions (at levels, crosses, direction changes via email, push, sound, popup) Multi timeframe ability Color customization (at levels, crosses, direction changes) Linear interpolation and histogram mode options Works on strategy tester in multi timeframe mode (at weekend without ticks also) Adjustable Levels Parameters:
Demarker Timeframe: You can set the lower/higher timeframes for Demarker. Demarker Bar Shift: Y
FREE
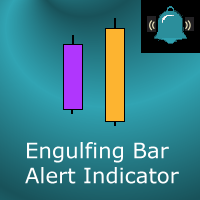
This indicator marks Engulfing Bars (bars with a higher high and a lower low than the previous bar) on your chart. It will also send alerts when one forms, including via e-mail or push notification to your phone . It's ideal for when you want to be notified of an engulfing/outside bar set-up but don't want to have to sit in front of your chart all day. You can configure all the settings including:
Whether it should be "range engulfing" (so high is higher than previous bar and low is lower than
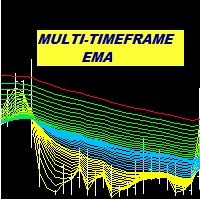
Multi Period EMA A trend indicator based on the exponential moving average. Keeping track of multiple EMA is a more effective way of detecting possible trend development. This indicator allows for the setting of as many as 6 different EMA periods. Unused period parameters can be set to zero to exclude the particular EMA from being displayed on the chart.
Features Up to 6 EMA displayed on chart. Option to select high EMA and Low EMA in order to detect crossovers Alert in event that change in s

Super Trend Lines is an indicator that calculates trends using a set of channels and using a set of algorithms. This indicator helps to find trend return points. It generally represents an oscillator. This trend tracking system helps the investor to understand small or large trends and determines the direction according to it.
Time frames: M15, M30, H1
Parameters Period : general trend period. Bar : bar calculation setting Channel_Cal : channel calculation period. The smaller the value here,

Dynamic Support and Resistance is the collective work of three traders with several decades worth of experience trading all financial markets. The math behind these levels is unlike anything ever produced in the public trading world. Dynamic S&R is a tool to measure ranging markets, trending markets, and aids in catching the turns of the trends when combined with Dynamic PriceWraps. Dynamic S&R can be used for spot FX, futures, stocks, and is incredibly useful in options trading for all produ

Структура индикатора. Индикатор Cunning crocodile ( Хитрый крокодил ) состоит из трех скользящих средних (примененных к цене Median price = ( high + low )/2 ) : обычной MA ( SMA , EMA , SMMA , LWMA ) или среднего < X > процесса X и двух ее обобщений <X F >=<X/<X>>*<X> и <X S >=<X*<X>>/<X>, берущихся с тем же периодом усреднения. Все три кривые пересекаются в единых точках, что (такое пересечение, при котором хитрый крокодил,
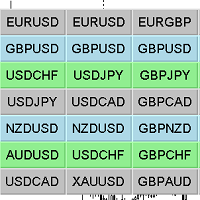
Индикатор быстрой навигации по финансовым инструментам. При нажатии на кнопку, происходит переход на график финансового инструмента, название которого было написано на кнопке.
Другими словами, индикатор открывает или разворачивает уже имеющееся окно графика, если такого графика нет, индикатор его откроет если он существует в обзоре рынка данного терминала.
Для каждого графика можно настроить наименование финансового инструмента, цвет текста и цвет фона, всего можно настроить 42 кнопки. Индик

Fibonacci retracement and extension line drawing tool
Fibonacci retracement and extended line drawing tool for MT4 platform is suitable for traders who use golden section trading
Advantages: There is no extra line, no too long line, and it is easy to observe and find trading opportunities
Trial version: https://www.mql5.com/zh/market/product/35884
Main functions:
1. Multiple groups of Fibonacci turns can be drawn directly, and the relationship between important turning points

Range Volume Profile Индикатор Range Volume Profile показывает распределение сделок по ценовой шкале в заданном
временном диапазоне. Данный инструмент упрощает анализ рыночной ситуации и помогает находит ценовые уровни где сидит крупный игрок. Особенности:
Показывает распределение тиковых объёмов относительно цены. Показывает распределение реальных объёмов относительно цены. Если ваш брокер предоставляет их. Можно выбирать участок графика, который нужно исследовать. При определённых настрой

The arrows are calculated with: - 2 Parabolic parameters - 2 ADX parameters - 4 Stochastic parameters
We recommend to combine it with Parabolic, ZigZag or Elliot waves indicator. Always trade the trend!
If you make sure to draw your trend lines and support/resistance zones you will just have to wait for the signal to appear. Take the trade. For Binary Options it is advisable to set the expiry time to 5-15 min in M1 chart. THIS INDICATOR IS ZERO REPAINT
Best assets to trade: -

Pips collector - этот индикатор представляет из себя готовую механическую торговую систему. Pips collector сам анализирует рынок на 57 характеристик, определяя направление тренда, волатильность, агрессивность, сопротивление и поддержку. После этого Pips collector выводит на экран сигналы для открытия ордеров на покупку или продажу. Интерпретация торговли с Pips collector очень простая и подходит как для профессиональных трейдеров, так и для новичков. Так же индикатор Pips collector может прис

Очень полезный индикатор для торговли, который показывает текущую нагрузку на депозит. Нагрузка рассчитывается по формуле (маржа/баланс)*100%. Если нужно , индикатор подает звуковой сигнал, когда нагрузка на депозит превышает определенный уровень. Нагрузка отображается общая, с учетом все открытых позиций. Параметры индикатора: Color - цвет текста. Font size - размер шрифта. Font family - семейство шрифта. Right - отступ справа. Bottom - отступ снизу. Max load - максимальная нагрузка, при котор
FREE
The ' MTF MA Cross ADV ' indicator comes from MTF Moving Average Cross with an advanced algorithm . Fast & slow m oving average crosses are used for generating up to four arrows either at bar 0 or bar 1.
Key Features Advanced algorithm to detect changes in standard moving average cross w/arrows. There are many settings which can all be non-repaint for signals at a new bar and at bar 0. NewBarConfirm as 'true' means notifications come from bar 0 & bar 1(false). Audible Alerts, e-mail no
Highly configurable Williams %R indicator. Features: Highly customizable alert functions (at levels, crosses, direction changes via email, push, sound, popup) Multi timeframe ability Color customization (at levels, crosses, direction changes) Linear interpolation and histogram mode options Works on strategy tester in multi timeframe mode (at weekend without ticks also) Adjustable Levels Parameters:
Williams %R Timeframe: You can set the current or a higher timeframes for Williams %R. William
FREE

The Trend Confirm indicator is a set of indicators and a set of channel movements. The purpose of the indicator is to find a healthy trend and designed to confirm these trends. There are two channels in the trend. The blue channel line is used to confirm the ascending trend. The green trend line is used to confirm the downtrend.
How to use? If the trend line in the indicator goes above the blue channel line, the trend is starting to rise. If the trend line within the indicator falls below the
Highly configurable Osma indicator.
Features: Highly customizable alert functions (at levels, crosses, direction changes via email, push, sound, popup) Multi timeframe ability Color customization (at levels, crosses, direction changes) Linear interpolation and histogram mode options Works on strategy tester in multi timeframe mode (at weekend without ticks also) Adjustable Levels Parameters:
Osma Timeframe: You can set the lower/higher timeframes for Osma. Osma Bar Shift: Y ou can set
FREE

PRO VERSION This free indicator change timeframe of charts(up to 3) at the same time,by clicking a label. If you click the label(shown below),timeframe of charts will change. If you click again,timeframe of charts restore.
You can change the position of the label.
You can change charts up to 3 charts(a paid version enables up to15 charts). You can add second,third timeframe changer label.
This indicator is very useful for speed trading.
There is a more powerful PRO VERSION . The paid v
FREE

This indicator change timeframe of charts(up to 15) at the same time,by clicking a label. If you click the label(shown below),timeframe of charts will change. If you click again,timeframe of charts restore.
You can change the position of the label.
You can change charts up to 15 charts. You can add second,third timeframe changer label.
This indicator is very useful for speed trading.
*This indicator don't work propery in strategy tester.Use Free version to know the real potential.
Inp
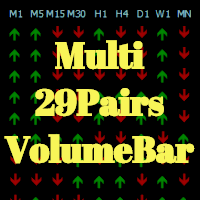
Hola Traders. This indicator Developed from VolumeBar indicator. By the signal show from the last bar complete. Show 9 time frame and 29 pairs currency. XAU,USD,EUR,GBP,AUD,NZD,CAD,CHF,JPY
The display parameters are color customizable. Original Parameters: ColorGreen - buy signal. ColorRed - sell signal. Font29PairsColor - color of font 29 pairs currency.
Thanks Traders

The MESA Spectrum indicator calculates the power spectrum of a data series using the Maximum Entropy Spectrum Estimation method and produces a power spectrum plot. The Maximum Entropy algorithm, unlike a simple FFT transform, will include frequencies from the entire complex frequency plane and not just the Nyquist interval which, in general terms, means that it can resolve cycle periods that are larger than the data window passed to the function. In addition, MESA has the ability to fit very sha

Version 1.05 - added option to use mouse to set the Data Offset (anchor). Just hold down your SHIFT key, then double-click anywhere on the chart, then release the SHIFT key and the anchor will be set to the bar nearest to your double-click.
Version 1.04 - added fix for demo mode (i.e., operation in Strategy Tester). Use Open Prices Only and check Use Date (select a date range)
The MESA Cycles indicator calculates the power spectrum of a data series using the Maximum Entropy Spectrum Estimation

The CCI Standard/Hidden Divergence indicator will plot the Commodity Channel Index (CCI), and will also identify and plot standard (regular) divergences between the indicator and the price action, OR it can be set to identify and plot hidden (reverse) divergences between the indicator and the price action. The divergences themselves are implemented as lines (default green for bullish divergence and red for bearish divergence) drawn in the indicator pane. If activated via the Inputs dialog, alert

BeST_Visual MAs Signal Generator MT4 Indicator is a very useful Visual Tool that can display in the Chart all ENTRY signals (BUY and SELL) and also any corresponding EXIT signal, based on a total of 12, common but also different trading strategies, in which the Entry and Exit Signals are derived exclusively by using Moving Averages (MAs). The two main groups of MAs Strategies included in this tool are: A) Crossover Signals This group includes 4 different strategies (A1-A4), where Entry and Exi

This indicator displays super power trend movement. Features Multiplier - displays multiplier movement.
Multiplier2 - displays multiplier2 movement. Trend - displays indicator trend 1 and trend 2 (true/false). separate_windor - displays trend separate window.(0-1....)
X - move the trend left and right.
Y - move the trend up and down. How to understand the status: If the Trend color is green, trend is up. If the Trend color is red, trend is down.

The MACD Standard/Hidden Divergence indicator will plot the MACD, and will also identify and plot standard (regular) divergences between the indicator and the price action, OR it can be set to identify and plot hidden (reverse) divergences between the indicator and the price action. The divergences themselves are implemented as lines (default green for bullish divergence and red for bearish divergence) drawn in the indicator pane. If activated via the Inputs dialog, alerts will be generated when

The RSI Standard/Hidden Divergence indicator will plot the Relative Strength Index (RSI), and will also identify and plot standard (regular) divergences between the indicator and the price action, OR it can be set to identify and plot hidden (reverse) divergences between the indicator and the price action. The divergences themselves are implemented as lines (default green for bullish divergence and red for bearish divergence) drawn in the indicator pane. If activated via the Inputs dialog, alert

The Momentum Standard/Hidden Divergence indicator will plot the momentum, and will also identify and plot standard (regular) divergences between the indicator and the price action, OR it can be set to identify and plot hidden (reverse) divergences between the indicator and the price action. The divergences themselves are implemented as lines (default green for bullish divergence and red for bearish divergence) drawn in the indicator pane. If activated via the Inputs dialog, alerts will be genera

The Stochastic Standard/Hidden Divergence indicator will plot the stochastic (%K and %D), and will also identify and plot standard (regular) divergences between the indicator and the price action, OR it can be set to identify and plot hidden (reverse) divergences between the indicator and the price action. The divergences themselves are implemented as lines (default green for bullish divergence and red for bearish divergence) drawn in the indicator pane. If activated via the Inputs dialog, alert

Ultimate solution on price action trade system Built Inside One Tool! Our smart algorithm tool will detect the price action pattern and alert upon potential with entry signals and exit levels including stoploss and takeprofit levels based on the time setting on each market session. This tool will also filters out market currency strength to ensure our entry are in a good currency conditions based on it's trend.
Benefit You Get
Easy, visual and effective price action detection. Gives you th

This indicator displays Super Power Beeta trend movement.Indicator is version 2 . Features Multiplier - displays multiplier movement. Multiplier2 - displays multiplier2 movement. Trend - displays indicator trend 1 and trend 2 (true/false).
Background:color - displays background color (true/false).
separate_window - displays trend separate window.(0-1....) separate_window2 - displays trend (background color )separate window.(1-2....) X - move the trend left and right.
Y - move the trend up

Let´s try to make some real money!
Call me profit addicted. I thought why not try to make THE dream come reality. With discipline, a clear strategy and this indicator I focus on entering the perfect trades. This indicator is very easy to use as you will get perfect entry points for Put or Call trades.
The arrows are calculated with: - Momentum parameters - Candle stick patterns - Fundamental Price action
We recommend to combine it with Parabolic, ZigZag or Elliot waves indic

Extended VERSION
Ultimate solution on price action trade system Built Inside One Tool! Our smart algorithm tool will detect the price action pattern and alert upon potential with entry signals and exit levels including stoploss and takeprofit levels based on dynamic and unique calculation. This tool will also filters out market currency strength to ensure our entry are in a good currency conditions based on it's trend.
Benefit You Get
Easy, visual and effective price action detection. Gi

MT4. Многофункциональный индикатор автоматически определяет и рисует волновые каналы, а также линии поддержки и сопротивления. Показывает тренд младшего периода и границу пробоя старшего. Это не стандартный канал. Работает совершенно по новому принципу. В алгоритм построения канала заложен принцип закона золотого сечения. Работает на графиках любого инструмента. Для лучшего восприятия каналы окрашены в разные цвета. канал с синим фоном - основной вверх. канал с красный фоном - основной канал

Представляем Entry Point , мощный технический индикатор, предназначенный для предоставления уведомлений о покупке/продаже. Этот индикатор анализирует 5 скользящих средних, CCI, RSI, Stochastic, индикаторы Билла Вильямса и индикаторы объема на 3 разных таймфреймах для генерации точных сигналов. Он предлагает неограниченные возможности настройки для профессиональных трейдеров, позволяя им адаптировать индикатор на основе своего опыта и стратегий. Точка входа отправляет сигналы пользователям че

Индикатор PriceRunner предназначен для определения тренда без эффекта случайных скачков цены. Он использует серию цен и несколько скользящих средних для уменьшения шума. Работает на нескольких таймфреймах, даже на М1. Для повышения эффективности рекомендуется использовать параметры по умолчанию для графики M1 (см. скриншоты). Вы можете изменить настройки для других таймфреймов. Пример использования этого индикатора: если золото пересекается с синим вниз, а золото и синий находятся под серым, эт

Каналы + Индикатор S & R (CSRI)
Индикатор определяет 3 канала (Большой, Средний, Малый) в зависимости от диапазона в барах на текущем периоде времени и пары / инструмента. Он может определять уровни Поддержки и Сопротивления в любом выбранном канале. Кроме того, для Большого канала могут быть построены уровни Фибоначчи. Все линии и уровни могут быть настроены по цвету и ширине.
Определить уровни Поддержки и Сопротивления для любого канала:
IdentifySupportAndResistanceLevels - определить уров

Welcome all to the famous Gann's "Square Of 9"!! This method was used by one of the best traders in the history, a person who made his way among the top traders. An "Holy Grail" for whoever wants to learn trading. The "Square of 9" was used by this genius to find the market's future supports and future resistances. Nowadays is possible to find them with just a click, thanks to softwares. At the time Gann was using just his set of square and goniometer!! Gann describes, partially, the tecnique on
MetaTrader Маркет - единственный магазин, где можно скачать демоверсию торгового робота и подвергнуть его проверке и даже оптимизации на исторических данных.
Прочитайте описание и отзывы других покупателей на заинтересовавший вас продукт, скачайте его прямо в терминал и узнайте, как протестировать торгового робота перед покупкой. Только у нас вы можете получить представление о программе, не заплатив за неё.
Вы упускаете торговые возможности:
- Бесплатные приложения для трейдинга
- 8 000+ сигналов для копирования
- Экономические новости для анализа финансовых рынков
Регистрация
Вход
Если у вас нет учетной записи, зарегистрируйтесь
Для авторизации и пользования сайтом MQL5.com необходимо разрешить использование файлов Сookie.
Пожалуйста, включите в вашем браузере данную настройку, иначе вы не сможете авторизоваться.