Смотри обучающее видео по маркету на YouTube
Как купить торгового робота или индикатор
Запусти робота на
виртуальном хостинге
виртуальном хостинге
Протестируй индикатор/робота перед покупкой
Хочешь зарабатывать в Маркете?
Как подать продукт, чтобы его покупали
Новые технические индикаторы для MetaTrader 4 - 55

DESCRIPTION
The CHAOS INDICATOR has been developed to be used for the TRADING STRATEGY OF CHAOS, as described in the book. The book is in italian language only and can be obtained only on my website indicated below.
DATAS COLLECTED AND SHOWN ON GRAPHS
The CHAOS INDICATOR apply easily to any graph and any asset, and it is a TRADING FACILITATOR, as it identify immediately the following items on any graph: - The GP (= RIGHT PRICE) i.e. the price to which the asset should be attracted within 24 ho

Индикатор тренда Mechanism Trend - это гибридный индикатор, показывает моменты для входа в рынок стрелками. Данный индикатор был создан на основе оригинальных индикаторов поиска экстремумов, индикатор хорошо подходит для определения разворота или большого резкого рывка в одну из сторон.
При смене тренда, индикатор Mechanism Trendиспользует цветовую сигнализацию: зелёный - при смене с нисходящего на восходящий, а красный - наоборот, на нисходящий. Использовать индикатор можно при входе в рынок

Flow Trend Flow trend is designed to detect the market trend with special calculation and a combination of Bolinger band and statistical moving period
to detect the market trend without frequency change and fault.
This indicator is designed with simple parameters to use fast and easy and helpful tools to trade in a pure direction and set your SL/TP with this indicator cloud system.
FREE

This indicator provides several drawing tools to assist in various methods of chart analysis.
The drawings will keep their proportions (according to their handle trendline) across different chart scales, update in real time, and multiple drawings are supported.
#
Drawing Option
Description
1 Grid box draggable boxed grid, user defines rows x colums, diagonal ray option 2 Grid partial or fullscreen grid, sized by handle line 3 Grid flex a diagonal grid, sized and sloped by handle line
4 Cyc

Market Profile 3 MetaTrader 4 indicator — is a classic Market Profile implementation that can show the price density over time, outlining the most important price levels, value area, and control value of a given trading session. This indicator can be attached to timeframes between M1 and D1 and will show the Market Profile for daily, weekly, monthly, or even intraday sessions. Lower timeframes offer higher precision. Higher timeframes are recommended for better visibility. It is also possible t
FREE

Данный индикатор создан для тех людей, которые хотят торговать и зарабатывать на любых инструментах и таймфреймах .Индикатор выдает очень хорошие точки,для входа в рынок,торговать очень просто,стрелки покажут,когда надо открывать сделки,установил и торгуй не о чем не думая,стоп-лосс и тейк-профит,устанавливайте каждый сам,все зависит от вашего стиля торговли,кто то скальпирует а кто то держит сделки по несколько дней.В тестере стратегий индикатор,просто физически не может,показать точные результ

Relative Volume or RVOL is an indicator that averages the volume of X amount of days, making it easy to compare sessions volumes.
The histogram only has 3 colors:
Green - Above average volume
Yellow - Average volume
Red - Below average volume
The default setting is 20 days, which corresponds more or less to a month of trading.
With the data obtained from this indicator you can better gauge the commitment behind a move. For example, you will be better equipped to judge if a breakout of a r
FREE

Hello all. This indicator helps you to open a trade, when break out occurred, also you can add to your position and ride it if trend continued. I use it on 1-5 min chart, as you can use short stop loss. Also profit target should be small as well. It is better to enter few small position, so you can book some profit early and ride the rest for bigger gains. Look at the past to have a plan. Enjoy.
FREE
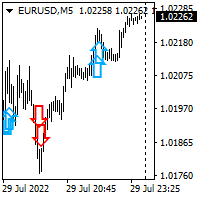
Hello all. This indicator helps you to open a trade, when break out occurred, also you can add to your position and ride it if trend continued. I use it on 1-5 min chart, as you can use short stop loss. Also profit target should be small as well. It is better to enter few small position, so you can book some profit early and ride the rest for bigger gains. Look at the past to have a plan. Enjoy.
FREE
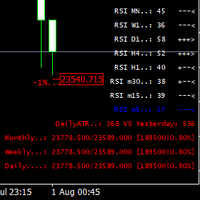
This indicator was created most for personal use. I decided to look up the last 3 bars of RSI, it is good for scalping or for weekly trading and looks as universal fx-toy. In menu you can turn on daily percentage gain info, it is good for crypto as for me, weekly and monthly gains also included as informers. Short ATR helps to determine when price was stopped and entry for pulse pump/dump. The filter of numbers of RSI can be tuned for overbought/oversold values with colors you needed. Exam
FREE

A useful dashboard that shows the CCI values for multiple symbols and Time-frames.
It can be easily hidden/displayed with a simple click on the X top left of the dashboard.
You can input upper and lower CCI values and the colours can be set to show when above/below these values. The default values are 100 and 30-100 There are also input colours for when the CCI is positive or negative (but not exceeding the upper/lower levels
Symbols and time-frames are input separated by commas.
Symbols
Divergence is one best ways to trade the financial market as it is a leading indicator of price action that detect high probability reversal and continuation setups. The AlgoKing Divergence Detector is an RSI and Stochastics Indicator with Divergence Detection. Features Hidden Divergence for trend continuation. Standard or Normal Divergence for trend reversal. Screen Alerts. MetaQuotes Notifications. Email Notifications. RSI Indicator built in. Stochastics Indicator built in. Types of Divergen
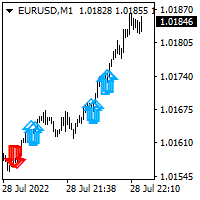
This indicator helps you to build position and profit when market turns in your favor. You will build your full position by trading many small position. Once blue arrow appear on the chart, you could add long position. Once red arrow appear on the chart, you could add short position. I personally spread my full size position in to 5-10 small position. I use small target of 2-5 pips on eurusd pair.

Long term stats is a trend indicator. As the name suggests, it computes long term running average, standard deviation and min/max values Average and standard deviation are plotted on the graph and deviation value is taken as input parameter (similarly to bollinger bands). Historical minimum and maximum are plotted on the graph and updated for each bar, considering historical time series slope. (this is to somehow account for inflation/deflation) Can be used as filter for signals, as trigger to
FREE

Линии сопротивления скорости - м ощный инструмент для определения тренда и линий сопротивления. Индикатор строит линии с использованием экстремумов графика и специальных математических формул. Индикатор можно использовать для определения направления тренда и точек разворота. <---------------------------->
Параметры индикатора: "Depth of search" - глубина (в барах) поиска экстремумов графика "Back step of search" - минимальное расстояние (в барах) между экстремумами "Deviation of price" - допус
FREE

UR максимумы и минимумы
UR Highs&Lows проводит глубокий анализ движения цены и ее волатильности и создает канал, внутри которого движется цена. Этот канал теперь движется как осциллятор и на него накладывается отклонение цены, чтобы сигнализировать о потенциальном истощении и возможных разворотах.
Преимущества использования UR Highs&Lows:
Нет параметров У вас есть 3 линии, которые описывают движение цены: белая линия, которая является средней ценой, и синие линии, которые являются ее экстр
Binaripex - индикатор для бинарных опционов. Индикатор показывает стрелкой на графике, в какую сторону пойдет цена в ближайшее время. По нашим статистическим данным в 95% случаев, цена в ближайшее время (от 1 до 5 минут на малых таймфреймах) пойдет выше или ниже указания стрелки. Это позволяет с высокой эффективностью применять данный индикатор для торговли на бинарных опционах. Так же индикатор на графике указывает возле каждой сделки на какое именно расстояние цены пошла в нужном направлении.
Эта программа сделает анализ нескольких таймфреймов более удобным.
Это поможет синхронизировать все графики на разных графиках синхронизации таймфреймов, чтобы отображать один и тот же символ, тот же определенный период времени и синхронизация объектов чертежа Показать на всех диаграммах одновременно
Поддержка синхронизации объектов: вертикальная/горизонтальная линия, линия тренда, прямоугольник, стрелка, коррекция Фибоначчи
Дополнительная функция: оповещение о линии тренда
Как им пользоват
FREE

Индикатор относится к средствам вероятностного анализа. Прогнозирование выполняется методом Монте Карло совместно с математической моделью нейрона. Но, моделирование образцов для метода производится не искусственно, а поставляется из оригинальной "натуры", то есть из истории. Количество образцов и детальность их моделирования достигается использованием младшего (относительного текущего) таймфрейма.
Алгоритм работы индикатора :
В общих чертах алгоритм сводится к тому, что индикатор обучается
!! FLASH SALE !! Over 80% off !! For ONE week only. Now only $47 - normally $297! >>> Ends on 30 June 2023 - Don't miss it!
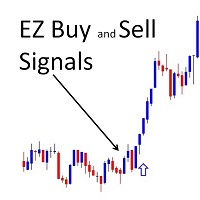
Buy and Sell Signals Directly Onto Your Charts. It couldn't be EZ-er! Aslo Gives Alerts – On Your MT4 To Your Phone To Your Email.
Does not repaint! This couldn't be EZ-er to use - just drag it onto your chart (any timeframe, any pair) set the time of day you want signals and where you want alerts, and wait for the signals. Spreads from 0.1pip RAW/ECN Accoun

It could help to calculate Risk-Reward easily before placing a BUY-SELL position. TradeSizeCalculator is a Multi-Tasking Calculator. It will calculate the others when we define the value in one of the columns. Stoploss, risk percentage, risk-money, lot size, take-profit , reward-money, and reward-ratio. Depending on which value is changed. All values in the columns are editable. Also, we can get those calculation results by drag-drop the stop-loss/take-profit line. Parameter: The inputs below ar
Reminder: After purchasing the unlimited version of this indicator send me the proof and I will add you to my private group so that you join the community and continue to learn more about this tool and grow together with other traders. You will also learn the strategy that will change your trading story! Dear Traders I am so glad to introduce my forex trading product called "Day Traders Master Board". This tool is designed for serious traders of any trading strategy. My goal is to help trader b
For Nasdaq trading, the most important principle is to know the trend of the fund.
This indicator with 6 green and red lights provides you with the daily path of this important indicator.
This indicator has been tested for 6 months and has a win rate of over 85%.
Be sure to contact me before purchasing to get the necessary instructions on how to use and set up this indicator.
You should use a broker that has dollar index, vix, and commodities. MT5 Version
You can contact us via Instagram, Teleg

Golden section price action indicator - is a trend-scalping complete system with enter and exit points. Indicator is based on most powerfull price action japan patterns that are filtered by volume, volatility, market phase. Pattern is not a simple combinations of candles. Patterns must have "weight" to move market in right direction. "Weight" - is the summary of pattern's volume, the size of pattern candles according to last average volatility and ofcourse pattern must appear in correct market p
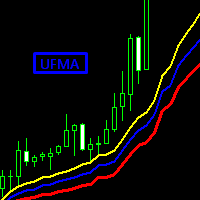
NEW FEATURE ! Now you can select the option of two MA to see the amazing MA cross of Two UFMA.
With the fast reaction of this MA you can avoid most of the false signals of a normal MA Cross.
New formula to calculate moving average, it quickly adapts to the price but maintains the analysis to determine if a change in trend is necessary.
Input Parameters:
Period: used to select the number of bars to use for calculations. Mode: Mode to use for the calculation of the moving average > SMA, EMA, S

Identification of support and resistance areas
A useful indicator for traders
completely free
Can be used in all symbols
Can be used in all time frames
It has three different trends: short term, medium term, long term
Settings:
Clr1,2: You can change the color of the lines
Type Trend: You can determine the trend
Message me for questions, criticism and suggestions
FREE

Th3Eng HistoMaster indicator Free Histogram Indicator to detect the current trend direction. The indicator is based on CCI indicator. Also draw arrows when it detect the trend is strong buy or strong sell, with Alerting system (Popup with sound, Email alerting and mobile notification). Also draws a dashboard shows all Time-Frames' current signal.
Requirements
works with all pairs, stocks, CFDs and crypto currencies. works with all Spreads works with all Account types works on all Time-Frames
FREE

Hypothetical trend line display
Distance from the trend line
Can be used in all symbols
Can be used in all time frames
An interesting indicator for predicting small waves
The greater the distance from the trend line, the more likely it is to return to the trend line
Settings:
The first three(osic 1,2,3):
are the same as the settings of the zigzag indicator
The bigger these numbers are, the bigger the trend lines and the longer the trend
Back Show:
The number of candles displayed
Clr1,2:
The
FREE

Magic Lines MT4 is an indicator which can be categorized as trend, levels and channels type. It draws a colored line which is colored in green and red depending where last close is. The value at the current open bar should not be taken into account. This part of the indicator can give us a sense whether it is trending up or down or its going sideways. Magic Lines indicator also draws blue top and bottom levels which can be taken into account for breakouts and false breakouts. A sideway zone shou
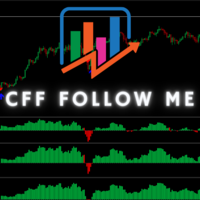
CFF Follow Me
*** 10 Copies left for next price $613***
* Entry signals without repainting or delays * Error-free opening of trades * Provides signals for any direction sell & Buy * Provides multiple timeframes on a single chart * Colored Histogram based on the market direction * Arrows entry signals
How does the CFF Follow Me Works?
Our CFF Follow Me trading system based on a very accurate "Trend-Following" Trading Strategy. Here's how to Start using our Syste
AI Signal is an indicator that is a ready to made scalping system that doesn't repaint
Instructions: Load indicator. Use arrows as entries in trends and stay out of sideways markets. Trade with the larger trend and trade only active volatile hours Buy blue arrow above yellow and exit at red arrow or at discretion. Sell red arrow below yellow and exit at blue arrow or at discretion.
Easy to follow and is based on trends. The indicator works on all time frames and assets. Use at your own d

Indicator help you recognize trend quickly ( recommended to use TF M30-Daily ) Parameters: Alert when have signal Push Notification to MT4 mobil2 Benefits Easy to use. input parameters is simple The ability to use as filter for any strategy. It work on stock, index, oil, gold, and on all time frames. It has the function of push-notifications, and sound alerts. Importance : Non Repainting Indicator

Diagnosis of major and minor pivot
Trend detection
with many signals
Can be used in all symbols
Can be used in all time frames
Settings:
Back Show: The number of candles it displays
If you need any adjustments, or have any questions or suggestions, message me
How to trade:
Blue: sell signal
Red: buy signal
Blue and red at the same time: no signal
Exit signal: Opposite signal

Forecasting the future by combining trend and average price
with many signals
Can be used in all symbols
Can be used in all time frames
Settings:
BackShow: The number of candles displayed
Osi: Main setting, the larger the number, the longer the trend
If you need more settings, or have any questions or suggestions, message me
How to trade:
Blue: sell signal
Red: buy signal
Blue and red at the same time: no signal
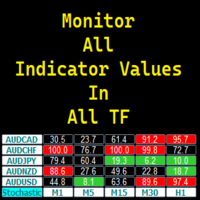
ALL in ONE Indicator Display Indicator values in all Timeframes Display Multiple Symbols/Pairs Fully customizable Click any value/box to open the chart of the corresponding symbol and timeframe Attach multiple instance of the program to display other indicator values Flexible Dashboard Positioning in chart You may request more indicators or additional feature for future updates!

NOTE: NEXT PRICE WILL BE 550$ Dear Trader I hope you have been eagerly waiting and looking for a tool to improve your trading. I am so glad to introduce my other product to you called Trend Shooter Index. The main goal of this tool is to help traders shoot the trend (target the trend) from the bottom or from the top of the trend for maximum profitability. How is the Indicator designed
This tool is designed to show the following Red arrows pointing down for sell signals. Blue arrows pointing up f

Forex trading support timer: - This is an indicator that supports a trader's trading process. - Before placing a BUY or SELL order, it is advisable to observe what the current time is like, to get the best position when trading. Function of indicator: - Display information about candle closing time of different timeframes (M1,M5,M15,H1), best used when Scalping. - Show market spreads. - Show TimeZone Trading. - Displays the remaining time of a session.
FREE

UR TrendИсчерпание
UR TrendExhaustion - лучшее решение для трейдеров, которые не хотят иметь дело ни со значениями параметров, ни с другими настройками - оно простое и визуально понятное для всех.
Преимущества использования UR TrendExhaustion:
Нет параметров У вас есть 3 линии, которые лучше всего описывают то, что происходит на графике: линия истощения тренда, линия китовых денег и линия розничных денег. Интерфейс демонстрирует исчерпание любой линии на обоих крайних значениях (красные об

DYJ Transcript Dragon основан на системе отслеживания тенденций и обратной тенденции. ди - Джей хамелеон - указатель высокой вероятности. этот показатель, в котором используются уникальные смешанные показатели, сочетает сложные показатели с суждением пользователя. этот показатель является одним из самых передовых алгоритмов пересечения Ма и дисперсии. Этот индикатор показывает монохромную стрелку направления и тенденцию прокрутки шаров, указывая тем, кто продает товары, лучшее место для входа и

UR DivergenceSpotter
UR DivergenceSpotter — это результат многолетнего опыта, и иногда самые простые способы — самые лучшие. Есть хорошая корреляция между несколькими индикаторами, но когда они не совпадают - цена пытается "перестроиться" - и именно в этот момент мы получаем сигнал с UR DivergenceSpotter.
Преимущества использования UR Divergence Spotter:
Нет параметров Не перерисовывается после создания свечи Сигналы, когда сигнал больше не действителен (имеется в виду, что вы можете удерж

УР VolumeTrend
UR VolumeTrend — самый четкий индикатор объема, показывающий продолжающийся тренд с точки зрения объема. Отлично работает с другими индикаторами, такими как UR TrendExhaustion, чтобы сигнализировать о локальных максимумах и минимумах.
Ограничено всего двумя параметрами — чем выше значения, тем дольше будут отображаться тренды. Экстремумы градиента показывают возможное истощение объема, чтобы поймать потенциальный разворот. Две линии - Тренд объема и Среднее значение. Лучшее п
" Scalping trading strategy " - индикатор создан для торговли по системе скальпинга. " Scalping trading strategy " показывает на графике стрелкой куда сейчас пойдет цена. После того, как индикатор нарисовал стрелку, цена пойдет в сторону стрелки минимум на 20 пунктов. Этого нам достаточно, чтобы эффективно торговать. " Scalping trading strategy " не перерисовывает свои сигналы. У индикатора есть много разных режимов работы. Он может рисовать стрелку как в начале новой свечи, так и в конце све

indicators to facilitate analysis based on Oma Ally's BBMA strategy by displaying CSAK (CSD), CSM and Extreme labels on the chart 1. Displays the Bollinger Band line 2. LWMA 5-10 High and Low 3. EMA 50 4. Fibonacci 5. MHV . area 6. Alert & Show labels BBMA consists of the use of 2 indicators: Moving Averages Bollinger Bands BBMA consists of 3 types of entries: Extreme MHV Re-Entry Moving Average Settings: There are 5 MAs used in the system: 2 High Moving Averages, 2 Low Moving Averages and
FREE
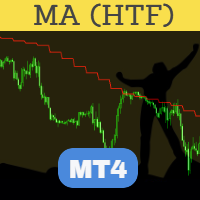
Совершенный MA (Скользящее среднее) HTF (Старший таймфрейм), пожалуй, самый продвинутый и надежный индикатор HTF. Высоко оптимизированный с точки зрения исполнения индикатор поставляется со стандартными настройками индикатора MA, который поставляется с платформой MT4. Поместите индикатор на график любого таймфрейма. Вы можете выбрать больший таймфрейм во входных данных индикатора. Один и тот же индикатор можно использовать на графике несколько раз для построения MA с разных таймфреймов или для р
FREE

Price pivot points H1 - индикатор который показывает точки разворота цены на таймфрейме H1 с точностью до 95%. 95 сигналов со 100 точно укажут место разворота цены в обратном направлении. Индикатор не перерисовывает свои значения. Подходит для торговли на любой валютной паре. Может использоваться как для скальпинга внутри дня, так и для долгосрочной торговли. Price pivot points H1 показывает сигналы в виде стрелок. Когда цена будет разворачиваться в обратную сторону, индикатор нарисует на график

This is a Multi pair and Multi time frame dashboard. The founder of the system is Mr. Oma Ally, which is a system based from Bollinger Band and Moving Average(BBMA). BBMA consists of the use of 2 indicators: Moving Averages Bollinger Bands BBMA consists of 3 types of entries: Extreme MHV Re-Entry Rejection EMA50 This Dashboard Help you to scan current Extreme, Reentry setup, Rejection EMA50 and also MHV How to read signals:
find the same color in 3 different timeframes in succession
For exampl
FREE

Professional Support&Resistance Indicator. This indicator is primarily intended for professional use by brokers. There are countless options to choose from and it is one of the best tools in the stock market today. The indicator is optimized for use with EAs.
For programmers to retrieve output index value is for MQL4; (EXAMPLE)
bool buySNR=false,sellSNR=false;
char count=100;
char limit=1;
char dist=3;
for(short cnt=0;cnt<=count;cnt++)
{
double snr_middle=iCustom(NULL,TF_,"::Indicators\\SN
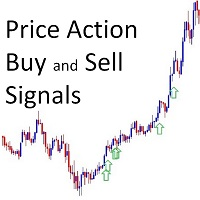
Buy and Sell Arrows On The Chart According To Price Action Sends Alerts On MT4 To Your Phone To You Email
Does NOT repaint. Works on any pair, any timeframe.
10 Activations allowed so you are free from limitations. MT5 Version here . For spreads from a tiny 0.1pip RAW/ECN Accounts, click here . Check out my Waka Esque EA signal here: >> High Risk Settings or Medium Risk Settings .
When you get a signal, all you need to do is check the previous structue highs and lows to use as your

Fractal Structures Breakout Trader !!SPECIAL PRICE FOR THE FIRST 10 COPIES!!
A next generation powerfull indicator which brings a new approach to fractal theory Indicator tries to scan and find the fractal breakouts. Momentum, price action and harmonic calculations are also used to complete the algo. Advantages: No Repaint Works on all chart timeframes. Works for every instrument including Currency Pairs, Gold, Oil, Commodities, Indices, Stocks and Cryptocurrencies. Easy to use. User and CPU fr

This indicator provides common shapes as drawing object options. The shapes are rotatable, resizable, draggable, and will keep their proportions (according to their handle trendline) across different chart scales. Multiple drawings are supported.
Shapes: Square Rhombus
Triangle (quadrilateral & isosceles) Circle (grid, overlapped grid, flexi grid, rotatable grid, concentric circles) Features: rays (all object edges will be rays) show/hide each individual drawing type, or all delete last drawn ob
FREE

The Spots Indicator can be used for Entering and Exiting your trades based on the common candlestick patterns such as: engulfing, hanging man, doji etc. It is designed to publish desktop and mobile notification every time a signal is triggered. However, it is worth noting that this indicator is recommended to be used with other indicator for confirming the entries. It is best to use it with the Investment Castle Trend Lines indicator and the Supply and Demand indicator
FREE
Perfected RSI (Relative Strength Index) HTF (Higher Time Frame) is perhaps the most advanced and reliable HTF indicator. Highly optimized in terms of execution, the indicator comes with standard settings of the RSI indicator which is supplied with the MT4 platform. Place the indicator on the chart, any timeframe. You may select a higher time frame in indicator inputs. The same indicator can be used on a chart multiple times to draw RSI from multiple timeframes or for different RSI period values
FREE

This is a regression tree indicator for MT4/MT5.
This indicator classificate nodes on the time period so that the deviation becomes smaller,
and displays regression line and channel for each node.
It's free!
Attached CartDemo.ex4 and CartDemo.ex5 is a Demo version and has the following limitations:
Can't use HighSpeed method (default method is RandomForest)
Maximum number of bars is 260 (increase from 200)
There is no expiration date and can be started many times, but it stops after an hour.
FREE

Robin Scalper indicator is calculated based on advanced algorithm of several indicators.
The algorithm provides highly reliable entry points, and its simple settings allow using it for all symbols, time frames and trading styles.
Signals are generated at the closing of a bar and are not repaint .
Setting Parameters : Indicator Name - Indicator Name. Trend Period - Trend Period of the indicator. Filter - Signal smoothness. EMA fast Filter - Fast EMA filter. EMA slow Filter - Slow EMA filt
Perfected Stochastic HTF (Higher Time Frame) is perhaps the most advanced and reliable HTF indicator. Highly optimized in terms of execution, the indicator comes with standard settings of the Stoch indicator which is supplied with the MT4 platform. Place the indicator on the chart, any timeframe. You may select a higher time frame in indicator inputs. The same indicator can be used on a chart multiple times to draw Stoch from multiple timeframes or for different Stoch values. A must-have tool t
Индикатор iVeles_Trend_X_II - использует специализированный расчет текущих цен графика. Очень качественно и своевременно показывает смену направления, более того, отображаемая цена индикатора может быть использован в качестве уровня принятия решения. Работает качественно на любом ТФ и с любым инструментом. Параметры: period - период расчетов average - усреднение МА method - применяемый метод shift - сдвиг показаний
Индикатор iVeles_Perfect_Oscilator является опережающим и одним из самых лучших осциляторов на сегодняшний день, использует специализированный расчет текущих цен графика. Очень качественно и своевременно показывает смену направления, очень точный подход к уровням перекупленности и перепроданности, что позволяет своевременно принять решение по сделке. Работает качественно на любом ТФ и с любым инструментом. Параметры: period_Osc - период расчетов average_Osc - усреднение МА method_Osc - прим
AlgoKing Chandelier Exit Indicator (MT4)
The Chandelier Exit Indicator is a volatility based indicator that maximizes returns using the Average True Range (ATR) value and the highest high or lowest low of a period. Benefits Should be used as a trailing stop. Helps you exit a position when you have a respectable profit. Identifies a high probability of a trend reversal when the price moves against the prevailing trend by a distance equal to 3x the average volatility. Join the AlgoKing Lightning

极大的提升了交易感官,一目了然的走势展示,简洁高效。 极大的突出展示了行情的趋势脉络,跟随时间周期适应变化,替用户交易者研判了行情走势,简洁高效 同时我们还提供了主窗口和副窗口的展现,有需要可以联系我作者本人,感谢支持。 像传统的renko,又不是传统的renko,技术在发展,同样的砖图可以有不一样的绘制和计算展现。 希望可以帮到大家的交易,再次感谢。
极大的提升了交易感官,一目了然的走势展示,简洁高效。 极大的突出展示了行情的趋势脉络,跟随时间周期适应变化,替用户交易者研判了行情走势,简洁高效 同时我们还提供了主窗口和副窗口的展现,有需要可以联系我作者本人,感谢支持。 像传统的renko,又不是传统的renko,技术在发展,同样的砖图可以有不一样的绘制和计算展现。 希望可以帮到大家的交易,再次感谢。

This Indicator is a very Simple Method to make profit from the market! it has two arrow directions up and down. you can easily buy when you see up arrow and close it when you see down arrow. you can use it for Binary Options too! you also can use it with other indicators like Heiken Ashi and Ichimoku to make a complete System of Trading. it has just two Input Options: nBars: The Number of Candles you want to see the Signals for. ShowPanel: to display or not to display the Panel DoAlert: to Send

Indicator Support and Resistence plain in your chart seven lines; Red line=Resistence 3. Red line=Resistence 2. Red line=Resistence 1. Yellow line= Pivot. Green line= Support 1. Green line= Support 2. Green line= Support 3. adattable in all timeframe (minute 1, minute 5, minute 15, minute 30, Hour 1, Hour 4,Day 1,Week 1,Mounth 1); Buy under support and sell over the resistence;

This is another Arrow Indicator to show the instant direction of the Market. it's no repainting and no lagging. you can easily trade by it's direction or use it on your own System. the later is recommended! you can use it on Automatic Experts too. it's input parameters are consists of: nBars: Number of Bars to be checked EnableAlerts: to send Alert messages when get new Signal. EmailAlerts: to send you Email for new Signals you can simply use it on any Symbol or Time Frame after checking for it'
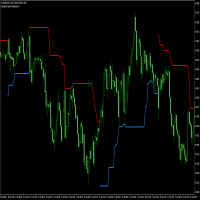
TP Trend Bars Indicator is a trend following technical indicator which is based on price action focusing on the swing highs and lows.
This indicator plots 2 types of lines. The first line is a dotted line, represnting the short-term trend. The second line is a solid line, representing the long term trend
Lines which are below the price action when on a bullish trend and above the price when the trend is bearish The solid line also changes color to indicate trend direction
индикатор свечного счетчика этот индикатор считает свечи, которые есть на графике любого таймфрейма бесплатный барный счетчик для загрузки на mt4 счетчик свечей подсчитывает количество свечей на большом графике с помощью этого счетчика свечей вы можете выполнять автоматический подсчет свечей бесплатный индикатор количества свечей для автоматической загрузки и подсчета баров bar counter to count the bars count candle counter indicator mt4 count candle счетчик свечей для MT5 Если вам интересен это
FREE

Индикатор Cycle Identifier для MT4 генерирует отфильтрованные сигналы ценового действия, чтобы помочь трейдерам определить, когда условия подходят для открытия позиций на покупку и продажу.
Индикатор Cycle Identifier MT4 — отличный выбор пользовательского индикатора как для краткосрочных, так и для долгосрочных трейдеров. Cycle Identifier MT4 генерирует отфильтрованные сигналы ценового действия, чтобы помочь трейдерам определить, когда условия подходят для открытия позиций на покупку и продажу
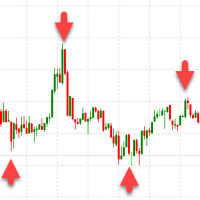
Scalping trader - индикатор создан для внутридневной торговли (скальпинга). Не перерисовывает стрелки. Показывает на графике стрелками возможные развороты цены. Точность сигналов примерно 96%. То есть, в 96% после появления стрелки на экране, цена пойдет в обратном направлении минимум на 40 пунктов по паре GBPUSD. Торговая стратегия очень простая. Ждем появление стрелки на графике. После того как появляется стрелка, открываем ордер в направлении стрелки. ТейкПрофит ставим 40 пунктов. СтопЛосс ст

VIP сигнал для бинарных опционов.
Этот индикатор был создан специально для бинарных опционов. Настроен на прибыльную работу в бинарных опционах.
Попробуйте этот индикатор, если хотите прибыльно работать на бинарных опционах. Условия торговли очень просты. Ждем указания направления. Открываем сделку на текущем таймфрейме по направлению.
< < < Индикатор не перерисовываются > > >
Многие пользователи уже оценили его положительно. Результаты вас тоже удивят.
По результатам тестирования этот ин

Provides Regression Channel on the current chart. Combined by Trend of Moving Averages and Multi timeframes Oscillator Indicators: CCI, RSI, Stochastic, and MACD with specific working logic . It could make us easier to identify swing high-low as an entry point, the retracement area while following the current trend. Consists of 2 types of signal, main and secondary. The main signal will draw very clearly triangle and lines on the chart with the word " BUY" or 'SELL'. and the secondary is the sta

What is the Overlay Chart Indicator? The Overlay Chart indicator is exactly as its name suggests. It is a custom technical indicator which overlays another price chart over the current price chart window. It allows traders to overlay another currency pair over one pair which allows them to compare price movements and the characteristics of price action. It then plots a grid to indicate the price of the overlaid currency pair for better reference. It also plots the open, high, low, and close pric

This Beautiful Real Entry indicator is designed for signal trading. This indicator generates trend signals.
It uses many algorithms and indicators to generate this signal. It tries to generate a signal from the points with the highest trend potential.
This indicator is a complete trading product. This indicator does not need any additional indicators.
The indicator certainly does not repaint. The point at which the signal is given does not change.
The indicator has a pips counter.
MetaTrader Маркет - лучшее место для продажи торговых роботов и технических индикаторов.
Вам необходимо только написать востребованную программу для платформы MetaTrader, красиво оформить и добавить хорошее описание. Мы поможем вам опубликовать продукт в сервисе Маркет, где его могут купить миллионы пользователей MetaTrader. Так что занимайтесь только непосредственно своим делом - пишите программы для автотрейдинга.
Вы упускаете торговые возможности:
- Бесплатные приложения для трейдинга
- 8 000+ сигналов для копирования
- Экономические новости для анализа финансовых рынков
Регистрация
Вход
Если у вас нет учетной записи, зарегистрируйтесь
Для авторизации и пользования сайтом MQL5.com необходимо разрешить использование файлов Сookie.
Пожалуйста, включите в вашем браузере данную настройку, иначе вы не сможете авторизоваться.