Смотри обучающее видео по маркету на YouTube
Как купить торгового робота или индикатор
Запусти робота на
виртуальном хостинге
виртуальном хостинге
Протестируй индикатор/робота перед покупкой
Хочешь зарабатывать в Маркете?
Как подать продукт, чтобы его покупали
Новые технические индикаторы для MetaTrader 4 - 51
Мониториг текущей силы 8 основных валют Моя Многофункциональная утилита 1: содержит более 66 функций, включая этот индикатор | свяжитесь со мной если у вас есть вопросы | Версия MT5 Индикатор отображается в отдельном окне, его можно переместить в любое место на графике. В настройках ввода вы можете настроить: Тема интерфейса : темная / белая; Префикс и суффикс, если валютные пары у вашего брокера их имеют:
(например, если символ — "EURUSD .pro ", пожалуйста, установите " .pro " к
Зоны спроса / предложения: важные области, откуда цена многократно отражалась в прошлом. Многофункциональная утилита: 66+ функций, включая этот индикатор | Свяжитесь со мной для любых вопросов | Версия MT5 Индикатор показывает, где цена потенциально может снова развернуться. Обычно чем чаще цена отклонялась от уровня, тем он более значим. В настройках ввода вы можете настроить: Включить или выключить слабые зоны; Показать или скрыть описание зоны; Размер шрифта; Установить основной цве
Абсолютная волатильность для каждого дня за последние 4 недели Моя #1 многофункциональная утилита: содержит более 66 функций, включая этот индикатор | Свяжитесь со мной если у вас есть вопросы | Версия MT5 Индикатор отображается в отдельном окне, его можно переместить в любое место на графике. В настройках ввода вы можете настроить: Тема интерфейса : темная / белая; Метод расчета: цена, пункты, проценты, % изменение;
Размер панели Размер шрифта

Gold Scalping Indicator - индикатор для внитридневной торговли на золоте XAUUSD. Индикатор определяет точки разворота цены и рисует сигналы на графике. Так же индикатор отправляет сигналы на телефон. Когда индикатор рисует красную точку, это означает, что цена возможно развернется сейчас вниз. Когда индикатор рисует синюю стрелку, это означает, что цена возможно развернется сейчас вверх. Учитывая эту информацию, каждый трейдер, сможет построить эффективную торговую систему на золоте. Золото очен

Индикатор запаса хода, означает среднестатистическое дневное движение цены. Для удобства визуально отображается на графиках, но с таймфреймом H4 и ниже. Индикатор перерисовывается ежедневно и учитывает гэпы. Дополнительная пунктирная линия означает 80% пройденного дневного движения. Важный инструмент в арсенале профессионального трейдера или того, кто хочет им стать. PrimeTools - это серия продуктов предназначенных для правильной и профессиональной торговли. [ PrimeTools Levels | PrimeTools Rang
FREE

XFlow показывает расширяющийся ценовой канал помогающий определять тренд и моменты его разворота. Используется также при сопровождении сделок для установки тейк-профит/стоп-лосс и усреднений. Практически не имеет параметров и очень прост в использовании - просто укажите важный для вас момент истории и индикатор рассчитает ценовой канал. ОТОБРАЖАЕМЫЕ ЛИНИИ
ROTATE - толстая сплошная линия. Центр общего вращения цены. Цена делает широкие циклические движения вокруг линии ROTATE. Положение цены окол

Precautions for subscribing to indicator This indicator only supports the computer version of MT4 Does not support MT5, mobile phones, tablets The indicator only shows the day's entry arrow The previous history arrow will not be displayed (Live broadcast is for demonstration) The indicator is a trading aid Is not a EA automatic trading No copy trading function
The indicator only indicates the entry position No exit (target profit)
The entry stop loss point is set at 30-50 PIPS Or the front hi

Having trouble marking where the various forex sessions start and end? Or perhaps your strategy requires you trade only in a specific session, then this is for you.
The session indicator shades the session you require in a certain color so that you can identify it easily. The sessions shown include: London session, New York session, Asian Session, Asian - London overlap and London - New York Overlap.
Difference source give varying time ranges for the various session, mostly differing by not mo
FREE
# 33% off - limited time only #
ChartSync Pro MT4 is an indicator, designed for the MetaTrader 5 trading terminals. It enables the trader to perform better multi-timeframe technical analysis, by synchronizing symbols and objects into virtually unlimited charts. Built by traders for traders! Telegram Premium Support - Dd you purchase the Chart Sync indicator and need a bit of help? Send us a screenshot with your purchase and your Telegram ID so we can add you to our premium support Telegram

TPM Cross (trend power moving cross) - is a trend following strategy based on custom signal points. Indicator consists from main custom moving chart line and trend power line. Indicator defines up and down movements by it's trend power and custom moving direction. When current market's trend looses it's power and opposite trend starts - power trend line crosses moving and indicator plots an arrow. Main indicator's adjustable inputs : movingPeriod - period of moving line trendPeriod - period

Impulse fractals indicator - is counter-trend oriented complex market fractal pattern. Market creates bull/bear impulse, trend starts, fractals on impulsed wave are an agressive pullback signals. Buy arrow is plotted when market is bearish and it's impulse showed up-side fractal, and sell arrow is plotted when market is bullish and it's impulse showed dn-side fractal. Main indicator's adjustable inputs : impulsePeriod - main period of impulse histogram filterPeriod - smoothes impulse accordi
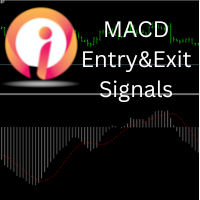
This indicator will show Entry and Exits using MACD and Moving average crossover. User can change settings to find best results from back testing. Profits and losses on candle close price is calculated and shown on screen of chart. Here any MACD settings and any Moving average crossover exit settings on various charts and various timeframes can be used. Watch video for few tests performed. Best wishes for trading.

This indicator shows the breakeven line level for the total number of open positions of the current symbol with P/L value and total volume. This indicator is helpful to decide the exit level when using a trading grid strategy. The style of the breakeven line is customizable to choose the color, line shape and font size of the positions description. Send mobile notification when crossing a positive P/L target
FREE

Wicks UpDown Target
Choppy movement up and down on the opening range every day. Trading breakouts on London session and New York session is recommended. Wicks UpDown Target is specialized in all forex pairs.
Guideline Entry Strategy Idea:
Step 1 - Breakout Forming (Warning! Trade on London Session and New York Session) Step 2 - Breakout Starting (Take Action on your trading plan) Step 3 - Partial Close your order & set breakeven (no-risk) Step 4 - Target complete Step 5 - Don't trade in Sto

Session Killzone Indicator
Indicator that helps you to identify the killzone times of both London and NewYork sessions which usually is the most times for high volatility and taking liquidity from the market. Killzone times are configurable through indicator parameters. The indicator adjusts the range of the killzones based on the daily trading range.
FREE
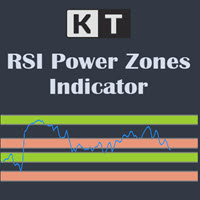
The KT RSI Power Zones divides and shows the movement of RSI into four different power zones to identify the potential support and resistance zones using the RSI.
Bull Support The bull support ranges from 40 to 50. The price is expected to reverse to the upside from this zone.
Bull Resistance The bull resistance ranges from 80 to 90. The price is expected to reverse to the downsize from this zone.
Bear Support The bear support ranges from 20 to 30. The price is expected to reverse to the ups

The BSI stands for Bar Strength Index. It evaluates price data using a unique calculation. It displays readings in a separate window. Many financial investors mistake this indicator for the Relative Strength Index (RSI), which is incorrect because the BSI can provide an advantage through its calculation method that the RSI indicator does not. The Bar Strength Index (BSI) is derived from the Internal Bar Strength (IBS), which has been successfully applied to many financial assets such as commodit

The KT Tether Line is a trend-following tool consisting of three indicators that work together to generate trading signals. It can correctly identify market trends while signaling trade entries. It was first introduced by Bryan Strain in the Stock & Commodities magazine in 2000 in "How to get with the trend and out at the end."
The Concept
When a market trend is confirmed, the most challenging part is determining the timing of the entries. This indicator alerts you to potential trend reversals
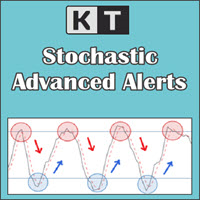
KT Stochastic Alerts is a personal implementation of the Stochastic oscillator that provide signals and alerts based on six custom events: Bullish Crossover: When Stochastic main line cross above the signal line. Bearish Crossover: When Stochastic main line cross below the signal line. When Stochastic enter in an overbought zone. When Stochastic exit from an overbought zone. When Stochastic enter in an oversold zone. When Stochastic exit from an oversold zone.
Features
A perfect choice for tra
A very good indicator for Experienced and Professional Traders. A practical approach to trading. Easy to understand. A helping tool for traders looking for price movements .
Signals: Signal Number 1: When yellow line which is a signal line crossing the zero line towards downward direction is a selling opportunity. Signal Number 2:
When yellow line which is a signal line crossing the zero line towards upward direction is a buying opportunity.

The Th3Eng Ninja indicator is based on an analysis of the right trend direction with perfect custom algorithms. It show the true direction and the best point of the trend. With Stop Loss point and Three Take Profit points. Also it provides a secondary entry points in dots arrows style. And Finally it draws a very helpful lines from entry level to TP1, TP2, TP3, SL levels or the reverse signal, and all current/old signals status.
How to use the indicator
No complicated steps , Just follow 2 si

This indicator takes input from the RSI, combined with a trend filter. Great for scalping. Does not feature any alerts and is best used manually. Settings: TrendFilterPeriod RSIPeriod Set these parameters to your preference. How to use: Attach to any chart with default settings. Can be used on any time frame. If used on lower time frames, check higher time frames too. Buy : - Wait for blue histo color to cross above level 50, then open buys. **Best results when checking the higher time frames to
That is my master piece invented new Forex indicator Copyright 2010 to 2100 (316009) for Sami A. Saydam. This indicator is showing the real Support and Resistance levels in dynamical ways as movable red lines with time, also works on all time charts' intervals. The price movements are strongly respecting those red lines and either confirmed break them or just touching them and can't break them up or down then move toward the right directions. This new techniques are the real alerting system ca

Support/Resistance Percent Rank
SR Percent Rank helps to see how many times the current close price has been in the past price range. SR Percent makes a loop over x bars into the past and calculates the percentage of times the current closing price has been between the high and the low price in the x bars before that. So we can determine if the current price is moving at supports or resistance that was formed in the past. I use the indicator when creating strategies with the StrategyQuant X pr
FREE
Индикатор Market Steps разработан и построен на основе корреляций времени/цены Ганна и оптимизирован по правилам Price Action для рынка Forex. Он использует концепции потока рыночных ордеров для прогнозирования потенциальных ценовых зон для большого объема ордеров.
Индикатор Уровней может быть использован для самостоятельной торговли или в качестве комбинации для фильтрации неверных сигналов других стратегий/индикаторов. Каждый трейдер нуждается в таком мощном инструменте, чтобы иметь на граф
M1 Arrow Scalping - показывает сигналы на периоде М1 , не перерисовывает точки входа и может работать на всех основных валютных парах + металлы (золото/серебро). Индикатор анализирует рынок с помощью алгоритмов определения ценовых закономерностей и показывает трейдеру точки разворота цены на графике. Красная точка показывает, что цена будет разворачиваться вниз, а синяя точка показывает, что цена будет разворачиваться вверх. Так же индикатор отправляет сигналы на телефон в виде PUSH уведомлений.

Индикатор автоматически рассчитывает сбалансированное значение цены. Он показывает в какую сторону и на сколько смещено сбалансированное значение цены в настоящий момент. Работает на всех таймфреймах, на любых валютных парах, металлах и криптовалюте. Можно использовать при работе с бинарными опционами. Отличительные особенности Не перерисовывается; Простая и быстрая настройка; Понятная интерпретация показаний; Работает на всех таймфреймах и на всех символах; Подходит для торговли валютами, метал
FREE

Индикатор построения уровней. Работает на нейронной сети и формализованный по профессиональным правилам построения горизонтальных уровней. Индикатор перерисовывает уровни ежедневно при открытии дневного бара и уведомляет при приближении цены к уровням или пересечении. Индикатор подходит как для профессионалов, так и для новичков, которые только недавно начали учиться торговать на рынке. PrimeTools - это серия продуктов предназначенных для правильной и профессиональной торговли. [PrimeTools Leve
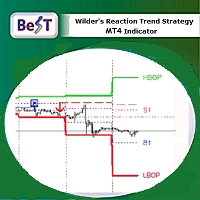
Best _Wilder’s Trend Reaction Strateg y is a Metatrader indicator that is based on the J.W.Wilder’s corresponding work as we can find it at his own legendary book:
“ NEW CONCEPTS IN TECHNICAL TRADING SYSTEMS ”(1978) and on pages 71-86/SECTION VII.
This strategy is both an anti-trend system (named as REACTION_MODE ) and a trend system (named as TREND_MODE ). The REACTION_MODE reverses at each Buy point and most Sell points while the TREND_MODE usually exits the market at a Trailing Stop.
This

Asterysc SL & TP Values Info - это индикатор, который позволит вам наглядно увидеть на графике потенциальную прибыль/убыток, который вы можете получить, если ваша сделка коснется TP или SL.
Он также позволит вам увидеть общий накопленный TP/SL всех открытых сделок очень простым способом на каждом графике.
Вы также сможете быстро визуализировать текущую просадку вашего счета.
*Индикатор является настраиваемым, поэтому вы можете изменять цвета, размер и шрифты каждой секции.

Demarker pullback system - is the manual trading system for choppy markets. It show 2 colored histogram. When histogram is blue - market is quite bullish, when histogram ir orange - market is more bearish. Up arrow is plotted when histogram is in oversold zone but blue color. Down arrow is plotted when histogram is in overbought zone but orange color. These patterns shows false breakout and possible soon reverse(price is overbought but shows bearish signs and price is oversold but shows bullis

KT Forex Trend Rider uses a trend following algorithm developed specifically for the Forex market to provide reliable buy & sell signals across the major currency pairs. It works best on major FX pairs and all time-frames.
Features
It comes with a Multi-Timeframe scanner that can search for upcoming signals across all the time-frames. It comes with four preset profiles to facilitate trading for scalpers, tick-trend, swing, and trend traders. It marks the potential reversal points in the market.

The Magic MA Moving Average Indicator is a market analysis tool that has more than 30 types of moving averages that the trader can use to gauge the market trend.
Among the types of moving averages that the trader can visualize are the most common MAs (SMA, EMA and SMMA), adaptive moving averages such as FRAMA and KAMA and other MAs based on innovative calculation and analysis methods such as LSMA, ZLEMA and others.
The indicator is designed to display all these moving averages on a single cha

Quante volte ti è capitato di aver bisogno di avere a grafico i livelli chiave di una candela chiusa del time frame precedente? Con PastProjection potrai far disegnare i livelli di Apertura, Chiusura, Massimo e Minimo della candela chiusa al time frame superiore scelto. I livelli sono spesso importanti e diventano supporti o resistenze, o entrambi. La prima volta che vengono raggiunti spesso fanno reagire la quotazione. I pattern su questi livelli sono spesso più efficaci. Tali livelli sono sign
FREE

MultiTrendLines - мультивалютный индикатор для автоматизации графического анализа трендовых линий. Позволяет быстро выполнять трудоемкий анализ трендовой ситуации на рынке. Использует точные математические алгоритмы выделения ключевых точек рынка для извлечения трендовой струкртуры инструмента. За счет применения корреляционных сигналов можно улучшить симметричную оценку поведения инструмента. Включает в себя возможность точно задавать необходимый уровень глубины и угла трендовой линии. Основной

Little Trade Helper is a fine tool for manual traders.
It can quickly draw trendlines and support/resistance lines that will help to identify good price levels for placing entries, or set SL/TP levels.
This indicator will not provide any direct buy/sell signals or notification, but is purely meant for those traders that want to get a quick graphical help in finding important levels on the chart. When switching to another timeframe, the indicator will immediately adjust and re-calculate all le

StarBounce è un indicatore NO REPAINT che sfrutta i livelli importanti dei timeframe superiori. StarBounce disegna i livelli di Apertura, Chiusura, Massimo e Minimo delle candele di uno specifico timeframe e su questi livelli cerca dei re-test. Si cercano candele con corpo sopra/sotto un livello e minimo/massimo oltre il medesimo livello. Si possono filtrare le candele segnale con diversi filtri selezionabili, attivabili, disattivabili con variabili esterne. Number of trending candles: permette
Super Signal Buy And Sell Indicator
Pairs - XAUUSD - XAGUSD - Oil - BTCUSD - EURUSD - GBPUSD - USDJPY - AUDUSD - GBPJPY .... etc TimeFrame - 15Mins - 30Mins - 1Hour - 4Hour - 1Day - 1Week - 1Month
Setting : - Once Show On Green Arrow And Next Engulfing For Candle You Can Place The Buy Order Once Show For Red Arrow And Next Engulfing For Candle You Can Place The Sell Order Otherwise Please Wait For Conformation Push Notification Alert

This indicator uses a special algorithm to plot the 4 lines for trading. Great for scalping. Features alerts. Settings for trend filters. How to use: Simply attach to any chart with default settings. Buy when the three pink lines converge below the green line. Sell when the three pink lines converge above the green line. Best results when looking at three or more time frames, and the three blue lines have just converged below or above the green line.
Use as you see fit for your strategy. Best re
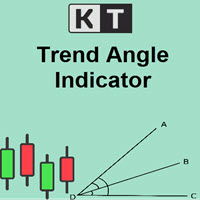
The KT Trend Angle helps to identify ranging and trending markets. The idea is to only enter a trade following the market trend if the slope is steep enough.
An angle is the ratio of the number of bars to the number of points: The bars mean the time offered by standard (M1, M5, etc.) and non-standard time frames. Points represent the unit of price measurement with an accuracy of 4 or 5 decimal places.
Input Parameters Period: An integer value to define the intensity of angled trendlines. Angl

KT Forex Blau Balance combines elements of momentum and volatility. It helps you identify entry and exit points.
Blau Balance consists of two moving averages (a slow-moving average and a fast-moving average) intersecting key transition points in market price. The indicator turns green or red when one is above or below the other, signaling to buy or sell trade signals.
It can be used in currency pairs and other markets that your MT4 or MT5 platform supports. Both short-term and long-term trade
The KT De Munyuk is a trend-based indicator that uses Parabolic SAR to identify the market direction. The indicator shows the PSAR in the form of green/red dots using a separate window. Buy Signal: When a green dot appears after a series of at least three red dots. Buy Exit: When a red dot appears on the current or next higher time frame. Sell Signal: When a red dot appears after a series of at least three green dots. Sell Exit: When a green dot appears on the current or next higher

In MetaTrader, plotting multiple horizontal lines and then tracking their respective price levels can be a hassle. This indicator automatically plots multiple horizontal lines at equal intervals for setting price alerts, plotting support and resistance levels, and other manual purposes. This indicator is suitable for Forex traders who are new and looking for chances to make quick profits from buying and selling. Horizontal lines can help traders find possible areas to start trading when the

KT XMaster Formula is a buy & sell signal indicator that works magically on most of the timeframes and currency pairs when used correctly.
The indicator uses calculations based on moving averages, RSI, and MACD. It is usually appropriate for scalping and trend trading - whether you are a novice or an experienced trader, the signals generated by this indicator are simple to understand and implement.
Overview The indicator comprises green and red dots arranged in wavy lines. These dots correspo

Use with disciplined risk management. Fibonacci entry system based on the golden zone 38.2 - 61.8 where the entry is confirmed at 23.6 with indications of Take Profit 3:1. Automatically plotted Fibonacci contains retracement and expansion Fibonacci in a single indicator. Up to 77% win rate with this system. FTMO challenge pass with 0.50% risk and 1.50% R:R.

Анализатор волатильности — это индикатор импульса, который извлекает выгоду из тенденции к сильному прорыву цены после консолидации в узком торговом диапазоне. Индикатор также использует осциллятор импульса, чтобы показать ожидаемое направление движения, когда происходит сжатие. Эта гистограмма колеблется вокруг нулевой линии, увеличение импульса выше нулевой линии указывает на возможность покупки длинной позиции, а падение импульса ниже нулевой линии может указывать на возможность продажи.
П
Вам когда-нибудь требовалось быстро получить 5 - 10 пипсов? Мы разработали для вас мощное решение. Важно - Прочтите описание ниже!
Представляем InstaScalper Dash. Настоящий алгоритмический зверь, который ГАРАНТИРОВАННО даст вам несколько пипсов в любое время торгового дня, даже перед самым закрытием рынка!
Пригодится как новичкам, так и опытным трейдерам, все, что вам нужно сделать, просто. Соедините сильную валюту со слабой, чтобы мгновенно получить несколько пунктов, и закройте сделку, к

Screener Breakout Congestion: Have you ever missed a trading opportunity because you were not looking at the chart of that market in that specific time frame? Here is this screener to help you identify congestion breakouts in the markets you want to follow in the different time frames required. Once you have identified the markets (forex, indices, CDF) and the different time frames (1M, 5M, 15M, 30M, 1H, 4H, Daily), the screener is represented by several buttons that change colour when the conge
FREE

Этот индикатор является основой для эксперта, который можно отнести к категории "почти Грааль". См. подробности ниже. Этот индикатор отображает проекцию графика ренко на ценовой график. Эта проекция отображается в виде ступенчатой линии, а не в виде "кирпичей" (прямоугольников). См. слайды 1 и 2. Сокращённое название индикатора: LRC – L ine of R enko on the price C hart . Принцип его построения очень прост. Сначала строится сетка горизонтальных линий (уровн
FREE

Умный индикатор Smart trend позволяет находить наиболее вероятные точки разворота тренда. Индикатор авторский такого вы больше не где не найдете. Простая, но эффектиная система для определения форекс-тренда. По скриншотах можете сами увидеть точностью данного инструмента. Работает на всех валютных парах, акциях, сырье, криптовалютах. Это трендовый индикатор для торговой платформы MetaTrader 4.
Система оповещений (алерт, уведомления на почту) поможет мониторить сразу несколько торговых инструме

Recommendation Trend индикатор отражает ценовые колебания, в которые уже заложена вся информация о рынке. Для многих трейдеров этот постулат является разумным обоснованием не использовать фундаментальный анализ при работе на фондовом рынке, ориентируясь лишь на то, что происходит на графике но используя этот индикатор вы не пожалеете о подсказках. Индикатор показывает благоприятные моменты для входа в рынок. Интеллектуальный алгоритм индикатора определяет тренд, отфильтровывает рыночный шум и ге

Индикатор Trend Live является разработкой для трендовой торговли. Индикаторы тренда дают возможность классифицировать направление ценового движения, определив его силу. Решение этой проблемы помогает инвесторам вовремя войти в рынок и получить хорошую отдачу. Индикатор Trend Live помогает анализировать рынок на выбранном временном интервале. Они определяет господствующую тенденцию. Прост в настройке и работает на всех парах и всех временных интервалах. Trend Live решение для торговли по трендам

Индикатор пиков и направления тренда Adapter Trend. Использует все один параметр для настроек. Подбирая параметр необходимо визуально подобие так чтоб насоответствующем графике была отмальная проекция пиков. Индикатор отображает как точки входа, так и сам тренд. После чего подтвердить сигнал каким-либо осциллятором, например RSI. Также не помешает скорректировать свои действия, учитывая какой-то флетовый индикатор.
Параметры:
Length - количеств баров для рассчета индикатора.

Acceleration Force Meter Indicator - is a trend system that join market in trend phase and after trend pull-back. AFM indicator - is the system that watchs market phases from flat to extreme volatility and prefers to enter in market when it's active, more volatility, ignoring most flat places. This is 100% complete trading system including enter and exit points. It works well with profitable trades - maximizing take profit targets(analysis of recent market volatility, its pips range to adapt cur

ImbaTrend Runner - is the trend following manual system for forex/crypto market. It defines medium-term trends and works with it in intraday mode. System shows enter points, profit and loss targets. As a rule profit targets are 2-3 X bigger than loss targets. Indicator is AutoAdaptive and it automatically updates it's settings during trading. Indicator is sensitive to market changes, regular updates helps to stay in relevant trend. Main Indicator's Features Signals are not repaint, late or disap

Early WPR divergence - is the manual system to define trend reverse. Green histogram shows main trend, Orange one - shows "short"/local trend. System is looking for clear divergence between both trends and pick up position(plot buy/sell arrows). When main trend is up, but local trend reverses to bearish trend and get's big power - sell arrow is plotted; When main trend is down, but local trend reverses to bullish trend and get's big power - buy arrow is plotted; Main inputs are : mediumTrend

Bull bear pressure indicator - is the manual system which defines bull/bear market. When lines is above zero level - market is strong bullish, and when lines below zero level - market is bearish. First line represents global trend and second one are smoothed and shows local market's mood. Main inputs are : MainPeriod- main indicator's period for global trend calculation; SignalPeriod - period for smoothed and shows local market's trend; Main Indicator's Features Signals are not repaint,non-la

ПРЕДЛОЖЕНИЕ! ПРЕДЛОЖЕНИЕ! С 22 по 27 сентября скидка 70% на всю стоимость аренды. НЕ ПРОПУСТИТЕ ЭТО ПРЕДЛОЖЕНИЕ. СЛЕДУЮЩАЯ Цена будет 650$. Уважаемые трейдеры, я так рад представить вам еще один мой торговый инструмент или индикатор под названием Super Powers Indicator. Цель этого торгового инструмента - помочь серьезным трейдерам, которые хотят сделать торговлю одним из своих основных источников дохода. Я знаю, что трейдинг — непростая задача, но если у вас есть правильные инструменты, знания и

ROC acceleration-deceleration is the manual system for medium-term scalping. Indicator based on custom ROC system which defines bullish/bearish market and especially acceleration-deceleration of tendention in the market's main direction. Buy arrow is plotted during bearish market when current trend decelerates and sell arrow is plotted during bullish market when current trend decelerates. Main Indicator's Features Signals are not repaint,non-late or disappear(exept cases when system recalculat

ArchIntel Strength meter is different from the conventional strength meter. It displays correlation index for currency pair and individual currencies, see image 4 and image 6 for the currency pair correlation index and currency strength index. This strength meter displays correlated pair. EURJPY is used to explain the formula, EURUSD and USDJPY must be going up before I can buy (Long ) EURJPY , vice-versa is for sell. When any of the currency pair is correlated using this formular the the rectan

ASI fractals with DPO filter - is the manual trend-following system. ASI fractals are the base of every trend. System plots an arrow when fractal pattern appears on ASI indcator and DPO direction is same as incomming signal. System has several ways of usage : simply indicator, indicator with suggested arrows, arrows with single targets and arrows with common profit targets. User can simply switch indicator's modes directly from chart. Main Indicator's Features Signals are not repaint,non-late or

Trend reversal index - is the manual trading system that works with overbought , oversold levels and reversal patterns. Sell arrow is plotted when indicator is higher than overbought level and here forms reversal pattern, all pattern points located higher than overbought level. Opposite with buy arrow : ndicator is lower than oversold level and here forms reversal pattern, all pattern points located lower than overbought level. Main Indicator's Features Signals are not repaint, late or disapp
This indicator changes all the open charts to one single currency pair. This is useful when scanning multiple timeframes for setups and when backtesting strategies across multiple currency pairs.
The image combines this indicator (Set Symbol For All Charts) with the ABHSyncScroller and a Currency Picker. IF you have this indicator and the ABHSyncScroller , send me a message and I will send you the Currency picker and a template for FREE.
Simply add the indicator to one open chart. All the

24 Hours BO is designed for trading manually on brokers like iq option,alpari,pocket option,quotex,olymp trade,binomo etc.
The indicator allows you to trade binary options. The recommended timeframe is М5 and the expiration time is 5-15 minutes. The indicator works on any currency pairs. Arrows are not re-painted and appear only when a new candle appears! Trade sessions: any (24 hours); Currency pairs: any. Working timeframe: M5; Expiration time: 5-15 minutes. Entry Type - INTRBAR

StarSwing è un indicatore NO REPAINT che unisce in un unico strumento oscillatori e indicatori di forza. I parametri esterni permettono di bilanciare il peso delle componenti e di regolare a proprio piacimento l'indicatore stesso. StarSwing, graficamente, è composto da segmenti di 2 colori: uno rappresentante il rialzo e uno il ribasso. Il colore non dipende dalla pura direzione del segmento ma dal trend di fondo calcolato dall'indicatore stesso. Sul grafico, si può far disegnare una media mobi

Руководство пользователя + Обучающие видео + Доступ к приватному Discord-каналу + VIP-статус и мобильная версия + Лицензия на 5 ПК с неограниченным количеством аккаунтов и терминалов MT4.
Сколько раз вы покупали индикатор торговли с замечательными обратными тестами, доказательствами производительности на живых счетах и зашикарными цифрами и статистикой, но после использования на своем счете вы оказываетесь с пустым счетом? Не следует доверять сигналу в отрыве от контекста, вам нужно знать, поч
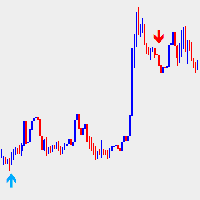
Сигнал стрелки тренда дает сигналы покупки / продажи и предупреждения верхними и нижними стрелки орота отката или продолжения тренда. ак следует из названия، тот индикатор генерирует сигналы основе тренда => н работает поерирует на основе тренда => ездить на тренде، а не торговать против тренда. هل تعلم؟ Сигналы стрелки тренда могут работать во всех временных рамках. اقرأ المزيد اقرأ المزيد Рекомендация: M5، M15 для скользящих трейдеров، ездящих на тренде، и M30، H1 и H4 для трейдеров، следеров

Треугольные арбитражные возможности RedeeCash показывают доступные валютные триады и настройки каждой валютной торговой позиции в виде глобальной переменной в формате
ААА/ВВВ, ССС/ААА, ССС/ВВВ: ААА/ВВВ -1|0|1
ААА/ВВВ, ССС/ААА, ССС/ВВВ: ССС/ААА -1|0|1
ААА/ВВВ, ССС/ААА, ССС/ВВВ: ССС/ВВВ -1|0|1
где значение представляет собой направление сделки OP_BUY или OP_SELL. Если направление торговли указывает -1, то для этой валютной пары не должно происходить никаких сделок.
Треугольная арбитражная то
FREE

HFT Scalper Scanner сканирует рыночные тренды с помощью точного технического индикатора Multi-Symbols и Multi-Time framework и отображает его на подвижной панели на графике. Трейдер может выбрать несколько пар по своему выбору для отображения.
Это отличный инструмент для определения направления тренда, который можно использовать для ручной торговли или торговли с помощью советника, разрешая только ордера на покупку или продажу в соответствии с трендом.

The Moving Average Crossover Dashboard indicator is a technical tool that displays the crossovers of 2 selected moving averages on the price chart indicating whether it is a bullish or bearish crossover. In addition, as its name indicates, it shows a signal dashboard that indicates in which market and time frame a crossover of the two moving averages occurs. In the setting window the user can select the markets and time frames that can be displayed on the dashboard. You also have the option
MetaTrader Маркет - уникальная площадка по продаже роботов и технических индикаторов, не имеющая аналогов.
Памятка пользователя MQL5.community расскажет вам и о других возможностях, доступных трейдерам только у нас: копирование торговых сигналов, заказ программ для фрилансеров, автоматические расчеты через платежную систему, аренда вычислительных мощностей в MQL5 Cloud Network.
Вы упускаете торговые возможности:
- Бесплатные приложения для трейдинга
- 8 000+ сигналов для копирования
- Экономические новости для анализа финансовых рынков
Регистрация
Вход
Если у вас нет учетной записи, зарегистрируйтесь
Для авторизации и пользования сайтом MQL5.com необходимо разрешить использование файлов Сookie.
Пожалуйста, включите в вашем браузере данную настройку, иначе вы не сможете авторизоваться.