Смотри обучающее видео по маркету на YouTube
Как купить торгового робота или индикатор
Запусти робота на
виртуальном хостинге
виртуальном хостинге
Протестируй индикатор/робота перед покупкой
Хочешь зарабатывать в Маркете?
Как подать продукт, чтобы его покупали
Новые технические индикаторы для MetaTrader 4 - 78

EZT Bollinger Trendline
Indicator based on multiple settings of Bollinger Band. In the menu you can choose the similar settings than bollinger band indicator. Trend period and trend deviations. Also paint and arrow on chart when direction change. Three different kind of alert , such as pop up, e-mail and push notification. Try different settings on different timeframes.
Please help my work and rate and comment my products!
FREE
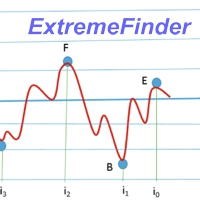
Description:
ExtremeFinder analyze chart and find local extremes - maximum and minimum. Searched extreme is always of opposite type then previous. Local extreme is confirmed when price difference is higher then set price difference, but not sooner then after set number of candles. Two different types of Local extreme confirmation are performed: Normal for common Price changes, Quick for steep Price changes. Price difference to confirm local extreme can be set as absolute value, in percent of l

Unveiling: The Austin Bat Indicator
Redefining Precision: Where Tradition Meets Innovation in Forex Trading Rising Above the Rest: Moving averages have long served as the cornerstone for forex traders worldwide. Yet, in the constantly evolving market landscape, isn't it time for an upgrade? Introducing the Austin Bat Indicator – where traditional moving average insights meet state-of-the-art refinements for unmatched precision. The algorithm used tries to stay in the trend for as long as possi
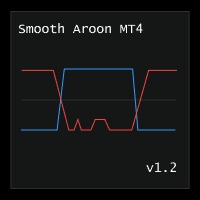
Smooth Aroon MT4 is a version of the Aroon Up and Down with smoothing and filtering.
Features :
Smoothing : You have smoothing from 0 to 99 . To smooth a signal, find the maximum value of the points in question then set the smoothing level above the maximum value. For example : If you want to smooth all signals below 30, then you should set the smoothing level above 30 This also smooths all signals above 70, since the Aroon Up and Down Oscillates between 0 and 100. Filtering : If you onl
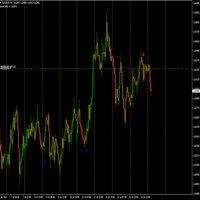
This indicator what the name says! it captures the biggest moves weekly on the 4 hour tine frame. This indicator can be used on any pair and any time frame but the 4 hour is most reliable. It works best before high impact news releases, check forexfactory.com to get when high impact news releases are happening. Its simple to use, just trade when you see the arrows appear.

Stochastic indicator timeframe optional simple adaptable strategy Possibility to set other time frames. Displays the signal, value, time frame that is set. BUY strategy> time frame setting D1 or H4 We trade on the H1 time frame If the signal is BUY, we are looking for shops to BUY We are looking for the lowest support SELL strategy> time frame setting D1 or H4 We trade on the H1 time frame If the signal is SELL, we are looking for trades on SELL We are looking for the highest resistance A
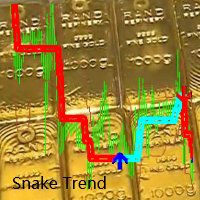
"Расти вместе!" «Кооператив QQ: 556024» "Сотрудничество WeChat: 556024" «Совместная электронная почта: 556024@qq.com»
"Тенденция формируется или умирает, и вслед за танцующей змеей кружится, вместе движется вперед, никогда не сдаваясь. «Ясно видно долгое и краткое суждение, следуй ему!» «Скрученная змейка - это лестница, ведущая к тенденции, шаг за шагом поднимайтесь и спускайтесь!» «Мы хорошие друзья с Trend, и Shock - наш лучший партнер!» "Расти вместе!"
Содержание индекса: 1. Кон

Индикатор создан по уникальному алгоритму не имеющему аналогов. В основание расчётов рассчитывается сама цена контракта и проявляемый к ней интерес, что отображается в индикаторе в виде гистограмм в двух вариантах обрисовке а также в шести вариантах отображения на графике цены в различных комбинациях что позволяет точно увидеть интерес всех участников торгов в виде обрисовки уровней поддержки и сопротивления. Принятия торговых решений можно принимать как по тренду так и коррекционные движения ц

FIRST 10 COPIES AT 30 USD, NEXT PRICE WOULD BE 50 USD
HAWA MOMENTUM & TREND PRO (MT4) Advanced trading indicator with proper pre-defined entry and exit levels with almost 80% win rate. Its smart and advanced algorithm detects trend and trend strength using momentum for maximum profits and send signals after filtering out market noise. SETTINGS: Please make sure all inputs are NOT "false" in indicator properties otherwise it will not display identified trades. Directory Location: Download f

Introducing the Austin Trend Scanner: Your Ultimate Tool for Timely Trend Identification.
The Austin Trend Scanner is a groundbreaking MetaTrader 4 indicator meticulously engineered to provide traders with precise trend reversal signals across multiple timeframes. Built upon advanced algorithms and non-repainting technology, this indicator offers unparalleled accuracy in identifying profitable trading opportunities.
Key Features: 1. Non-Repainting Signals: The Austin Trend Scanner delivers n

Это профессиональный индикатор TrendFDR . Знание о точке входа каждой из валют очень важно для каждого трейдера, торгующего на рынке форекс. Данный индикатор измеряет отображает изменения направления тренда для любой валютной пары и таймфрейма, при помощи встроенного авторского алгоритма. Стратегия для торговли по тренду, фильтрация и все необходимые функции, встроенны в один инструмент! Индикатор отображает сигналы в простой и доступной форме в виде стрелок (когда покупать и когда продавать). И
Привет дорогой друг! Вот моя история. После долгих попыток торговать вручную решил использовать робота. Начал писать своего робота. Но тестирование занимало огромное время! Параллельно пробовал чужих роботов. И опять тратил много времени на тестирование. Ночные скальперы, новостные, интрадей и многие другие классы... Требовалось точно знать, когда робот торгует, когда в прибыль, а когда в убытке. У некоторых роботов есть не описанные особенности торговли по времени. В результате для себя напис

The Icarus Auto Dynamic Support and Resistance Indicator provides a highly advanced, simple to use tool for identifying high-probability areas of price-action automatically - without any manual input whatsoever. . All traders and investors understand the importance of marking horizontal levels on their charts, identifying areas of supply and demand, or support and resistance. It is time-consuming and cumbersome to manually update all instruments, across all timeframes, and it requires regular

The indicator allows you to trade binary options. The recommended time frame is М1 and the expiration time is 1,2 minutes. The indicator suitable for Auto and Manual trading. A possible signal is specified as a arrows above/under a candle. You should wait until the candle closes! Arrows are not re-painted Trade sessions: US section Currency pairs: Any Working time frame: M1 Expiration time: 1,2,3,4,5 (depend on pair-contact for get detail advise) With auto trading with Bot, buffer 1: call,

The indicator allows you to trade binary options. The recommended time frame is М1 and the expiration time is 2,3 minutes. The indicator suitable for Auto and Manual trading. A possible signal is specified as a arrows above/under a candle. You can entry current or new candle Arrows are not re-painted Trade sessions: US section Currency pairs: Any Working time frame: M1 Expiration time: 2,3,4,5 (depend on pair) With auto trading with Bot, buffer 1: call, buffer 0 : put The indicator shows go
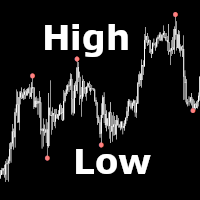
High Low FX draws dots if a new high or low occurs. The indicator is interesting for many different strategies. It can be used in EAs. High Low FX generates also alerts if a new high/low appears. The indicator is fast and not repainting.
️ High Low FX is not repainting.
️ High Low FX requires a minimum of CPU power.
️ High Low FX can be used in EAs.
In order to properly calculate the extremes the indicator is lagging
Inputs Left -> How many candles to the left must the high (lo

SR is a support and resistance indicator, it shows major highs and lows by different colors. The color of a level is changing if the last high or low are touching it. After the closing of a bar above or below level, it will delete it. extern inputs: loop for candles / colors / drawing time *This indicator signal is not perfect and have to be used with other market analysis and confirmations.
FREE

This is a complete HiLo activator indicator. A trend guide indicator capable of signaling when the trend is changing, thus ensuring greater assertiveness in the entries. For the periods M30, M15 and M5 we recommend the setup: HiLo Periods 27, MA Method Exponential. For H1 or above, we recomend the setup: Hilo Periods 13, MA Method Smoothed. -- Periods Control -- MA Smoothing Type Control -- MA Line Width Control
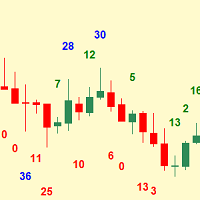
Simplest indicator for bar shadows. Very useful for Kangaroo Tail strategy.
"Shadows" - this is the distance from high and close of the bull bar and low and close of the bear bar. The purpose of the shadow is to show you if the bar is strong or not. Whether it is internal to the trend or is external. It even helps determine if a trend is starting. Input arguments: How many prevoius bars to calculate Value that should be passed to trigger the alarm How many times to repeat the alarm (Put 0 if y
FREE

Check out other great products from https://www.mql5.com/en/users/augustinekamatu/seller
This indicator is the best so far at determining the currency strength of each pair. It provides stable values and is highly adaptive to market changes. It is a great tool to add to your arsenal to make sure you are on the right side of the trend at all times. No inputs required, it is simple plug and play. A Winning Trading Strategy This article describes the components and logic needed to develop a tr
FREE
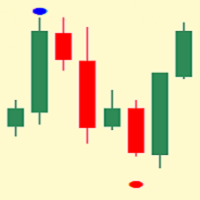
Indicator that shows two bars cluster bot and top. It will show you the forming top/bot based on the close prices. You can see the actual support and resistance.
The indicator accepts three arguments: Start bar - from which bar to start calculating Size of the dot on the chart (in font size) Distance from the top/bot Note: the indicator works on the timeframe you are currently on This indicator is very simple, does not distract you and will help you define better the trends and the channels.

Introducing Trend Zones: Your Ultimate Tool for Precise Market Entry and Exit Points.
Trend Zones is a revolutionary MetaTrader 4 indicator designed to provide traders with clear buy and sell zones based on trend reversals and price action. Built upon advanced algorithms and non-repainting technology, this indicator offers unparalleled accuracy in identifying optimal entry and exit points in the forex market.
Key Features: 1. Non-Repainting Signals: Trend Zones delivers non-repainting signal

Breakout Sniper draw trendlines by using improved fractals and plots the breakout and reversal points.
NO REPAINT AUTOMATED TRENDLINES MULTI TIMEFRAME
*** SINCE THE STRATEGY TESTER OF MT4 PALTFORM DOES NOR SUPPORT, YOU NEED TO TEST "CURRENT TIMEFRAME" INPUTS ONLY.*** A trendline is a line drawn over pivot highs or under pivot lows to show the prevailing direction of price . Trend lines are a visual representation of support and resistance in any time frame. They show direction and sp
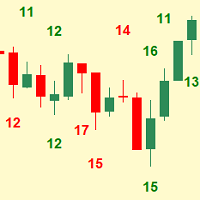
Simplest indicator for bar shadows. Very useful for Kangaroo Tail strategy.
"Shadows" - this is the distance from high and close of the bull bar and low and close of the bear bar. The purpose of the shadow is to show you if the bar is strong or not. Whether it is internal to the trend or is external. It even helps determine if a trend is starting. Very easy to recognise the pattern of the kangaroo tail and the reverse bar.
Input arguments: Timeframe
How many prevoius bars to calculate Value

Fibonacci Channel
What is a Fibonacci Channel? The Fibonacci channel is a technical analysis tool that is used to estimate support and resistance levels based on the Fibonacci numbers. It is a variation of the Fibonacci retracement tool, except with the channel the lines run diagonally rather than horizontally. It can be applied to both short-term and long-term trends, as well as to uptrend and downtrends. Lines are drawn at 23.6, 38.2, 50, 61.8, 78.6, 100, 161.8, 200, 261.8, 361.8 and 423.6
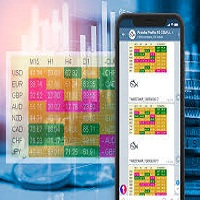
CurrencySt Alerts Metatrader 4 Forex Indicator
The CurrencySt Alerts MT4 forex indicator displays the trend strength for the 8 major currencies: NZD, EUR, GBP, USD, JPY, AUD, CAD and CHF.
It ranks the 8 currencies from very strong to very weak in a table directly visible on the MT4 activity chart.
How to trade with the Currency Strength indicator?
As a general rule, always trade the strongest currency versus the weakest currency.
For example, as shown in the NZD/USD chart below, the
This cross MA and trend line indicator defines entries based on fast and slow MA and on the previous bot or top. The entry is displayed together with indicative prices for target and stoploss. It also gives a indicative pending sl and tp in case you set a reverse stop order. The prices are based on tops and bots from my strategy which I use in my other indicator - https://www.mql5.com/en/market/product/56045. The entry shows you if a correction is strong and will become reverse trend or if the c

Chỉ báo tự động rút ra mức thoái lui fibonacci của tháng và năm. Draw from the same or under the same same or on the same of the tree before that. https://www.mql5.com/en/charts/12730171/audusd-pro-d1-axicorp-financial-services Màu đỏ là tháng fibonacci Màu vàng là tuần fibonacci White color is fibonacci date Red color is fibonacci month Yellow color is fibonacci tuần White color is fibonacci date Red color is fibonacci month Yellow color is fibonacci tuần White color is fibonacci date

Этот индикатор представляет собой идеальный индикатор волнового автоматического анализа для практической торговли! Стандартизированное определение диапазона больше не является волной для разных людей, и рисунок антропогенных помех устранен, что играет ключевую роль в строгом анализе подхода. =>Increase the choice of international style mode, (red fall green rise style) На данный момент при покупке со скидкой! Содержание индекса: 1. Базовая волна: Сначала мы нашли

Breakout FX draws arrows and emits alarms if the price exceeds or falls below the previous n candles.
️ Breakout FX can be used in expert advisors.
️ Breakout FX can improve already existing trading strategies.
️ Breakout FX is very fast and is not repainting.
Inputs Breakout Range [Candles] Breakout Price Type Arrow Size Enable Alerts Enable Push Notifications Enable Emails

Индикатор Magic Arrow Scalper отфильтровывает маловероятные торговые сигналы в торговой стратегии. Продукт использует сложный алгоритм фильтрации на основе рыночных настроений и трендов. Индикатор отображает стрелки на графике (см. приложенные скриншоты), указывая вероятный разворот цены. Magic Arrow Scalper не перерисовывается. Сигнал подтверждается после закрытия свечи, а добавленная стрелка никогда не исчезнет. Также можно настроить оповещение о появлении стрелки на графике. Индикатор не
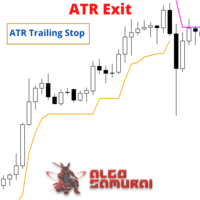
The ATR Exit indicator uses the candle close + ATR value to draw trailing stop lines (orange under buys, magenta over sells) that advance with the trend until the trend changes direction. It uses a multiple of the Average True Range (ATR), subtracting it’s value from the close on buy, adding its value to the close on sell. Moreover, the trailing stop lines are generated to support the order’s trend direction (long or short): In an upward trend, the long trailing stop line (orange line under bu
FREE
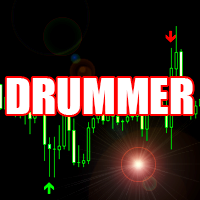
Опережающий индикатор вычисляет наиболее вероятные места разворота или остановки тренда. Пример использования показан на скрине с помощью торговой панели ChainVector ( https://www.mql5.com/en/market/product/49155 ) . Сигналы индикатора не перерисовываются и сигнализируют о развороте тренда в максимально ближайшее время. Данный индикатор можно использовать как самостоятельную торговую систему или как дополнительную часть другой торговой системы. Support : https://www.mql5.com/en/channels/TrendHu
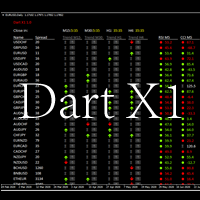
Scanner type indicator, allows you to view information about all the active symbols in metatrader 4. You can see the size of the spread, trend in M5, M15, M30, H1, H4. It also allows to open a chart on the selected symbol and timeframe. Also, you can see the time left to close the current candle.
Finally, you can view the value of the indicators: RSI, CCI and Estocasty. But the green color indicates a possible uptrend and the red color a possible downtrend.
FREE

The Icarus Reversals(TM) FREE Indicator is a powerful tool to identify high-probability reversal points, across all instruments. The Reversals Indicator provides traders and investors with a simple-to-use and highly dynamic insight into points of likely price-action reversals. Generated by a unique proprietary code-set, the Reversals Indicator (FREE version) generates long and short trade signals, which can be customised for key inputs and colourisation. Settings of the Icarus Reversals FREE h
FREE

The indicator of the indicators. The Most Powerful Technique to Determine Forex Trend Strength in 2023. We have perfected Supreme Commander that it calculates an average of the selected indicators (up to 16) and the selected timeframe (all) with the result of a single trend that indicates the potential of buying and selling. It includes the following indicators:
Accelerator/Decelerator oscillator Average Directional Movement Index Awesome oscillator; Bulls and Bears Commodity Channel Index; D

Switchman это умный индикатор без задержек и перерисовывания, который показывает тренд выбранных таймфреймов. Самая главная задача трейдера это во время обнаружить тенденцию и следовать ей.
Использует алгоритм расчета нахождения возможных ценовых разворотов. Может использоваться как дополнительный или вспомогательный инструмент для вашей торговой стратегии. Используется текущий таймфрейм, на который установлен индикатор.
Используя для етого стрелки которые отображают направление точек разв

Watch the Clock shows a clock at a desired position. The clock is useful if you want to check when a candle closes. You can also set an alert to be prepared before the news.
️ Watch the Clock works also in the strategy tester.
️ Watch the Clock requires a minimum of CPU power.
️ Watch the Clock can improve your manual style of trading.
Inputs Alert -> At which time should the alert occur? Time Shift in Minutes -> Should the time be incremented by x minutes? Size -> The font size of t

The Icarus Reversals(TM) Indicator is a powerful tool to identify high-probability reversal points, across all instruments. The Reversals Indicator provides traders and investors with a simple-to-use and highly dynamic insight into points of likely price-action reversals. Generated by a unique proprietary code-set, the Reversals Indicator generates long and short trade signals, which can be customised for all inputs, allowing for the complete optimisation fitted to any trader or investor style

Check out other great products from https://www.mql5.com/en/users/augustinekamatu/seller
This indicator finds the entry points based on divergences of common indicators and does not repaint . The principles used ensure that it can be used on CFDs, Commodities and Stock with incredibly great results. With proper money management and portfolio balancing the Indicator can be applied to any trading strategy to generate consistent profits. A Winning Trading Strategy This article describes the co
FREE

The Candle High Low Exit indicator uses the highest high and the lowest low of a range to draw trailing stop lines (orange under buys, magenta over sells) that advance with the trend until the trend changes direction. Moreover, the trailing stop lines are generated to support the order’s trend direction (long or short): In an upward trend, the long trailing stop line (orange line under buy) appears and advances upward until the close crosses under the line.
In a downward trend, the short tra
FREE
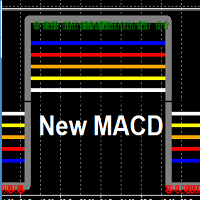
This is a New Single/Multi Timeframes Indictor based on Moving Average divergence concepts You can use it in differerent modes : Single time frame Mode :(2nd prefered) you input the time frames all the same period - you will get a square wave for Bear /Bull Areas two- time frame Mode :(1st prefered) you input the two time frames you prefer- you will get two square waves representing the 2 timeframes - when the two square waves are showing a Bear area a Red down arrow will appear and the same

you are in a trade making profit... should you take profit now or wait...? This easy to use Dynamic Take Profit Indicator helps you to decide when to get out of a winning trade. Or you can supervise or overrule any EA when to close an open order when manual trading, or read out the buffers[1][2] to integrate in an Expert! As soon as the price crosses the yellow line, price direction should reverse soon and orders should be closed. The band is dynamic and changing with every new candle as it

Reversal Sniper is designed to find the extreme reversals of the price. Indicator collects data of Cycle Sniper Indicator.
NOTE: REVERSAL SNIPER Indicator is made for Cycle Sniper Users as an additional tool. However, it can be used by the traders who look for finding out strong reversal levels.
Indicator works on all timeframes and all instruments.
Reversal Sniper Checks: Harmonic Patterns RSI Zig Zag and Harmonic Swings Cycle Sniper Indicator's Buy / Sell Signals The complex algo i

Market Calculator - мощный инструмент, позволяющий вам легко и быстро рассчитать основные параметры сделки: объем лота, размер StopLoss и TakeProfit, а также оценить размер средств (требуемая маржа), необходимых для открытия позиции. Программа имеет очень удобное и интуитивно понятное управление, т.к. реализована в оконном стиле OS Windows. Имеется много интересных и удобных фишек - лучше просто посмотрите видео: youtu.be/_78LdAjMj0Y Все данные программы разбиты по разделам в виде вкладок: " Lot

Индикатор ищет и отображает японские свечи "Доджи" на графике и сигнализирует о появлении такой свечи. Направление сигнала зависит от направления предыдущих свечей, так как Доджи сигнализирует о развороте или коррекции. Кроме возможности сигнализирования, графически показывается сила разворота (чем больше зелёного цвета, тем вероятнее рост, чем больше красного - падение цены). В настройках индикатора можно изменять параметры свечи Доджи, закрытие которой будет сигналом: минимальную длину тени св
FREE

Icarus Bolli-Band Change Display(TM) Indicator is a simple, but highly effective tool for visually identifying areas where the all-important 'Bollinger Band' values are in a state of expansion, contraction of neither. The traditional Bollinger Bands have been widely applied to trading charts globally since their creation by John Bollinger several decades ago. One of the limitations of the traditional Bollinger Bands is the ability to clearly identify when the bands are in fact expanding or contr

Индикатор Unique Trend отслеживает рыночные тренды, игнорируя резкие колебания и рыночный шум. Индикатор подходит для торговли на малых таймфреймах, потому как он игнорирует внезапные скачки цен или коррекции ценового движения благодаря снижению рыночного шума вокруг среднего значения цены.
Развертка на минимумах и максимумах формирует внутренние границы (канал) при расчете сигналов индикатора. Канал позволяет убрать рыночные шумы. iMA и iATR используются для построения сигналов с применением
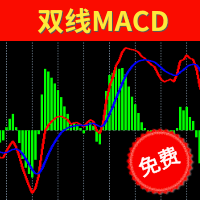
Two Lines MACD Many people who conduct technical transactions on MT4 like to use MACD to judge the turning or continuation of the market. When everyone uses the MACD indicator that comes with MT4, they find that the indicator is a single-line MACD, and the histogram seems to be similar to the past. The MACD that I understand does not match. In order to provide traders with a perfect trading experience, we especially provides free two-line MACD indicators for all traders! The single line in the
FREE

Оригинальный трендовый индикатор BoomTroom . С этим индикатором вам не нужно сидеть около компьютера и ждать появления точки перегиба днями и ночами.
Как же важно определить тренд на фондом рынке или рынке Forex! Вы все еще не уверены, как определить точку перегиба тренда? Вы все еще обеспокоены тем, как провести линии краткосрочного и долгосрочного тренда? Pапустите эту интеллектуальную утилиту. Вы увидите точки разворота разной силы, а также линии долгосрочного и краткосрочного тренда.
И

Реализация индикации трендового движения с моментами для потенциальных стопов в индикаторе Cloud Power .
Переход в тень предупреждает о возможном развороте. Вхождение цены внутрь тени говорит в флэтовом движении. Индикатор отслеживает рыночный тренд с непревзойденной надежностью, игнорируя резкие колебания рынка и шумы вокруг средней цены. Простое, визуальное и эффективное использование. Индикатор не перерисовывается и не запаздывает.
Может легко употребляться как самостоятельная торговая с

Рынок Форекс может пройти множество различных ценовых путей к достижению некоей точки в будущем. Будущее динамично. Поэтому, планирование торговли с возможным будущим сценарием является важным шагом для вашего успеха. Для этих целей представляем вашему вниманию Trend Units.
Уникальная авторская стратегия, одновременно определяющая силу трендов и точки входа в рынок, визуализируя это с помощью стрелок на графике. Индикатор оптимально адаптирован для торговли на временных периодах М5, М15, М30,

LSM Basket Indicator is a ideal tool to trade "Basket Currency" for scalping/day trading or swing trading. Imbedded tools: 1. MTF(Multi Time frame) Basket Currency Trend filtering system . 2. Identify Basket Currency Trend reversal Area (Combined with " SupplyDemand Zones Indicator " ) 3. Basket Currency Strength indicator. 4. Chart Symbols Changer.(please see video) 5. Symbol daily change %.
Parameters:
Alert On "Reached Buy level/Sell level: true/false Alert On "Enter Supply Deman

Trend Code (v2.0) Trend Code is a very simple and yet effective trend indicator to capture trend movement, detect the trend reversal, calculate entry price as well as proper stop loss. Trend Code indicator is made up of a series of block, while bull trend block in bull colour and bear block in bear trend colour. For bull trend block, the TrendOpen is the lower edge, TrendClose is the upper edge, for bear trend block, the other way round. Parameters: TrendOpenAdjustment = 0.8, (range 0~1.0) Tr

Hit Man - индикатор для определения тренда, дополнит любую стратегию, а также может использоваться как самостоятельный инструмент. Профессиональный индикатор определения тренда и точек входа. Для определения тренда использует уникальный алгоритм фильтрации. Показывает смену направления движения цены на любых валютных парах, без перерисовки результата. Подходит для определения точек входа как для скальпинга и свинга, а так же и для внутри дневной, среднесрочной торговли.
Преимущества Подходит

This is an alert for when price is above the 200 ema, macd is below its zero line and the slow ma crosses above the fast ma and vice versa for sells. It has been tested 100 times as seen on youtube and has a 65% win rate on the 30 minute time frame.
I've attached a video to explain how to use it. Under the vuideo is a link to Trading Rush video where he tests the strategy 100 times on 30 minute.
(1) INDICATOR PARAMETERS
MA Period . Default is 200 MA Type . Defaul
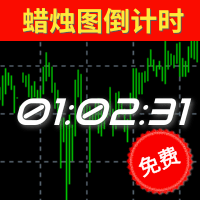
倒计时指标功能介绍 类别
解释
备注
预计结束倒计时 计算当前周期蜡烛图的结束时间(可应用于所有周期),其考虑了蜡烛图可能会因为日常休市而提前结束的情况; 如果该蜡烛图包含多个休市和开市的情况下,以最后的休市或者蜡烛图收盘时间为准。 值得特别注意的是:本指标并没有将平台额外公布的节假日休市、修改休市或者开市时间等因素纳入考虑范围,它仅仅是基于MT4所公开的交易时间做计算,无法100%确保本品种的收盘或者开盘时间无误 ,故使用者需提前明确该品种交易时间情况。
预计开盘倒计时 仅限于状态为"休市中"的提示,根据MT4上公开显示开市时间进行预估大约还有多久时间开盘; 和预计结束倒计时类似,并没有将额外公布的时间纳入考量。由于W1和MN1周期中包含多次的开盘和收盘,所以该两周期无休市提示。
【状态】 颜色 状态 备注 绿色 正常 一切正常 黄色 服务器无报价 服务器实际上传送到MT4并非是毫无中断的,可能是1分钟之内出现多次,甚至是连续较长的时间无报价,取决于您所处的网络延迟、服务器的情况等等。
本品种已有X秒无报价 MT4上并不是所有的品种的报价都是最新的,有可能某
FREE
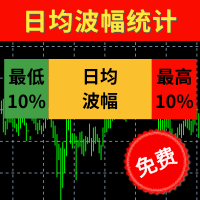
【最低10%】 统计过往100天蜡烛图的波幅并进行排序,最低10%的波幅以点数显示。 【日均波幅】 统计过往100天蜡烛图的平均波幅,并以点数显示。 【最高10%】 统计过往100天蜡烛图的波幅并进行排序,最高10%的波幅以点数显示。 【今日】 今日波幅以点数统计,箭头的位置是今日波幅相对于历史总体波幅的位置。越靠近左侧说明今日波幅越小,越有侧说明波幅越大。 波幅指标最适合用来审视当日距今为止波幅的大小,使用方法如下: 若今日时间尚早而且今日波幅尚较低,说明今日可能行情尚未启动,还有入场机会。 若今日时间尚早但今日波幅已经超过80%,说明今日趋势行情可能已经结束,接下的行情可能反弹。 若今日时间较晚,而且今日波幅已经超过60%,说明今日行情可能已经走完。 当日的止盈点位+当日已完成波幅最好不超过最高10%的波动点数。 当日的止损点位+当日已完成波幅最好超过最高10%的波动点数。 当然该指标是基于过往的100日数据进行统计,并不代表接下来今日的波幅一定不会创新低或者创新高,其作用是给日内交易者的入场时机和日内交易空间提出判断依据。 更多细节请看 http://www.sygdpx.co
FREE

The Market Sessions Indicator for MT4 helps you predict market turnarounds by detecting major supply and demand areas. These pivot points tend to occur after a new session has started and the previous one is still open. It is also used to gauge how many points or pips the market moves on average during a session. This helps us to place better our take profits and stop losses. The indicator works on all forex pairs, gold, silver, commodities, stocks, indices and any other instrument that your b
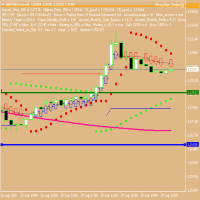
My Trend Finder
//**************************** FREE signal that uses all three of my indicators feel free to copy see link below https://www.mql5.com/en/signals/1318509?source=Site +Signals+My //**************************** period is the only setting basically number of bars on your chosen timeframe, Attach to chart of any timescale Period in bars = 7 which is a short monitoring period, 100 would be longer monitoring I use this set up on a one hour chart, basically No arrow means not s
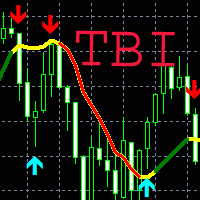
Простое визуальное и эффективное обнаружение тренда.Сигнал поступает на " закрытой свече ".Работает на всех символах и таймфреймах.Индикатор не использует входных параметров.Все алгоритмы для расчета заложены в код.Индикатор может использовать для разработки советников.Изменение цвета индикатора,характеризует поведение рынка.Зеленый цвет сигнализирует восходящее движение.Красный цвет сигнализирует о нисходящем движении.Желтый цвет показывает флет.Желаю всем удачной торговли!!!

HJZHI88888888888888888888888888888888888888888888888888888888888888888888888888888888888888888888888888888888888888888888888888888888888888888888888888888888888888888888888888888888888888888888888888888888888888888888888888888888888888888888888888888888888888888888888888888888888888888888888888888888888888888888888888888888888888888888888888888888888888888888888888888888888
FREE

Индикатор находит уровни максимального и минимального ценового объема (профиль рынка) на рабочей гистограмме для указанного количества баров. Композитный профиль. Высота гистограммы полностью автоматическая и адаптируется к любому инструменту и таймфрейму. Используется авторский алгоритм и не повторяет известные аналоги. Высота двух гистограмм примерно равна средней высоте свечи. Умное оповещение (smart alert) поможет вам сообщить о цене, касающейся уровня объема.
Концепция Smart Money. Low

Индикатор анализирует указанное количество свечей и строит уровни Фибоначчи на основе максимума-минимума. Поскольку уровни перестраиваются, то нас интересует правая часть диапазона. Цена магнитит к уровням и реагирует на касание. Используйте этот инструмент для поиска точки входа по тренду после коррекции. Если слева мы видим, что уровни идеально встали, то мы можем предположить, что нашли окончание движения в крайней точке. Все линии прорисовываются через буферы или объекты (на выбор).
Входны
FREE

Описание
Impulse Angle - индикатор, который идентифицирует на рынке импульсы и отображает на графике угол их наклона.
Рекомендации
Вы можете использовать данный индикатор для определения тренда (импульса) и соответственно для определения направления открытия позиции или закрытия противоположной позиции.
Параметры
===== _INDICATOR_SETTINGS_ ===== - настройки расчета индикатора
Maximum History Bars - максимальное количество баров истории для расчета индикатора. Average True Rang
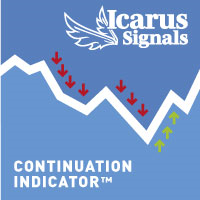
The Icarus Signals Continuation(TM) Indicator is a simple, but highly effective tool for identifying strong price trends, both long and short, across all time-frames and instrument types. The Icarus Continuation Indicator allows users to plot individual markers for each bar, when price has extended into a high-probability trend area, after a set level of extension. The Continuation Indicator allows users to fully optimise each of the unique Icarus settings to best fit a particular trading s

What is the Volume Weighted Average Price (VWAP)? The volume weighted average price (VWAP) is a trading benchmark used by traders that gives the average price an instrument has traded at throughout the day, based on both volume and price. It is important because it provides traders with insight into both the trend and value of the instrument.
What is the Difference between VWAP and AVWAP? While VWAP is having as starting point the beggining of the day,week,month etc. in the AVWAP you can pla

The indicator displays two Moving Average lines on the chart with parameters specified in the settings. It issues a signal in the form of arrows and a sound at the intersection of these Moving Average. In the indicator settings, you can set the period of fast Moving Average ( Fast MA Period ) and slow Moving Average ( Slow MA Period ). And also Shift, Applied Price, Method and Timeframe for two Moving Averages separately. Important:
The main difference from oth
FREE

Приседающий бар (Squat bar).
Один из элементов системы "Торговый хаос" Билла Вильямса. (Приседающий бар)
Расчитывается исходя из разницы в изменении цены и тикового обьема.
Усиливает сигнал "Медвежьего/Бычьего Дивергентного разворотоного бара (Первый Мудрец)" если совпадает с ним или находится рядом.
Протестирован в сравнении с оригинальной программой "Investror's Dream"
Для более эффективного освоения системы читайте и смотрите материалы Билла Вильямса.
В настройках можо выбрать цв

The indicator is the advanced form of the MetaTrader 4 standard Fibonacci tool. It is unique and very reasonable for serious Fibonacci traders. Key Features Drawing of Fibonacci retracement and expansion levels in a few seconds by using hotkeys. Auto adjusting of retracement levels once the market makes new highs/lows. Ability to edit/remove any retracement & expansion levels on chart. Auto snap to exact high and low of bars while plotting on chart. Getting very clear charts even though many ret
А знаете ли вы, почему MetaTrader Market - лучшее место для продажи торговых стратегий и технических индикаторов? Разработчику у нас не нужно тратить время и силы на рекламу, защиту программ и расчеты с покупателями. Всё это уже сделано.
Вы упускаете торговые возможности:
- Бесплатные приложения для трейдинга
- 8 000+ сигналов для копирования
- Экономические новости для анализа финансовых рынков
Регистрация
Вход
Если у вас нет учетной записи, зарегистрируйтесь
Для авторизации и пользования сайтом MQL5.com необходимо разрешить использование файлов Сookie.
Пожалуйста, включите в вашем браузере данную настройку, иначе вы не сможете авторизоваться.