 MetaTrader 5
 专家
 指标
 程序库
 实用工具
 窗口小部件
 规则
适用于MetaTrader 4的新EA交易和指标
 EA交易自动执行市场交易,而指标可使您更准确地分析报价并预测价格行为。
通过这些应用程序,您将能够更明智地在MetaTrader 4执行交易,抓住更多的交易机会。

AI 驱动的黄金交易革命 -------------------------------------------------------------------------------- My AI Gold 不仅仅是一款普通的自动交易工具——它是先进神经网络工程、专有定制架构以及严格真实市场优化的成果。My AI Gold 从零开始构建,采用 GitHub 上前沿的代码库和先进的机器学习框架,通过深度数据分析来解析 XAUUSD(黄金)市场的复杂运行规律。 与那些未经充分测试或仓促推出的产品不同,My AI Gold 已经经历了广泛的测试、验证,并在真实市场周期中不断优化。只有在取得稳定且可验证的实际表现之后,它才正式发布。
真实交易记录 +1000% https://www.mql5.com/en/signals/2389616
IC Markets 实盘监控 — 10,000 美元真实账户
https://www.mql5.com/en/signals/2390451
终于来了!MY AI GOLD MT4 版本正式发布! 现在仅需 $499 即可立即获得 My AI Go

Blackmarket Mechanism 是一个短线货币剥头皮交易系统,能够从互联网获取价格预测,并利用这些预测做出交易决策。
实时信号: 点击这里 无网格交易,无马丁格尔 移动止损会随着交易的发展,根据当前市场状况进行调整。 完全集成的交易面板,可实时显示价格预测。
Traders Union 是一个预测 EURUSD 和 GBPUSD 未来价格的数据源。该模型基于 21 个技术指标,并结合统计预测模型、历史价格模式和趋势分析来计算价格。价格预测每小时更新一次;如果重大的宏观经济或市场变化影响基础模型,也可能提前更新。 Blackmarket Mechanism 通过 API 集成直接从 Traders Union 获取价格预测,将数据显示在您的图表上,并每小时刷新一次。
推荐设置 图表:EURUSD, GBPUSD
时间周期:H1 推荐入金:200 美元 参数 手数计算方法 - 选择自动手数或固定手数
固定手数 - 固定手数 自动手数 - 账户货币每达到指定金额使用 0.01 手 最大点差 - 设置允许开仓的最大点差 自动检测 GMT - 自动计算您的经纪商 GMT 偏移量 固

Rhino Dashboard Trade Panel 是一款为 MetaTrader 4 手动交易者打造的交易面板和风险管理工具。一个顶部栏和一个面板取代了下单对话框。 仓位大小计算器把您的止损转换为交易量 ,每个订单在发送时都已规划好出场,日亏损上限以及每周和每月规则会监控整个账户。 只有在您点击时,面板才会交易。 当达到您设定的上限时,它的规则可以阻止新交易或平仓。 MetaTrader 5 版本: Rhino Dashboard Trade Panel MT5
用户手册: Rhino Dashboard Trade Panel user manual
下载演示版: 7-Days Trial version
顶部栏:账户、价格和盈亏 顶部栏位于图表上方,让您一眼看清账户状态。 账户
产品名称和版本, DEMO 、 LIVE 或 TESTER 标记,对冲或净额模式,以及交易被关闭时带有原因的警告。 交易品种和价格
点击交易品种打开观察列表:搜索经纪商的所有品种,为常用品种加星标,并切换图表的品种和周期。旁边显示 Bid、Ask、点差和当日涨跌。 资金
余额、净值、保证金

JET Trade Assistant PRO 是一款适用于 MetaTrader 4 的完整交易面板和交易管理器。选择您的风险,在图表上画出交易,一键发送——面板会计算手数,并管理该交易直到最后一次离场。与 MetaTrader 5 3.00 版本使用相同的面板、输入参数和文字。 亮点 Reverse(反手):一键(或 Shift + V)平掉该品种已开仓的方向并开立相反方向,需第二次点击确认;止损和止盈镜像设置;相同手数或按您的风险重新计算。 每日盈利目标:日初余额的 % 或账户货币金额。达到后,新的入场将被禁止直到下一个服务器日(可选:平仓并删除挂单)。 持仓保本线(BE OPEN):当该品种有 2 个或以上持仓时,显示它们合计结果为零的价格(含库存费和佣金),并可一键执行 "SL at open BE"。 订单注释 "JTA#<number> <origin> <detail>":每笔交易一个编号,显示在 TRADES 列表和图表标签上。 在图表上规划交易 可用鼠标拖动的入场、止损和止盈线(也适用于可视化策略测试器)。 每条线显示金额、余额百分比和 R;订单类型跟随线条位置和订

DRX Smart RR for MT5 – 交易管理器、手数计算器与自营交易风控 Guard:可视化盈亏比规划器、每日亏损限制、最大回撤锁定、新闻过滤器、移动止损与交易面板 点击前先了解您的风险。 DRX Smart RR 是专为 MetaTrader 5 手动交易者设计的交易管理器。在图表上画出交易,直接在止损和目标位置查看金额,获取精确的手数,按住按钮一键发送。发送后可一键管理,并由严格的风控系统在到达极限时为您止损。 大多数账户并非毁于差劲的策略,而是毁于一个糟糕的下午:仓位过大、挪动止损、以及达到日亏损限制后的报复性交易。Smart RR 在您与那个糟糕的下午之间建立了一条铁律。它专为 自营考核 (Prop Firm Challenges) 、 资管账户 (Funded Accounts) 以及 个人账户 打造,同时也可作为无任何限制的纯粹盈亏比工具使用。 完整指南第一部分:设置与交易 ---> 点击查看
完整指南第二部分:风控与自营公司 ---> 点击查看
Smart RR 是一款 手动交易辅助工具 。它没有任何信号或策略,也绝不会自行开仓。每一笔交易都始于您亲自按下按

ThemeManager 一键更换 MetaTrader 4 所有已打开图表的配色方案。8 套专业图表主题任选 — 深色模式、浅色模式、网页交易风格等 — 也可以通过 13 个颜色选项设计您自己的 Custom 主题。不必再逐个图表设置颜色:图表上的小面板一次性美化您的全部图表。 ThemeManager 完全免费 — 所有主题和全部功能,没有任何限制。 使用 MetaTrader 5? ThemeManager MT5 同样免费。 更多交易工具 使用方法 将 ThemeManager 拖到任意图表上(导航器 → 指标)。 在 THEMES 面板上点击一个主题 — 每个按钮都实时预览自己的配色。 完成:所有打开的图表立即换上新配色。 上次使用的主题会被记住,并在指标加载时重新应用;之后新打开的图表也会自动套用(参数 "Also apply to charts opened later")。 内置 9 套主题 Dark Pro :现代炭灰深色主题,绿红蜡烛。 Classic Light :干净的白色图表,传统风格。 TV Dark :深蓝灰背景配青绿与红色蜡烛,网页交易风格。 Mat
FREE

DRX DrawPad:MetaTrader 5 图表绘图工具与风险回报交易规划器 DRX DrawPad 将 MetaTrader 5 变成完整的可视化分析工作区。直接在 MT5 图表上绘图、测量和规划交易,快速、精准,无需任何外部软件。 手绘、趋势线、箭头、斐波那契、区域、文字、测量尺,以及可自动计算手数的多/空仓位规划器,全部集成在一个精简的深色面板中,可停靠在图表的任意一边。它以指标形式运行,因此可与任何 EA 同时使用,并且绝不会下单或修改订单。 为什么选择 DRX DrawPad? MT5 自带许多绘图对象,但随手绘制很慢:菜单、对象列表、误点击、绘图时图表跟着滚动。DRX DrawPad 省去了这些繁琐步骤。选择工具,绘制,完成。每个绘图都是普通的图表对象,绘图时图表会自动锁定。 交易规划器:带风险与手数计算的多/空仓位工具 一键生成完整计划:入场、止损和止盈立即出现(止损 = ATR 距离,可调整)。也可以拖动,把止损放在你想要的位置。 仓位计算器:根据账户风险(0.5 / 1 / 2 / 3 % 或自定义数值)按余额或净值自动计算手数。 一键设置盈亏比:1:1、1:1

GoldEdge SMC Dashboard — 黄金智能仪表盘
GoldEdge SMC Dashboard 把黄金交易者需要的一切都集中在一张图表上。它专为 XAUUSD M15 周期 打造和优化。
这是一款 决策辅助工具,而不是自动交易机器人 。仪表盘从不自行开仓。它分析市场、展示交易机会、用虚拟订单进行模拟,所有决定都由您来做。
图表上显示的内容 市场结构:BoS / CHoCH、ZigZag 波段 订单块(Order Blocks)和供需区 带最小尺寸过滤的公允价值缺口(FVG) 流动性位(买方 / 卖方) 图表及 H4 上的 Supertrend 带 OTE 区的斐波那契、溢价 / 折价区 Quasimodo(QM)位、趋势线、ICT 框、H1 POI 每一层都可一键开关 一个面板包含 12 种策略信号
BO · TF · ICT · SMC · Scalp · Micro · BO-C · Range · Liquidity FVG · ORB · Intraday Momentum · Volatility Breakout
面板显示每种策略的实时状态(FO

一张图表,九个周期,一个清晰的解读。 大多数交易者在一个窗口看RSI,在另一个窗口看ADX,在第三张图表上看交易时段,旁边还开着一个计算器。等到全部检查完,整体画面已经分散,决策也只能匆忙做出。 Legion SuperPanel 将这些内容整合到图表上的一个面板中,并用简明的语言告诉您各项读数在哪里一致、在哪里不一致。您无需再来回切换窗口,可以把市场作为一个整体来解读。 本面板为只读工具。它不会开仓、修改或平仓:所有决策都由您自己掌控。 一眼可见的内容 方向与一致性: 从-100到+100的共振评分,以及置信度百分比。 价格所处位置: Bid是否位于H4、D1、W1或MN1的order block或失衡区(FVG)内,以及进入的深度。 尚缺少的条件: 一份将每个条件标记为MET、ALMOST或MISSING的清单,让您知道还需要等待什么。 以金额表示的风险: 在下单之前,将margin call、stop out和take profit水平绘制在图表上。 六个标签页,一个面板 SUMMARY 账户、Confluence Status、Legion清单、OB + FVG、活跃区域、RS

Signal Buffer Trader 交易您所选指标的 BUY 和 SELL 信号,包括您只有 EX4 文件的指标。它在K线收盘时读取指标的缓冲区,或指标在图表上绘制的箭头,按照您设定的风险开立一个带止损的订单,并在图表和日志中说明每一个决定。免费的 Signal Buffer Inspector MT4 能找到正确的缓冲区并保存设置文件,本 EA 一键即可导入。 信号和过滤器 信号来自自定义指标的缓冲区(MQL4\Indicators 中的文件名、输入参数、BUY 和 SELL 缓冲区、信号偏移),来自图表上的箭头对象,或来自内置的均线交叉,后者无需任何额外文件即可使用。EMPTY_VALUE 和 0 表示无信号,也支持一个同时含有正值和负值的缓冲区。 另外两个指标槽用于确认信号:几根K线内出现相同信号,价格位于指标线之上或之下,或缓冲区数值的正负。每个槽都有自己的时间周期,因此 M15 的入场可以跟随 H1 的趋势,较高周期的信号在该周期的每根K线上只交易一次。槽也可以只作为数据加载,用于止损线或离场信号。 风险和离场 按净值风险百分比或固定手数计算手数。每次下单前检查手数限制

Signal Buffer Inspector 显示同一图表上另一个指标实际输出的内容,包括您只有 EX4 文件的指标。它回答每个自动化项目开始时都要解决的问题:哪个缓冲区存放 BUY 信号,哪个存放 SELL 信号,什么值表示“无信号”,新信号出现在哪根K线上,以及已收盘K线上的数值之后是否会改变。 显示内容 表格列出被检查指标的所有缓冲区及其类型(BUY 箭头、SELL 箭头、混合箭头、+1/-1 标志、线条或空)、方向和置信度、信号数量、空值和信号偏移。EMPTY_VALUE、0 或 -1 之类的常数会被识别为“无信号”。以图表对象形式绘制箭头的指标也能被识别,并按对象名称前缀分组。 重绘检查会记录已收盘K线的数值。如果某个数值之后改变或消失,该缓冲区会被标记为 REPAINTS,并显示改变次数以及发生在多少根K线之前。在观察到足够多的新信号之前,状态保持为 PENDING。结论(READY、CHECKING、REPAINTS 或 NO SIGNALS)会与建议设置一起显示。 设置与导出 在 Settings 中,可以用箭头按钮选择图表上的另一个指标,也可以输入 MQL4\Ind
FREE

Intelligent Trade Management with Graphical Trigger Lines, Automatic Additional Entries, Basket Take Profit, and Flexible Long/Short Management for MetaTrader 4 DualTrade Control combines the advantages of manual trading decisions with intelligent, automated order and position management. The trader determines the desired entry levels directly on the chart. The Expert Advisor then takes over monitoring these price levels, placing pending orders, managing additional entries, and managing and clos

Aurum Instinct EA 是一款适用于 MetaTrader 4 的黄金 (XAUUSD) 智能交易系统。十一种突破策略、自我学习的神经过滤器,每个订单从挂出那一刻起就带有止损。亏损后手数永远不会加倍——绝不。
实盘信号: AURUM Instinct EA MT4 — https://www.mql5.com/en/signals/2397836 AURUM Instinct EA MT5 — https://www.mql5.com/en/signals/2397838 AURUM Instinct LR — https://www.mql5.com/en/signals/2397876
设置文件 (.set) — 在本产品的"评论"选项卡中。 用户指南(英文和俄文)— 随 EA 一同提供。
为什么选择 Aurum Instinct
11 种突破策略,基于 H1、H4、D1 水平和 M15 区间——一个 EA 内部实现多样化 每个订单从挂出那一刻起就有服务器端止损 无马丁格尔、无摊平网格、亏损后不加倍手数 神经过滤器:两个内置

VWAP Sentinel 是一个综合性的 VWAP 分析系统 ,它将多个 VWAP 计算层、持续的历史 VWAP 水平、偏差分析和动态多品种 VWAP 矩阵结合到一个集成的交易工具中。 这不仅仅是一个传统的VWAP指标。VWAP Sentinel引入了一种多核计算结构,它保留了之前的VWAP参考值及其偏差水平,并在图表上保持可见,直到价格触及这些水平为止。 VWAP Sentinel 将当前和历史 VWAP 计算与动态多符号分析相结合,从而提供对市场定位、结构和价格行为的更广泛视角。 主要特点 多核 VWAP 引擎 – 多个 VWAP 计算层,每个层都有独立维护的 VWAP 参考值和历史水平。 持续 VWAP 机库系统 – 先前的 VWAP 计算及其偏差带会一直保留在图表上,直到价格触及它们,而不是在新计算周期开始时消失。 多时间框架计算 – 根据您的交易方法选择您的 VWAP 锚定周期:M15、M30、H1、H4、日线、周线、月线或年线。 历史 VWAP 水平 – 显示最多八个先前的计算周期,每个周期都有自己的 VWAP 和偏差水平。 偏差分析 ——VWAP偏差带提供了有关价格延伸

用户指南 (PDF): https://polymaria.net/manuals/maria-royal-user-guide.pdf Maria Royal 把八款 Maria 产品放进一个 EA 中。您只需在图表上加载一个机器人,然后在面板上选择 想要的项目:三个交易机器人、四个交易助手和一套图表工具。每个项目都保留自己的 magic number、自己保存的设置和自己的订单,订单注释会告诉您是哪个项目开的仓。 一切都在图表上的同一个面板中控制,机器人应用的每一条规则都能在面板或 输入参数中看到。 八个项目 Antimartingale - 带 copy 方向的 BUY 和 SELL 篮子、净值目标、loss eater 和 martin trailing。 Breakout - 围绕价格挂出的 BUY STOP 和 SELL STOP 订单阶梯:实时阶梯、5 个手数区、移动止损、 净值目标。 News - 经济新闻发布前的 BUY STOP + SELL STOP 网格,可手动或根据日历自动挂出,带 OCO、尖峰保护 和点差保护。 Trade Manager - 一键交易台:按

GUI Graphic Library 是一个面向 MQL5 开发者的已编译库,可为您的智能交易系统(EA)和指标创建窗口、面板、控件和图表。整个界面绘制在一个图表对象上,由 15 个函数驱动,因此只需几行代码即可为您的程序添加专业的面板。 这是一个面向程序员的库。它不是智能交易系统,也不会进行交易。Buy 或 Close 之类的按钮只会向您的程序发送一个事件,由您的程序决定接下来做什么。使用它需要编写或修改 MQL5 代码。 安装与输入参数指南 MT4 版本: https://www.mql5.com/en/market/product/206760 MT5 版本: https://www.mql5.com/en/market/product/206761 可以构建什么 该库包含 78 个现成元素,因此大多数面板根本不需要绘图代码: 窗口、面板、分组框、选项卡、侧边导航栏、轮播、菜单、抽屉、堆叠布局、网格和分隔条 按钮、拆分按钮、开关、复选框、单选按钮、文本和价格输入框、滑块、列表、树、表格和搜索框 日期、时间、颜色和范围选择器、日历、标签、PIN 输入框和分步向导 折线图、柱状图、

概述 SMC Liquidity Sweep with Buy Sell Zones 是一款专为 MetaTrader 5 (MT5) 原生打造的先进、 一体化机构交易指标。 它架起了传统波段分析与现代机构价格行为(Price Action)方法论之间的桥梁。 通过自动识别结构转变、 流动性事件、 订单块 (OB) 和公平价值gap (FVG), 该指标为交易者提供了清晰、 基于规则的入场执行区。 该指标采用简洁的用户界面、 内置的多时间周期警报、 自定义交互式交易品种面板以及屏幕交易指南, 可帮助交易者消除盲目猜测, 与机构订单流同步交易。 主要特性与核心组件 彩色 ZigZag 集成 具有内置的彩色 ZigZag 引擎 (DRAW_COLOR_ZIGZAG), 可通过自定义的深度 (Depth)、 偏差 (Deviation) 和回退步数 (Backstep) 参数进行配置。 包含一个可选过滤器, 可严格在最近一次市场结构破位的背景下隔离并显示 ZigZag 线段, 从而减少图表杂乱度。 市场结构与流动性追踪 (SMC) 波段结构:根据可自定义的波段长度, 自动绘制更高的高点 (H

Account Summary Panel: Your Trading Results at a Glance Stop digging through the History tab. This indicator puts your daily, weekly and monthly performance on your chart in one clean dashboard, updated automatically as you trade.
Your capital, your rules Set your own Initial Balance, whether that’s your full account or just the amount assigned to this month’s plan. Every percentage is measured against the number you choose.
Built-in goal tracking Enter one Weekly Goal % and the panel does th

AURUM PULSE — MetaTrader 4 黄金智能交易系统(EA)
您好, 您希望交易 EA 具备什么?您需要的一切都在这里。 每一个持仓都设有止损。它不使用马丁格尔、对冲或网格策略,也不是高频交易(HFT)系统,因此其设计可避免经纪商的“过度活跃”错误,并遵守常见的自营交易公司(Prop Firm)规则。 最低只需 $500 资金即可运行。
不要只听我们说:下载演示版,用您经纪商的数据在策略测试器中运行,亲自判断结果。
每笔交易都受到真实止损的保护 — 没有例外。
如需更低风险,可将 Max Positions 设为 1,确保任何时候最多只有一笔持仓。测试一下,看看它的表现。
Aurum Pulse 是一款全自动 EA,专为 XAUUSD(黄金)的 M1 和 M5 周期设计。它将快速入场引擎与独家 Tooraj-Trend 过滤器、智能隐藏式交易管理和实时控制面板相结合 — 适合追求干净执行、严格风控并希望完全掌握 EA 动态的交易者。
主要功能 Tooraj-Trend

Auto Optimized SpeedAngle 是一款机构级的动量向量化系统,通过持续的前瞻优化(Walk-Forward Optimization, WFO)彻底消除了曲线拟合(curve-fitting)。该指标没有采用在市场 状态转换时容易失效的静态输入参数,而是利用出样外验证(Out-of-Sample, OOS) dynamically 动态重新校准设置,从而确保显示的 信号代表真正的统计优势,而非历史巧合。 核心机构级架构 前瞻优化引擎(Walk-Forward Optimization Engine): 核心算法持续扫描数千种回溯周期(lookback)与阈值组合,严格将数据划分为样本内(in-sample)和样本外(out-of-sample)。只有当参数配置在未知数据环境中证明具备数学优越性时,系统才会对其进行 adoption。 量化目标函数(Quantitative Objective Functions): 优化引擎不一味追求绝对毛利,而是聚焦于机构级的稳定性指标。用户可针对系统质量数(SQN)、期望值(每笔交易的平均 R 倍数)或净 R 值进行优化,从而优

AXOS Smart Money Supply and Demand – MetaTrader 4 (MT4) 专业供需区域分析指标 智能资金分析 | 供需区域识别 | 成交量分析 | 买卖压力评估 | 移动平均线趋势过滤 | 区域自动更新 | 多市场与多时间周期支持 简介 AXOS Smart Money Supply and Demand 是一款专为 MetaTrader 4 (MT4) 开发的技术分析指标,通过分析价格走势及局部高低点(Swing High / Swing Low),识别潜在的供应区域和需求区域。 该指标为每个识别出的区域显示计算成交量信息,包括估算的买入和卖出百分比。同时,它还提供可选的移动平均线(Moving Average)趋势过滤功能,以及可自定义的区域识别参数。 该指标可用于 MetaTrader 4 支持的外汇、黄金、股票指数和加密货币图表的技术分析。 其主要目的是帮助交易者识别潜在的市场反应区域、评估估算的买卖压力,并分析价格在重要供需区域附近的表现。 1. 供应区域与需求区域 指标通过分析历史价格走势,识别潜在的供应区域和需求区域。 供应区域(Su
FREE
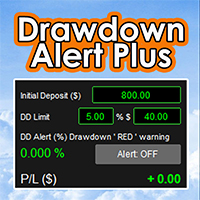
Drawdown Alert Plus: Know Your Drawdown at a Glance
Drawdown comes first Live drawdown, always visible. The panel shows your account’s floating loss (profit plus swap, all open orders) as a percentage of your Initial Deposit, updated with every price move. Three-level colour warning. Green when risk is low, orange when you pass your warning level, red when you reach your drawdown limit. You choose the colours and the warning level. Set your limit your way. Type the limit in % or in $, and the o

Daily Range Forecast 显示今天的波动幅度大概有多大、其中已经走完了多少,以及当天超过哪两个价格就比平常更大。在黄金上,它使用在黄金历史上经过测试的内置模型;在任何其他图表上,它会按该品种自身的历史进行拟合。 显示内容 图表上今天的区间带:从今天的最高价减去可能幅度,到今天的最低价加上该幅度。它只在创出新高或新低时收窄;越过任一边缘,当天就比平常大。可能幅度在当天第一根K线时确定,全天不变。 历史:最多 120 个过去的交易日,以柔和的区间带显示在K线后面;当天保持在其幅度之内为绿色,超出时为琥珀色。没有箭头,也没有文字标签。 一个小面板:今天的可能幅度,以美元(货币对为点数 pips)和百分比表示,一条显示已走完多少的进度条,以及两个价格。 黄金的美国数据发布日(CPI、非农就业、美联储决议):面板注明当天、倒计时到发布时间,并上调幅度。 Markets:一个小按钮可打开表格,以您经纪商的名称显示 7 个主要外汇货币对、US30、US500、US100 和 BTCUSD 今天的可能幅度和已走完的比例,还可加入您自己的品种(标注为未经测试),按最"新鲜"的排在前面。
FREE

概述 Gnomon Diurnal Cone 显示价格在一天中每个时刻通常会离开当日开盘价多远。对于每个日内时段 (slot),指标取最近 N 个完整交易日,绘制开盘价上方和下方偏离的中位数 (核心锥) 以及所选百分位 (外部锥)。当日的锥体在开盘时仅根据已完成的交易日确定,因此永不重绘,并向前投射到当日结束。区间预算将今日波幅与完整日波幅的中位数比较,两种收盘K线信号标记异常的扩张和衰竭。它是一个指标:从不开仓、修改或平仓。 快速开始 将指标加载到 M15 图表 (支持 M1、M5、M15、M30 和 H1)。 先保持默认值:Lookback Days 20、Outer Cone Percentile 80、Day Start Hour 0 (服务器午夜)。 面板徽章应显示 READY,金色核心线和蓝色外部线应从今日开盘价呈扇形展开。如果显示 COLLECTING,请向后滚动图表以加载更多历史。 查看图表上最近 30 天 (Days to Display),了解价格相对锥体的表现以及箭头出现的位置。 启用 Push Notification on Signal (在 工具 > 选项

Ephemeris Trade Calendar - 把账户历史变成月度盈亏日历 (MT4) Ephemeris Trade Calendar 把 MetaTrader 4 的历史记录变成图表上的月度盈亏日历。每笔已平仓交易都落在它所属的那一天:单元格按结果着色,显示盈利和亏损笔数,并汇总为每周合计。下方面板可在统计、优势图(按入场星期和小时的 P/L,以及已平仓交易的权益曲线)和当日明细之间切换,TODAY 仪表跟踪您的每日目标和亏损上限。在真实和模拟图表上它只读取历史:从不开仓、修改或平仓。 快速开始 将其加载到任意图表(任意品种、任意周期)。不需要开启 Algo Trading。 在"终端"窗口打开"账户历史"选项卡,右键选择 All History。MT4 只向程序提供该选项卡中已加载的历史;较短的时间段会让较早的月份为空,并使百分比只是近似值。 可选:设置 Symbol Filter 和 Magic Filter 以只跟踪一个品种或一个 EA,并为 TODAY 仪表设置 Daily Target / Daily Loss Limit。 检查:徽标显示 TRACKING n T

一个 MQL4 时间函数库:在 UTC 与 12 个时区之间进行考虑夏令时的正确换算,建立经纪商服务器时钟的模型(可从价格历史自动识别),提供 Sydney、Tokyo、London、New York 交易时段以及您自定义的时段,包括开盘状态、开始与结束时间和 OHLC 区间,以及 FX 交易日和周末。与 TimeGMT() 不同,它在策略测试器中给出与实盘相同的结果。它从不交易、不绘图、不写文件。您获得的是编译后的 Meridian_Session_Clock.ex4;本页即完整的 API 参考。 快速开始 将 Meridian_Session_Clock.ex4 复制到 MQL4/Libraries(文件 > 打开数据文件夹)。 把下面的 #import 代码块粘贴到您的 EA、指标或脚本中。 OnInit:MSC_DetectBroker("EURUSD", 104, base, conf, used);若已知服务器时钟,则用 MSC_SetBroker(MSC_US_DST, 120)。 使用服务器时间(TimeCurrent()、Time[i]):MSC_SessionIsO

AlphaWave – 不重绘的趋势指标,带买入/卖出信号和提醒,适用于 MT5 AlphaWave 是一款 MetaTrader 5 趋势指标,让你一眼看清趋势方向,并在趋势转变时给出明确的 BUY 或 SELL 信号。它把价格转化为一条平滑的波浪:上涨趋势为青色,下跌趋势为珊瑚色。无论哪个品种、哪个周期,你都能立刻看出应该站在市场的哪一边。 AlphaWave 专为波段交易和趋势跟随而设计。它不会对每一次小波动做出反应,而是让你跟随更大的行情方向,并在方向真正改变时提示你。 不重绘的买入和卖出信号 信号只在K线收盘后出现。一旦出现在图表上,它就固定在原位,不会移动、不会重绘,也不会消失。你在图表历史中看到的,就是实时会看到的,因此你可以在实盘使用之前客观地评估这个指标。 趋势向上转折时出现 BUY 信号,向下转折时出现 SELL 信号 只在已收盘的K线上发出信号,不重绘 内置噪音过滤,单根小K线不会扭转趋势 可选的当前K线提前预警,让你在收盘前做好准备 入场前更多确认 一笔好的趋势交易需要的不只是图表上的一条线。AlphaWave 面板把最重要的信息集中在一处: 当前趋势方向以及趋

Trebuchet Bracket Engine 是一款 MetaTrader 4 智能交易系统,交易日内波幅扩张突破。在锚点时刻(默认为日开盘)它测量最近 N 天的波幅,在锚点上方 K x 波幅处挂 buy stop、下方挂 sell stop,止损设在锚点,并在日终离场时全部平仓。每天每个方向最多一笔交易;不使用网格、马丁格尔、加仓摊平,也不隔夜持仓(除非关闭日终离场)。 快速开始 将 EA 加载到该品种的一个图表上(任意周期;逻辑使用日线和时钟),并开启 AutoTrading 与 "Allow live trading"。 先用默认值:4 天 Dual Thrust 波幅,触发距离 0.50 x 波幅,止损在锚点,服务器时间 21:00 停止入场、22:00 日终离场,风险 1 %。 锚点之后面板显示 BRACKET ARMED,并出现两张挂单:buy stop 和 sell stop。 检查:在策略测试器中以可视模式运行 XAUUSD M15 两周,可看到每个区间和交易。 推送提醒:设置 MetaQuotes ID(工具 > 选项 > 通知),并将 Push Notifica

获取 全部 我的 MT4 & MT5 工具 免费 — 点击了解获取方式
多周期与多品种指南: Multi-Timeframe & Scanner 使用指南 — 提供 12 种语言 查看 MT5 版本: Trend Reversal Probability Multi TF Scanner(MT5) 查看 MT4 版本: Trend Reversal Probability Multi TF Scanner(MT4) 查看更多产品: 全部 产品 或 交易指标、特别优惠与新品 新工具 售价为 $30 优惠适用于 首周 或 前 3 次购买 ! MQL5 上的 Trading Tools 频道 :加入我的 MQL5 频道,获取最新消息 跟踪动量持续时间,有助于识别相对于历史而言已经延长的阶段,并区分早期预警与需要满足条件的方向变化信号。结合多个品种和周期的信息,可以将注意力集中在值得进一步查看的图表上。 阅读完整的指标逻辑与使用说明 Trend Reversal Probability Multi TF Scanner Trend Reversal

免费获取我的 全部 MT4 和 MT5 工具 — 点击了解免费获取我的方式
多周期与多品种指南: Multi-Timeframe & Scanner 用户指南 — 提供 12 种语言 查看 MT5 版本: Smoothed Gaussian Trend Filter Multi TF Scanner 查看 MT4 版本: Smoothed Gaussian Trend Filter Multi TF Scanner 查看更多产品: 全部 产品 或 交易指标、特别优惠与新产品 新工具 售价为 $30 ,适用于 首周 或 前 3 次购买 ! MQL5 上的 Trading Tools 频道 :加入我的 MQL5 频道,免费获取我的最新消息 实用的趋势曲线应同时显示当前方向,以及短期走势开始与该方向不一致的时刻。本工具将平滑曲线、信号和多市场监控结合在同一观察流程中。 阅读完整的指标逻辑与使用说明 Smoothed Gaussian Trend Filter Multi TF Scanner 是一款趋势观察指标,结合高斯滤波与线性回归平滑,在曲线上直接显示

获取我的 全部 MT4 & MT5 工具 ,免费 — 点击了解领取方式
多时间周期 & 多品种指南: Multi-Timeframe & Scanner 使用指南 - 提供 12 种语言版本 查看 MT5 版本: Zero Lag Trend Signals Multi TF Scanner 的 MT5 版本 查看 MT4 版本: Zero Lag Trend Signals Multi TF Scanner 的 MT4 版本 查看更多产品: 全部 产品 或 交易指标、特别优惠 & 新产品 新工具 售价为 $30 适用于 首周 或 前 3 次购买 ! MQL5 上的 Trading Tools 频道 :加入我的 MQL5 频道,获取我的最新消息 有效跟踪趋势始于理解图表信息:何时确立新方向、何时价格只是在回调,以及何时出现顺应既有方向的信号。清晰的显示方式,结合对多个品种和时间周期的观察,有助于更有条理地对比这些变化。 阅读 Zero Lag Trend Signals Multi TF Scanner 的完整逻辑与使用说明 Zero La

免费获取 全部 我的 MT4 & MT5 工具 — 点击了解获取方式
多时间周期与多品种指南: Multi-Timeframe 与 Scanner 使用指南 — 提供12种语言版本 查看 MT5 版本: Trend Fair Value Gap Delta Multi TF Scanner(MT5版) 查看 MT4 版本: Trend Fair Value Gap Delta Multi TF Scanner(MT4版) 查看更多产品: 全部产 品 或 交易指标、特别优惠与新品发布 新工具 售价为 $30 优惠适用于 首周 或 前3次购买 ! MQL5 交易工具频道 :加入我的 MQL5 频道,获取我的最新消息 观察价格区域时,您需要了解当前趋势、哪些区域仍值得关注,以及价格返回时出现了怎样的反应。将这三个层面的信息联系起来,可以让图表观察形成清晰的顺序:先判断背景,再评估信号。 了解详情: Trend Fair Value Gap Delta Multi TF Scanner 的逻辑与使用方法 Trend Fair Value Gap D

Analyzator Optim 是一个与优化结果一起工作的实用程序。 她在长达5年的优化深度中分析了大量的数据阵列,并按年单独进行。 完成数据分析后,它将显示前5名前10名或前20名的优化选项,这些选项随着时间的推移会产生更稳定的结果,并且值得您关注。
请参阅使用说明以了解如何使用该工具。 Instructions on how to use. Version MT5
重要提示:策略测试器中的演示版工具不会进行数据分析,原因显而易见。
Analyzator Optim 能帮助解决的关键点是:质量、数量和灵活性。
1. 质量。 目标是找到一个优化结果,不仅在第一年表现良好,而且在所有其他年份也能保持良好表现。 (换句话说,就是选择一个最优且更稳定的结果。) 采用这种方法,就能找到一个更有可能在未来持续保持稳定结果的方案。
为了避免优化过程中的不同年份相互影响,必须每年分别进行优化 。 这样就能清楚地看出哪些结果是暂时的(例如:当前年度表现良好,但在前几年表现不佳甚至亏损),而哪些结果在所有年份中都表现最佳。
Analyzator Optim 具备 3 年和 5 年的优

AiX GOLD — 专为黄金而生。 专注一个市场。最多七种突破策略。可选 AI 评估。 AiX 在已形成的日线和小时级别价位寻找突破机会。它准备入场、设置止损和止盈,然后按照保本和移动止损规则管理交易。 了解 AiX Gold 背后的故事:交易策略、长期回测,以及 Jev 的应用方式。 不以加仓回补亏损。不做网格。不用马丁格尔。 每笔交易从一开始就设有预先确定的止损。 每个入场挂单提交时均已附带止损和止盈。每次入场都必须符合策略条件。AiX 不会为了弥补亏损而增加交易或提高交易手数。 下次涨价前 — 10份中仅剩4份。 按当前价格销售的10份中,仅剩4份。这4份售完后,价格将上调。 查看我的 MQL5 信号和交易记录。 市场在变。等待成交的挂单,也值得重新评估。 TypeSafe 是 Jev 背后的 AI 公司,Jev 是专为快速、结构化决策打造的模型。 Jev 并非用于对话和生成文本的大语言模型(LLM)。它评估所提供的信息,返回有利、不利或不确定等分类,以及相应的置信度估计。 AiX 提供量化的价格行为、波动率、市场结构以及每个交易设置的具体信息。Jev 评估市场环境、价格接近突

ICT CISD 实现了 ICT 方法论中的 Change in State of Delivery 概念。指标跟踪当前 delivery 序列——同方向蜡烛收盘价的不间断序列——并标记价格反向收穿该序列开盘价的那一刻。该收盘价即为 CISD:短期 delivery 从卖出转为买入(或相反)的位置。每个序列标记一个 CISD,且必须以蜡烛实体收穿该水平(影线不算)。 所有内容直接绘制在图表上:CISD 水平线、信号箭头,以及完全模拟的交易投影——入场、止损和两个目标。指标不下单、不修改也不管理任何订单;入场、止损和目标只是图表上的图形。 主要功能: - 看涨与看跌 CISD 信号,带箭头、水平线和标签。 - 两种绘制的入场模型:CISD 水平处的模拟限价入场(retest,默认),或信号蜡烛收盘价入场。 - 按信号绘制的风险框架:止损位于 delivery 腿极值之外并加 ATR 缓冲,两个目标为可调 R 倍数。 - 实时信息面板:当前 bull/bear 水平、待触发的已绘制 setup、扫描历史中的信号数量,以及最近信号及其入场与止损。 - 可选上下文过滤器——每个都是可开可关的规

Big Stoch — 指标使用说明 指标如何工作 Big Stoch 可在主价格图表上同时显示最多四个随机指标(Stochastic)迷你面板。每个面板根据自己选择的周期独立计算,并拥有独立的 %K、Slowing 和 %D 参数。因此,交易者可以同时观察 M15、M30、H1 和 H4,而不必切换主图周期。振荡指标的数值范围为 0–100。 MT5-version: https://www.mql5.com/en/market/product/205700 交易者如何使用 该指标用于比较短期动量与较高周期的市场背景,只负责展示信息,不会替交易者作出交易决定。 观察较高周期。 先查看 H1 或 H4 面板,判断动量处于区间上部、下部还是中部,再使用 M15 或 M30 观察更短期的变化。 观察两条线的交叉。 %K 反应较快,%D 的平滑程度更高。%K 与 %D 的交叉可能表示短期动量正在变化,但不能单独视为入场确认;还应结合趋势、关键价位和价格走势判断。 观察极值区域。 高于上方阈值通常称为超买,低于下方阈值通常称为超卖。强趋势中,线条可能长时间停留在这些区域,因此触及区域并不自动意

用户指南 (PDF): https://polymaria.net/manuals/maria-breakout-user-guide.pdf Maria Breakout 会在当前价格上方挂出一组 BUY STOP 订单,在下方挂出一组 SELL STOP 订单。当市场 突破时,该方向的止损单会依次成交,顺势而行。移动止损锁定每笔交易的利润,实时阶梯让新的止损单始终挂在价格前方, loss eater 用已经平仓的利润抵消亏损交易,净值目标在固定盈利处结束整个周期并开始新的阶梯。一切都在图表上的 同一个面板中控制,机器人应用的每一条规则都能在面板或输入参数中看到。 阶梯 两个方向: BOTH 、 ONLY BUY 或 ONLY SELL 。在面板上一键选择。 起始距离和价位间距以 USD 表示: 即第 1 区手数在该距离上赚到的金额。0.01 手时,$1.40 在黄金上是 1.40 的价格波动, 在 EURUSD 上是 14 点,因此同一套设置适用于任何品种。也可使用价格、% 和点数单位。 5 个手数区,由近到远: 靠近价格处用小手数,远处用更大手数。每个区都有自己的手数和价位数量(

PRO PRICE ACTION PB EA ——一款基于价格行为研究的出色自动交易系统! 无需网格!提供 5 个设置文件!支持 D1 时间框架!
交易理念基于著名的强大价格行为形态——PinBar! 这款 EA 是一项非常不错的投资——它将为您带来多年的收益,所有设置文件都具有正的数学期望值!
下载 EA 设置文件进行测试和交易: AUDUSD Set_file NZDJPY Set_file CADJPY Set_file EURCAD Set_file GBPJPY Set_file
EA 功能: - EA 可同时运行 5 个货币对。 - 系统不会像许多短线交易者那样因高额佣金而浪费资金。 - 无严格的点差要求——EA 可用于任何账户。 - 系统不使用任何危险的网格交易方法。 - EA 默认内置复利资金管理。 - 每笔交易都设有止损和止盈,经纪商无法查看。 - 止损和止盈是动态的,默认情况下会根据市场波动进行调整。 - EA 设置中提供补偿模式。 - 内置趋势、震荡指标和日线过滤器。 - 交易货币对: AUDUSD , NZDJPY, GBPJPY, CADJPY,

OSB 振荡器 - 是一种高级自定义指标,高效的价格行为辅助工具。 - 使用先进的新计算方法。 - 新一代振荡器 - 查看图片了解如何使用它。 - OSB 振荡器是一种辅助工具,用于查找价格行为、背离和超卖/超买信号的准确切入点。 - 超卖值:低于 30。 - 超买值:超过 70。 - 使用此指标有很多机会升级标准策略。 - 它比标准振荡器更快、更准确。 - 指标设置非常简单。它只有 1 个参数 - 灵敏度。 如何使用: - 作为价格行为过滤器(见图)。 - 作为主要趋势方向的进入信号(见图)。 - 作为具有准确信号的背离指标(见图)。 ................................................... Click here to see high quality Trading Robots and Indicators! 这是仅在此 MQL5 网站上提供的原创产品。

适用于MT4平台的“趋势横盘专业直方图”加密货币外汇指标,无重绘。 - “趋势横盘专业直方图”指标非常灵敏,比任何标准移动平均线都更加高效。 - 该指标旨在显示当前市场状况:横盘、上升趋势、下降趋势。 - 该指标有三种颜色:黄色代表横盘,红色代表下降趋势,绿色代表上升趋势(颜色可在设置中更改)。 - 支持手机和电脑端提醒。 - 该指标非常适合与其他交易方法结合使用:价格行为、剥头皮交易、动量交易以及其他指标。 - 该指标带有信息显示功能,可显示其所关联的外汇货币对的当前点差和隔夜利息。 - 信息显示还显示账户余额、净值和保证金。 - 信息显示可以放置在图表的任意角落。 Click here to see high quality Trading Robots and Indicators! 本产品为原创产品,仅在MQL5网站提供。

Fusion EA Master — MetaTrader 4 智能交易系统 Fusion EA Master 是一款适用于 MetaTrader 4 的基于规则的多重过滤智能交易系统(EA)。其主要交易品种为 XAUUSD(黄金),在“评论”页面发布的设置文件均适用于 XAUUSD。只有当所有已启用的过滤器方向一致,且交易设置达到输入参数中设定的最低信号评分时,才会开仓。 适合哪些交易者 适合需要一款基于规则的 XAUUSD EA 的交易者:每次只持有一个仓位、每笔交易都有止损、设有每日亏损限制,并在图表上提供清晰的面板。适合偏好较少但经过筛选的入场机会、而不是持续暴露于市场的交易者。 不适合哪些交易者 不适合寻找马丁格尔、网格或摊平加仓系统,或期望保证月收益的交易者。Fusion EA Master 不使用马丁格尔、网格或摊平加仓。它每个品种和魔术号只开一个仓位,不会对亏损仓位加仓。 交易逻辑 默认配置使用 H1 周期的 EMA50 趋势过滤器和 M15 周期的 RSI 动能确认。两个周期都可以在输入参数中修改。每个交易设置会根据其与 EMA 的距离、RSI 数值以及附近的支撑或阻

Big BB — 在同一张图表上显示四个周期布林带的迷你面板 Big BB 直接在价格图表上放置紧凑的面板。每个面板显示所选周期最近的K线以及该周期的布林带。无需在 M15、M30、H1 和 D1 之间来回切换,所有周期同时一目了然。每个周期都有各自独立的布林带周期和偏差设置。 MetaTrader 5 版本: https://www.mql5.com/en/market/product/206940 图表上显示的内容 标题栏,包含指标名称和折叠按钮 [-] / [+]。 最多四个面板。启用一至三个时纵向排列,四个全部启用时排成 2 × 2 的网格。 每个面板左侧有周期标签(15、30、1H、D、W、M),中间是最近若干根K线和三条线:上轨、中轨、下轨。 面板始终显示指标所在图表的品种,并自动刷新。 面板数据的含义 周期标签 :表示该面板对应的时间周期。 K线 :显示该周期最近的价格走势,颜色表示K线方向(阳线或阴线),最右侧一根为当前K线。 中轨 :表示该周期价格的平衡水平。价格位于中轨上方,说明买方占优;位于下方,说明卖方占优。 上轨与下轨 :框出价格通常的波动范围。价格接近或突破

Prop Reaper:多策略黄金突破组合 在一次安装中运行六个独立的 XAUUSD 突破策略。一个日线策略和五个 H4 策略,每个策略都有自己的 Magic Number。 价格: 当前 $249。每售出 10 份,价格上涨 $50。最终价格:$449。 为什么在两个周期上使用六个策略 单一突破形态依赖于某一个想法在某一个市场阶段有效。Prop Reaper 结合了六种不同的突破方法,因此组合不依赖于单一入场规则。 日线策略瞄准更大、更慢的行情。五个 H4 策略交易较短的波段。 由于使用日线和 H4 数据,该 EA 对点差和执行速度的敏感度低于 M1-M15 的剥头皮 EA。 平均:每月约 15-20 笔交易。 交易方式 每个策略等待价格突破既定价位。 入场时附带各自的止损和止盈。 通过保本和移动止损管理交易。 不使用网格、不使用马丁格尔、不使用摊平加仓。每笔交易都有止损。 策略的筛选与测试方式 这些策略通过内部研究流程创建并进行比较。 筛选仅使用样本内区间 2010.01.01 – 2021.09.21。 随后在样本外数据 2021.09.22 – 2026.10.10 上测试该组

Crypto_Forex MT4 指标“黄昏之星形态”,无需重绘,无延迟。 ......................................................................... - “黄昏之星形态”指标是一款非常强大的价格行为交易指标。 - 指标可检测图表上的看跌黄昏之星形态:图表上显示红色箭头信号(见图)。 - 支持 PC、手机和电子邮件提醒。 - 其兄弟——看涨“晨星形态”指标也已推出(点击下方链接)。 - “黄昏之星形态”指标非常适合与支撑/阻力位结合使用。 .................................................... Click here to see high quality Trading Robots and Indicators! 这是仅在 MQL5 网站上提供的原创产品。

Crypto_Forex 指标 HTF 随机指标适用于 MT4。 ....................................................... - 随机震荡指标是市场上最好的指标之一 - 是许多交易者的完美工具。HTF 表示 - 更高时间框架。 - 超买区域 - 高于 80;超卖区域 - 低于 20。 - HTF 随机指标非常适合多时间框架交易系统,尤其是价格行动条目。 - 此指标允许您将更高时间框架的随机指标附加到当前图表 --> 这是专业的交易方法。 - 指标具有内置的移动和 PC 警报。 - HTF 随机震荡指标也可用于常规背离检测。 .................................................... Click here to see high quality Trading Robots and Indicators! 它是仅在此 MQL5 网站上提供的原创产品。

横盘交易专业版 EA - 是一款高级单货币对网格交易系统! 这款EA是一款功能强大的NZDCAD货币对交易系统,盈利稳定。M5时间框架! 下载 EA 设置文件进行测试和交易: NZDCAD Set_file
EA 的突出特点: - EA 会根据市场波动自动调整入场点和出场点。 - EA 可以同时管理买单和卖单。 - EA 还会根据波动自动构建动态网格。 - 无点差要求 - EA 可用于任何账户。 - 系统不会像许多短线交易者那样浪费资金支付佣金,只需使用标准账户即可。 - 根据账户余额自动计算手数。 - 时间框架:M5。 - 交易货币对:NZDCAD。 - 运行时间:EA 每周 5 天、每天 24 小时运行。 - EA 带有信息显示功能 - 显示当前所连接外汇货币对的点差和隔夜利息。 - 显示屏还会显示账户余额、净值和保证金。 - 信息显示可以位于图表的任意角落。 安装方法: - 打开以下图表:NZDCAD。 - 在图表上选择 M5 时间周期。 - 将智能交易系统 (EA) 附加到图表。 - 将相应的“Set_file”文件应用到 EA。 - 让电脑 24/7 全天候运行(或者

Big KC — 多周期肯特纳通道面板 Big KC 将最多四个周期的肯特纳通道(Keltner Channel)以紧凑面板的形式直接显示在价格图表上。无需切换图表或打开额外窗口,即可同时观察多个周期的波动率和方向。每个周期都有独立的通道设置。 MetaTrader 5 version: https://www.mql5.com/en/market/product/207053
工作方式 指标在图表上绘制一个面板,面板内最多包含四个小窗口。每个小窗口对应一个周期,显示当前图表品种的最近K线,以及肯特纳通道的三条线:上轨、中轨和下轨。四个周期全部启用时,窗口按 2x2 网格排列,否则按单列排列。面板大小会根据图表和屏幕分辨率自动调整,也可以按图表宽度的百分比设置。数据每秒刷新一次。 欢迎订阅我的频道,我会在那里发布最新作品,其中也包括免费作品: https://www.mql5.com/en/channels/algotrader 可以拖动面板标题移动面板,并用标题右侧的按钮折叠面板。位置和折叠状态会针对每个图表分别保存。 面板数据的含义 窗口左侧的标签 (例如 15、30、1H、D

Trade Autopilot 管理您在电脑或手机上手动开立的交易。没有止损时它会添加止损,将其移至保本,平掉部分仓位,并对剩余仓位进行追踪止损。一切都以 R(您的初始风险)和 ATR 来衡量,因此同一设置适用于黄金、指数和外汇。 首发价:30 USD,比常规价 60 USD 优惠 50%。 何时入场由您决定。之后由 Trade Autopilot 负责管理这笔交易。它不开立交易,也不提供信号。将它加载到一个图表上,即可管理账户中所有交易品种的交易。 每笔交易的四个步骤 Stop loss (止损):如果您开立的交易没有止损,它会在距入场价 2 ATR 处设置止损。这个距离即为 1R。 Breakeven (保本):达到 +1R 时,止损移至入场价加上点差和一个小余量。 Partial (部分平仓):达到 +1.5R 时,平掉 50% 的仓位并锁定利润。 Trailing (追踪):部分平仓后,止损以 1.5 ATR 的距离跟随价格,并且只朝对您有利的方向移动。 以上是 Balanced 风格的数值。如果您设置了止盈,它永远不会被改动。 只需一项设置:管理风格 Conservative

高级自定义加密货币外汇指标“自适应功率震荡指标”——MT4平台高效辅助交易工具! ..................................................................................................... - 该指标是一款非常实用的技术动量指标——新一代震荡指标。 - “自适应功率震荡指标”具有可调节的自适应超卖/超买区域。 - 超卖区域:浅蓝色线下方;超买区域:品红色线上方。 - 使用“自适应功率震荡指标”可在动态超卖/超买区域的出场点位上找到精准的交易入场点。 - 该指标也非常适合与价格行为模式结合使用。 - 它比标准震荡指标更加精准。 - 该指标可用于任何时间周期。 - 内置PC和移动设备提醒功能。 Click here to see high quality Trading Robots and Indicators! 本产品为原创产品,仅在MQL5网站独家销售。

适用于MT4平台的加密货币外汇指标——盘整柱形态。无重绘,无延迟。 ................................................................................... - “盘整柱形态”指标是一款功能强大的突破导向型价格行为交易指标。 - 高盈亏比(R/R)。 - 该指标可检测单根K线内的价格盘整,并显示:突破方向、挂单位置和止损位置。 - 看涨盘整柱形态:图表上显示蓝色箭头信号(见图)。 - 看跌盘整柱形态:图表上显示红色箭头信号(见图)。 - 支持PC和移动设备提醒。 - “盘整柱形态”指标可与支撑/阻力位结合使用。 Click here to see high quality Trading Robots and Indicators! 本产品为原创产品,仅在MQL5网站独家销售。

Prop Eater:多策略黄金突破交易组合 认识一下 Prop Eater——Prop Reaper 的小兄弟。四套独立突破策略、两个时间周期、专注一个市场:XAUUSD。 已经了解 Prop Reaper?现在来认识这个家族的新成员。 Prop Eater 延续了 Prop Reaper 的多策略黄金突破交易理念,同时采用了不同的组合配置:四套策略分别运行于 6H 和 12H 时间周期。 Prop Eater 专为 XAUUSD 黄金开发,采用内部研发的策略,将多种突破交易思路整合到一款 EA 中,让交易不再依赖单一策略。 四套策略。两个时间周期。一个完整的突破交易组合。 价格: 当前为 $49。每售出 5 份,价格上涨 $25。最终价格:$149。 Prop Reaper 产品家族 Prop Eater 是 Prop Reaper 的小兄弟,但两款 EA 各自拥有不同的策略组合和时间周期配置。 Prop Reaper: 六套策略——一套 Daily 策略和五套 H4 策略。 Prop Eater: 四套策略——两套 6H 策略和两套 12H 策略。 两款产品都围绕黄金的系统化突破

SMC Algo Spartan reads market structure the way a smart money trader marks it by hand, and draws it for you. It finds the swing highs and lows, labels every break of structure as a BOS (the trend continues) or a CHoCH (the trend turns), marks the order block each break leaves behind, and prints a buy or sell arrow when price comes back into a live block and a candle rejects it, with an entry, a stop and two targets drawn beside it. Everything is decided when a bar closes and stays where it was

MultiRange Stop Loss Manager MT4 MultiRange Stop Loss Manager MT4 is a utility designed to temporarily remove Stop Loss levels during specific time windows and automatically restore them afterwards. Its main purpose is to protect open and pending orders during market conditions in which the Bid/Ask spread can widen sharply for technical market reasons , rather than because the trading strategy itself has failed. This can be especially useful: around the daily trading rollover , generally around

MADA GOLD SCALPER EA GOLD (XAUUSD) - M1 ONLY -------------------------------------------------------------------------------- MADA GOLD SCALPER EA 是一款专为黄金 (XAUUSD) 打造的机构级自动化交易系统。该EA严格运行于 1分钟 (M1) 时间周期,结合多重数学过滤算法与动态动量指标,在严格控制风险的前提下捕捉高概率交易机会。
-------------------------------------------------------------------------------- 核心策略与技术优势 --------------------------------------------------------------------------------
1. 自适应趋势与动量引擎 - 内置高级数学降噪过滤引擎,精准识别主线趋势方向。 - 有效过滤低时间周期的市场噪音与假突破。
2.

Fake Breakout Retest EA is a counter-trend Expert Advisor for MetaTrader 4. It finds breakouts that are likely to fail and trades against them, instead of following them. How it works:
Neckline: a strong ATR impulse creates a swing high or swing low. That level becomes the neckline. Breakout: price closes beyond the neckline for the number of confirm bars you set. Retest: price returns to the neckline zone and prints a bounce candle. Entry: the EA trades against the breakout. A bullish breakout
FREE

WANT TO GET HILO FLOW MANAGEMENT WITHOUT PAYING FOR THE INDICATOR LICENSE? Discover our partnership with TMGM and learn how to request your Hilo Flow Management license for MetaTrader 4 or MetaTrader 5 at no additional license cost, subject to the partnership requirements. ACCESS THE COMPLETE STEP-BY-STEP GUIDE:
https://dougscalper.com.br/hiloflow/ To qualify, you must open an eligible account through the partnership link, make an initial deposit of US$200 with TMGM, and submit your license req

Renko Robot: Expert Advisor for MetaTrader 4 Many traders lose money because of market noise: false breakouts, insignificant small moves, and emotional decisions. This robot is built on Renko charts, which only track price movement, not time, in order to make trends easier to read. What the robot does Automatic order execution based on fixed rules Signals based on Renko bricks (adjustable brick size) Customizable stop loss and take profit Risk management: fixed lot size or % of account balance

Charts247 Market Structure Sessions
The full Charts247 market structure: swings, CHoCH and BOS, intraday highs and lows by session, structure trend, session read, zigzag counter, break count, alerts and a control panel. Closed candles only.
Charts247 Market Structure Sessions shows market structure the way the Waves of Success method reads it, and places each intraday high and low in the session where it printed. Everything is calculated on closed candles; nothing on history is redrawn. What

Charts247 Wave Master MTF
A complete 0-5 wave count with a built-in rules panel: it reads both directions on your chart and on a higher timeframe, grades every wave, maps the major structure and marks where price spent the most time. Closed candles only. Most wave tools leave you with numbers on a chart and the hard part still to do: is this wave worth trading, which side has the trend, and does the bigger timeframe agree? Wave Master MTF answers all three on one screen. It runs the Waves of S

A Malaysian SnR (MSNR) indicator that draws A, V, gap and OCL levels from three timeframes, keeps track of which levels are still fresh, and reads the MSNR storyline for you. The MSNR radar watches your Market Watch and shows which symbol sits at a fresh D1 or H4 level right now. Every level and every storyline turn is confirmed on a closed candle, so the levels you see on past candles are the same levels the chart showed live. What you get All MSNR level types: A levels (resistance), V levels (

Supreme Range Profile Structure finds sideways ranges from the market's own swings, shows where the volume traded inside each one, marks the moves that left the range and failed, and draws a position tool when a range finally breaks. A range is drawn only when recent swing highs and lows cluster tightly, alternate often enough, span enough bars and fit an ATR width window, so it marks a real balance rather than any pause. Breaks and failed breaks are decided on a closed bar and stay where they

Supreme Dynamic Profile builds a volume profile of the most recent bars and turns it into a set of key levels. It finds the point of control, the value area and the volume peaks of the profile, keeps them on the chart as zones and lines, and marks every bar where price breaks a level, rejects it or comes back to retest it. A table in the corner sums up where price stands against the profile. Every level and every marker is decided when a bar closes and stays where it was drawn.
- MT5 version -

Supreme Power House reads market structure, grades every signal against seven filters and draws a complete trade plan for each one. It prints a BUY or a SELL when a candle closes beyond the latest swing: a change of character (CHoCH) when the break turns the structure, a break of structure (BOS) when it continues it. Each signal comes with an entry, a stop, up to three targets and a grade from A to C, surrounded by an adaptive trend ribbon, ICT zones and a dashboard of six timeframes. Everythin

Velox Momentum Confluence Engine puts six momentum and money-flow readings on one scale and blends them into a single score from -100 to +100. Instead of six separate windows, you read one line, its signal line, and how many of the six agree with the move. A signal needs the score to cross its signal line with enough agreement behind it. Each signal maps an ATR stop and three targets, the candles take the score's colour, and a dashboard shows the state of every component and filter.
- MT5 vers

Supreme Pressure Signals looks for one event: a burst that runs out of fuel. A bar's high or low travels far beyond a volatility band around its average, the next bar stops expanding, and the indicator marks a signal against the burst, back toward the average. Around that core it maps pressure clusters at swing points, tracks timed session ranges, rates every signal from 0 to 10 with up to four stars, and draws a ticket with an entry, a stop and three targets.
- MT5 version - Trading guide - U

Supreme Momentum Confluence turns six oscillators into one reading. RSI, the smoothed stochastic, CCI, the MACD histogram, rate of change and the Money Flow Index are each rescaled to the same -100 to +100 range and averaged by weight. One line, its signal line and the share of the six that agree then tell you what six windows would. A signal needs that line to cross its signal line with enough of the weight behind it. Each signal maps an ATR stop and three targets, the candles take the score's

Box Theory Indicator
This is a free educational indicator that implements the core visual concept of the "Box Theory" trading approach.
Features: • Draws a box using the previous day's High and Low • Projects the box forward for the current day (24-hour width) • Optional middle line • Price labels (High / Mid / Low) • Height can be updated only during the first X minutes of the day (default 15 minutes) • Clean and lightweight (uses chart objects only)
Inspired by the free video: "How to trad
FREE

Step right up, traders! This one is FREE. And it just might change how you read your own results.
Still squinting at MT4's account history, trying to work out which pairs, days and hours are actually paying you? Stop squinting. Trade Report to CSV turns your closed trades into ONE clean spreadsheet-ready file: one trade per row, and a pile of ready-made summaries sitting right beside it. Run it, open it in Excel, and the story of your trading is right there.
WHAT YOU GET
Main table, one row
FREE

REAL RAW| Suite per volumi istituzionali e blocchi di ordini REAL RAW è un indicatore di trading professionale all'avanguardia e ultra-preciso, progettato per i trader d'élite che esigono assoluta trasparenza dal mercato. Realizzato senza smoothing artificiale o filtri matematici ritardati, questo strumento opera al 100% su dati istituzionali grezzi per rivelare le reali tracce del capitale investito, i principali pool di liquidità e le zone di accumulazione ad alto volume in cui viene impiegat

AlgoLab Trend Zones combines trend, higher-timeframe context and automatic support/resistance zones in one clean indicator. Main features Trend filter: slow EMA (200) and fast EMA (50). The panel shows the trend as BULLISH, BEARISH or NEUTRAL. Higher-timeframe EMA without repainting: it uses the value of the last closed higher-timeframe bar (default D1). Automatic support and resistance zones from swing pivots. Zone thickness adapts to volatility (ATR) and zones are removed automatically when pr
FREE
123456789101112131415161718192021222324252627282930313233343536373839404142434445464748495051525354555657585960616263646566676869707172737475767778798081828384858687888990919293949596979899100101102103104105106107108109110111112113114115116117118119120121122123124125126127128129130131132133134135136137138139140141142143144145146147148149150151152153154155156157158159160161162163164165166167168169170171172173174175176177178179180181182183184185186187188189190191192193194195196197198199200201202203204205206207208209210211212213214215216217218219220221222223224225226227228229230231232233234235236237238239240241242243244245246247248249250251252253254255256257258259260261262263264265266267268269270271272273274275276277278279280281282283284285286287288289290291292293294295296297298299300301302303304305306307308309310311312313314315316317318319320321322323324325326327328329330331332333334335336337338339340341342343344345346347348349350351352353354355356357358359360361362363364365366367368369
学习如何在MetaTrader AppStore上购买EA交易,MetaTrader平台的应用程序商店。
MQL5.community支付系统支持通过PayPay、银行卡和热门付款系统进行交易。为更好的客户体验我们强烈建议您在购买前测试EA交易。
