适用于MetaTrader 4的新EA交易和指标 - 178
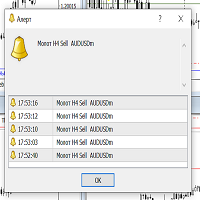
The indicator is useful for experienced traders and beginners. Displays the HAMMER candle pattern.
Simultaneously scans H1, H4, D1 and displays the corresponding alert on the screen, accompanied by an audible signal.
The alert displays information about the timeframe of the pattern and the trading symbol on which the pattern appeared.
Only you can make a decision about entering the market based on the pattern. Since it is better to enter the market from the support and resistance levels, I r
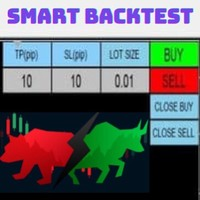
For those who are still not confident in their system or are testing new techniques to make it easier without wasting time to change the charts one by one, we recommend EA Smart Backtest to help you backtest your system efficiently.
-The EA is intended to Backtest your system. -Able to open buy or sell in visual mode and can modify values for LOT, SL, TP. -The chart also shows the Balance Equity Profit status. -Can choose to close, Buy, Close, Sell

Day Trades Resistance and Support (daytradesSR) is an indicator composed of 1. The main line (support/resistance line), which shows i. either UP or DOWN trend ii. levels of dynamic support or resistance 2. A specific range defined by a line for range high and another line for range low. These lines serve as weak secondary support or resistance . 3. When the main line (support/resistance line) is first hit by the price after a detected trend reversal , either an UP ARROW (sup

BolingCustom is a Trend indicator designed for all Time frames and all currency pairs. For a better experience, it is recommended to use in time frames above 15 minutes.
Due to its understandable and simple presentation on the chart, even beginners can easily learn how to use it.
If you have any problems or questions, let us know. We will be happy to contact you: Direct massage
How this indicator works is that it shows the trend using a combination of several indicators such as the Bolling
FREE

Are you unhappy with the size of the main chart when using oscillators? You can add MACD, RSI, Stochastic, ATR and Momentum indicators using Main Chart Oscillators. Vertical Size : Vertical size of indicator's window Drawing Mode : Add Oscillators on same section or create a new section for any of them Draw Top Line : Draws a line in the top of indicator's section to separate it Top Line Style : Style of top line Top Line Color : Color of top line Top Line Width : Width of top line Show Indicat
The Ergodic is an oscillator based on William Blau's True Strength Index, which is based on Momentum to which double smoothing has been applied. 100* EMA(EMA(Momentum) / EMA(EMA( |Momentum|)) The Ergodic adds a moving average to the TSI which will act as a Signal Line. This oscillator can be used to identify trend reversal zones, or trend continuation phases.
VERY USEFUL WHEN USED IN CONJUNCTION WITH THE CURRENCY INDEX.
L' Ergodic è un oscillatore basato sul True Strenght Index di William Bla
FREE

Moving indicator. It is written so that it doesn't signal when two moving averages cross. Easy to operate. It performed well on European and Asian currencies. Designed for long-term and medium-term types of trading. Индикатор мувингов. Написан так что даёт сигнал при пересечении двух скользящих. Прост в управлении. Хорошо себя показал на европейских и азиатских валютах. Рассчитан на долгосрочный тип торговли.
FREE

This pointer is supplied of a double smoothing in such way to succeed to be more reactive of a blunt Moving Average but without tracing the noises of bottom of the market. Its use will have to be exclusively turned to the search and to the identification of the trend in action (even if graphically it could seem an indicator that indicates an inversion of the prices) because the first useful signal is had to the opening of the successive bar to that one that has made to invert the sense of the
FREE
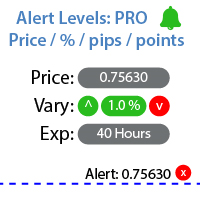
Utility for setting notifications when a given price level is reached. My #1 Utility : includes 65+ functions | Contact me if you have any questions The alert can be set in three ways: Manual entry of the price level; Setting the price change: in percent / in pips / in market points; By moving the level with the mouse: there is also a magnet function, when activated, the level will snap to the nearest OHLC values; Optionally, you can enable / disable each type of alert: Notifications in t

EURGBPを使用した両建てスキャルピングを行います。
相場の波にしっかり合わせて、ナンピンを行いコツコツ、たまにドカンと利益を重ねていきます。
M1、M5で使える完全放置型EAです。
LongOnlyやSellOnlyに設定していただくことも可能ですのでスキャルピングなのに、融通の利くEAと言えます。
また、比較的ボラティリティの高いユーロポンドのこれまでの相場で幾度もシミュレーションを重ねてますので適確な注文タイミングになっておりますのでボラティリティで攻めたい方にもぴったりです
途中でナンピンを止めたいと思ったときは自動売買をオフにしていただき、 相場がもどったときにオンしていただければいいところで決済もしてくれます。
【パラメータ】 ロット数:1ポジション目のロット数です。ナンピンするほどに自動で増加していきます。 (0.01⇒0.01⇒0.02⇒0.03・・・) ロスカット:損切りの有効無効を切り替えます ロスカットpips:各ポジションの損切りpipsを指定します。ロスカットがオンの場合に有効です。

Teamwork GBPUSD EA is based on the logic of order strategies and profit-taking strategies working as a team. In general, EA consists of two parts as strategies and take profits section. Strategies section are special strategies that we create for symbols. Strategies continue to open buy and sell orders independently. Takeprofits closes orders that are opened by working as a team. Take Profits logic is that profitable orders go by closing lost orders. They never work selfishly. In this way,

Teamwork EURUSD EA is based on the logic of order strategies and profit-taking strategies working as a team. In general, EA consists of two parts as strategies and take profits section. Strategies section are special strategies that we create for symbols. Strategies continue to open buy and sell orders independently. Takeprofits closes orders that are opened by working as a team. Take Profits logic is that profitable orders go by closing lost orders. They never work selfishly. In this way,

WORLD FOREX ROBOT TRADER
World Forex Robot Trader is the Forex Robot for the sophisticated and conservative busy investors and traders like you. It will enable you to start right away. You can trade as you learn and master more complex trading techniques. With this EA, your friends will be amazed of the quick 180-degree turn of your trading venture. Be the one that you truly deserve and destined to be a high achiever. G U I D E E B O O K Download it here for free:

Teamwork EUR GBP EA is based on the logic of order strategies and profit-taking strategies working as a team. In general, EA consists of two parts as strategies and take profits section. Strategies section are special strategies that we create for symbols. Strategies continue to open buy and sell orders independently. Takeprofits closes orders that are opened by working as a team. Take Profits logic is that profitable orders go by closing lost orders. They never work selfishly. In this way,

Script risk management, which calculates for you the potential profit, possible loss, risk percentage, on the entire account and for each instrument. Shows where stop-losses and take-profits are not set.
Each line summarizes the number of open transactions for a specific instrument and calculates the percentage of loss from the total deposit. Beyond the line, the final calculation of the balance is summarized, if all transactions are triggered by stop loss; Potential loss, as the sum of all st
FREE

This indicator calculates Correlation among currency pairs (Selected by user) to find the least and/or most correlated symbols in real time. Correlation ranges from -100% to +100%, where -100% represents currencies moving in opposite directions (negative correlation) and +100% represents currencies moving in the same direction.
Note The Correlation more than 80 (Adjustable) between two currency pairs, Shows that they are quite similar in the kind of movement and side. The Correlation less than
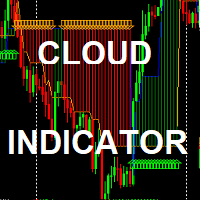
The Simple Cloud Indicator : (FREE limited time for evaluation) Strategy: Strategy is based on moving averages indicator in addition to support /resistance levels crossing *It works on any timeframe *it works on any symbols *it generates alerts *it draws uptrend / Downtrend clouds and BUY/SELL arrows inputs : *drawn start point ( in bars): not affecting strategy - it just gives you indicator history depth *alerting enable/disable

This EA utility does not trade on its own, but it only modifies the open trades to add take profit and stop loss that was opened manually or by any other expert advisors.
The distance is based on Pips .
How Does It Work? If Symbol to modify is set to "All Symbol" simply attach it to one chart, and all open trades in the entire terminal will set the take profit and stop loss . If Symbol to modify is set to "Local Symbol" , it will only set the ta

This expert advisor is very simple and easy to understand, it is based on the martingale strategy.
Recommended Pairs For Default Strategy: - GBPUSD - H1 Expert Advisor Inputs: - Strategy --> You have 4 options: Low Risk, Mid Risk, High Risk, Custom Strategy ( Custom Strategy is based on CrossOver Moving Average ); - Lot_Win --> Default value: (0.01) - Lot_Start --> Default value: (0.01) - Lot_Multiple --> Default value: (1), switch the value to (2 or above) if you want to use martingle stra
FREE

RiseEA - это полностью автоматизированный советник. Очень прост в использовании.
Главная особенность состоит в том, что советник работает в ДВУХ ОКНАХ , т.е. в одном окне only short, в другом - only long. Обязательно Magic Number должны быть разные.
ТF - ТОЛЬКО М1 . Не открывайте и не закрывайте позиции в ручную. Для качественной и непрерывной работы вам потребуется VPS с ping не более 10 ms.
Настройки по умолчанию - это идеально подобранные параметры для валютной пары EUR-USD с депозитом

The Pistol EA is a fully automated trading robot for the trading on Forex. The Pistol EA Lite trades using Stochastic Oscillator and Moving Average as an indicator to determine trading strategy.
Suggestion: Symbol EURUSD,GBPUSD,USDCAD
Timeframe H1 Deposit 2000 usd
Settings Available: Slippage : Acceptable slippage when open a trade Open_New_Cycle: Allow to open a New Cycle trade Enable buy: Allow to open a Buy order Enable Sell: Allow to open a Sell order
Stochastic TimeFrame: TimeFrame us

Live Signal:https://www.mql5.com/zh/signals/834034 the ea use special way to identity the position the ea is a professional trading robot that has been in development for many years. It uses very advanced exit-algorithms and has a build in spread-filter and slippage-control algorithms. It is fully customisable to suit the client's needs and offers many setup possibilities. Of course there are also recommended settings which will be available in the comments-pages. Indicator download link:https:

The shield allows the trader to easily close all profit / loss positions instantly while being able to protect winning positions. Every trader needs it in their day trading with one click.
Features : one click close all positions in profit. one click close all positions in loss one click protect all positions in profit.
are you suggest more features ? please contact me!.
NOTE: demo will not work in backtest because it not support button action.
Binary options are the markets where the selected assets are traded according to the estimates in which direction they will move in a certain period. What is called active; are investment tools such as stocks, foreign exchange and gold.
For example; You think one of these instruments will move up in 10 minutes. You have purchased one of the suitable options. When your expectation comes true at this expiry, you will earn almost double your money.
The logic of the market; to make predictions ac

Simple Order and Risk Management Tool. Secure your profits and protect your capital!
Features Visual Stoploss, TakeProfit Levels (Hotkey: SHIFT+M) Visual Pending Order Level (Hotkey: SHIFT+P) 5 Custom LotSizes for Open Orders (Each lotsize has a corresponding hotkey) This requires that an SL level is previously set Automatic Partial Close Expert will automatically close partial positions in when it reaches a target profit level. Automatic Stoploss to Breakeven Expert will automatically set y

这是一款 MT4 的趋势指标,可提供准确的入场交易信号,且无重绘或延迟。 它可应用在任何金融资产:外汇、加密货币、贵金属、股票、指数。 最好的结果出现在 M15+ 的时间帧内。 指标的 MT5 版本 重要! 购买后请联系我,以便获取详细指南和奖励。 视频 (6:22) - 一个信号赢取的利润等于指标价格的三倍。 视频 (4:44) - 它如何在测试器中工作,我的提示和技巧。 视频 (1:44) - 有关它如何处理加密货币和指数的几句话。 大多数交易者在 Entry Points Pro 指标的帮助下,在第一个交易周内就改善了他们的交易结果。
Entry Points Pro 指标的益处 入场信号无重绘或延迟
如果信号出现,并得到确认(如果信号所在烛条已收盘),则它不会再消失;不像是重绘指标,它会导致重大的财产损失,因为它们可以在显示信号后再将其删除。
无差错开仓
指标算法可令您找到入场交易(买入或卖出资产)的理想时机,从而提高每位交易者的成功率。
Entry Points Pro 可操作任何资产
它允许您在 MT4 平台上交易任何经纪商提供的加密货币、股票、金属、指数、商品

Description Candle Power Color indicator which shows when the market is trending and when it is in a sideway movement KEY LINKS: How to Install – Frequent Questions - All Product How is this indicator useful? It allow to detect trend and sideway movements in market NEVER repaints. It adapts to any market and asset. It can support any other trading strategy. Note 1: This indicator should only be considered as a part of any trading strategy. You should complement this with other filters (e.

Zero Hunter EA在亚洲交易时段的第一个小时进行交易,获胜率非常高。确保按照说明设置参数:
在页面上按照以下信息设置EA参数的H_offset: https://www.goodib.com/zero-hunter/ 当图表左侧信息板上显示 H = 0 时,EA将进行交易。
H_offset :大多数交易商的交易时间是从星期一的00:00到星期五的23:59。如果您的交易商是这样的,请将H_offset设置为0。如果星期一的开始时间不是00:00,例如是星期日的22:00开盘的,请将此参数设置为22。 Start_Lots :Risk_Control关闭时每笔交易的固定手数。Risk_Control开启时将忽略此设置。 Risk_Control :资金管理开关。True为开启,False为关闭 Risk_Percentage :每笔交易的最大亏损百分比。 Symbol_NameEX :如果品种名称带有后缀,请在此处填写后缀。例如,如果名称为EURUSDb,请在此处填写“ b” Max_Spread :允许开仓的最大点差,当点差超过该参数时不会开仓。保持默认设置时系统按内

EXTRA SUP TRADING
When all the market movement makes you have lost, This ea makes a good profit with a little profit with many orders in a short time Just on a Candle. When ex: H1 time frame a candle moves fast as I need it or have a good change in price about over the 200 points this is a good choice to enter the
market with a thiny order.
Recommendations: H1 Timeframe / EURUSD and GBPUSD have best result

When all the market movement makes you have lost, This ea makes a good profit with a little profit with many orders in a short time Just on a Candle. When ex: H1 time frame a candle moves fast as I need it or have a good change in price about over the 200 points this is a good choice to enter the
market with a thiny order.
Recommendations:
H1 Timeframe / EURUSD and GBPUSD have best result

THE FX RUNNER THE MOST PROFITABLE EXPERT IN THE MARKET IT WORKS GREAT WITH EUR/USD GBP/USD AND YOU CAN TEST IT ALSO ON ANY OTHER PAIRS TIME FRAME 15 MINUTES OR YOU CAN TEST IT ALSO ON ANY TIME FRAMES
When all the market movement makes you have lost, This ea makes a good profit with a little profit with many orders in a short time Just on a Candle. HAPPY TRADING FOR ANY QUESTIONS YOU CAN CONTACT ME AT ANYTIME HAPPY PIPS :)

The Five Minutes GBPUSD
When all the market movement makes you have lost, This ea makes a good profit with a little profit with many orders in a short time Just on a Candle. When ex: 5 MINUTES time frame a candle moves fast as I need it or have a good change in price about over the 200 points this is a good choice to enter the
market with a thiny order.
Recommendations:
5 MINUTES Timeframe GBPUSD have best result

此應用程序允許您將您在帳戶中選擇的任何交易活動廣播到電報頻道。 您選擇: 在哪裡廣播(您可以通過在帳戶上同時運行多個機器人副本來同時向多個頻道廣播) 機器人或人類或兩者兼而有之的訂單和位置 從哪些字符(全部或以空格輸入 EURUSD.i EURGBP.i ...) 關於發送什麼動作的信息(您可以通過在帳戶上安裝多個機器人來為不同的頻道或角色設置不同的廣播條件) 郵件將包含哪些信息 顯示額外的控制面板 在每個交易日結束時提交利潤報告。 設置說明: 姓名: 價值: 說明: Main settings:
主要設置: Bot token: 你的機器人令牌 在創建 Telegram 機器人時生成。 Chanel ID: 頻道 ID 可以通過鏈接找到 https://api.telegram.org/bot BOT_TOKEN /getUpdates
Magic list -1 0 444 magic orders/positions 的空格分隔值。 “-1” - 所有位置,“0” - 手動打開,
或計劃從中廣播信號的專家的空格分隔的幻數。 Symbol list EURUSD.i GBP

Signals are sent only to Buy The indicator is designed for binary options The signal is given when a new candle appears; signals for 1-2 minutes is recommended Use the expiration time and no more than one candle of the used timeframe and possibly more depending on the market and session It is recommended to trade during the American session During the testing period of the product, no redrawing was found if any, please contact us, a test version for 2 days is possible, because due to the specifi
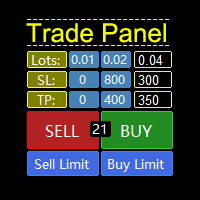
一款支持策略测试的“交易面板”,兼容性极好,操作迅速,符合专业交易员习惯。同时,设计 紧凑 , 简洁, 一目了然, 功能全面, 乃手动操盘之利器! 功能说明: Click Spread //清除箭头 Click SL: //删除止损 Click TP: //删除止盈 Reverse //反手 Locked //锁仓 Cls.Curr. //平最近单 Clearance //清仓所有(币种)仓位 兼容老版本MT4,支持手动在“策略测试”中模拟交易! 支持中英文切换。 默认参数说明: Language=En //语言切换 PanelCorner=Right; //面板位置 Time remaining =true; //K线剩余时间显示 Color =clrYellow; //时间颜色 Fast
FREE

复仇者智能交易系统(Avenger Expert Advisor) 复仇者智能交易系统(EA)是一款先进的交易工具,旨在帮助交易者精准高效地自动化交易策略。该系统利用高级趋势指标和可自定义的设置来优化交易表现。 主要功能 趋势指标设置 主要趋势指标 :利用主要趋势指标开仓。 第一和第二趋势过滤器 :附加的过滤器,用于优化趋势信号并提高准确性。 自动手数设置 启用自动手数 :可根据账户权益自动计算手数。 初始手数系数 :将初始手数设置为权益的百分比。 最大手数系数 :将最大手数限制为权益的百分比。 全局信号设置 Magic Number :EA开仓订单的唯一标识符。 管理所有订单 :可管理手动添加的订单。 订单滑点 :允许的最大滑点值,用于订单执行。 最大点差 :若点差超过设定值,禁止开仓。 止盈设置 :支持自定义的止盈水平。 禁止对冲 :禁止同时开设买单和卖单的功能。 周五交易限制 :可设置周五停止开仓。 订单时间控制 :设定订单和网格订单之间的最小时间间隔。 跳过每个Tick运行 :避免EA在每个Tick上运行的选项。 挂单管理 :若存在挂单,则禁止新开仓。 降低回撤(DDR) 启用

LEFORT is a multi-currency, fully automatic, high-frequency trading robot. The robot works with any instruments in MT4 on any timeframe. The algorithm of the expert Advisor is as follows Single-scalping trades will. Using the analytical signals module, the robot analyzes the market dynamics, and then makes single trades in the direction of the dominant trend with a profit of several pips. A series of open orders. The robot makes a series of trades on a pullback in the direction of the dominant t

基于Zig-Zag的水平指标是外汇交易的高精度工具,可帮助您改进策略并做出更精确的决策。它使用Zig-Zag算法,在市场上确定各种支撑和阻力水平,基于这些水平,您可以确定何时最佳进行交易。
该指标在计算水平时具有高性能和准确度,允许交易者在最小风险下获得最大利润。由于其直观的界面,您可以轻松地定制和使用该指标进行外汇交易策略。
此外,基于Zig-Zag的水平指标具有高度适应性,可以适应不断变化的市场条件,在任何情况下都提供稳定可靠的表现。该产品成为了任何想在外汇交易中实现最大利润的交易者的不可或缺的助手。
设置:
偏差: 图表上相邻两根蜡烛的高低点之间的百分比差值的最小值,使指标能够形成峰值或本地低点。 深度: 最小蜡烛数量,如果第一个参数的条件适合构建模式,则ZigZag将不会构建第二个最大值/最小值。 回溯: 本地高点或低点之间的最小蜡烛数量。 宽度水平: 水平线厚度。 高/低颜色水平: 从蜡烛极端点的高/低处建立水平线的颜色。将其设置为“无”以关闭显示。 收盘价格颜色水平: 从蜡烛极端点的收盘价建立水平线的颜色。将其设置为“无”以关闭显示。 通知高/低水平触碰: 当价格
FREE

A multi-currency Expert Advisor with its own indicator. The main principle of operation is averaging using martingale, the EA has a built-in function for opening deals with a spread limit. For safe trading, the account must have at least $ 100 on a cent account, or $ 10,000 on a classic one . Recommended broker for a classic account www.icmarkets.com or alpari.forex/ru for a cent account. Recommended pairs : EURUSD , AUDUSD , EURGBP, EURCHF, USDCHF, USDCAD on a 1-minute chart( M1 ), spread up to

Hope It is a trading system that uses a double algorithm to operate. Hope detects an entry point, if the price goes in your favor initiates an aggressive trend following algorithm. If the price goes against the trend, use a hedging algorithm without increasing lotage, this algorithm manages to recover the loss without the need to increase the margin beyond what is reasonable.
You can download the demo and test it yourself.
Very stable growth curve as result of smart averaging techniques.
"

This PORTFOLIO of 5 strategies has been developed, tested and traded live on EURUSD M30 TF. Multiple EAs traded together will lead to a bigger profits and smoother equity curve. 5 not correlated EAs logics for EURUSD M30 merged to a single strategy. Very SIMPLE STRATEGIES with only FEW PARAMETERS. Every trade has his own logic for STOP LOSS. To catch the profits every strategy uses different approach - some has TAKE PROFIT, some uses TIME BASED EXITS or PROFIT TRAILING. EA has been backtested
Fobos 10 Bars Signal - it is a Secure Automated Software for trade Forex market and indices.
Fobos 10 Bars Signal is a mixture of the Mars 10 Bars Signal indicator using the GO IT algorithm
Can used this EA whit 500$ in your account
The architecture is a Fully Automatic Autonomous Robot Expert capable of independently analyzing the market and making trading decisions
Fobos 10 Bars Signal It is an advanced trading system. This is a fully automatic Expert Advisor. It is a 100% au

CAP Ichimoku EA MT4 Pro trades using the Ichimoku Kinko Hyo Indicator. It offers many customizable Ichimoku trading scenarios and flexible position management settings, plus many useful features like customizable trading sessions, a martingale and inverse martingale mode. [ Installation Guide | Update Guide | Submit Your Problem | All Products ]
Before buy Pro version? You can buy alternation pro version, our powerfull EA, CAP Strategy Builder EA . This is strategy builder EA. It pr

The StatZigZag indicator looks like a regular ZigZag , but is built on the basis of completely different algorithms. The StatZigZag indicator is a broken line built from segments of regression lines of different lengths, the beginning of each of which comes from the end of the previous segment. Each regression segment is built until the variance or spread of price around it begins to exceed a certain critical value, after which the construction of this segment ends and the constr

AutoSTPending - Expert Advisor for Automatic Stop Loss and Take Profit
The AutoSTPending expert advisor automatically creates or modifies the Stop Loss and Take Profit levels configured in the properties. It is a user-friendly and easy-to-understand tool. With AutoSTPending, you can simplify and streamline your trading operations by allowing the expert advisor to automatically set and adjust your Stop Loss and Take Profit levels. This allows you to focus on other activities while maintaining ef
FREE

Multicurrency version, trading is recommended for currency pairs:
AUDCAD GBPCAD EURGBP EURUSD AUDNZD The EA has been working on real accounts since 2017. Trading is based on corrective trend movements, positions are opened based on the strength of the trend and trading volumes according to the author's formula. Series of positions have a common take profit, which is based on the statistics of corrective movements of this trading instrument. For each currency pair, its own trading strat

Teamwork System EA is based on the logic of order strategies and profit-taking strategies working as a team. In general, EA consists of two parts as strategies and take profits section. Strategies section are special strategies that we create for symbols. Strategies continue to open buy and sell orders independently. Takeprofits closes orders that are opened by working as a team. Take Profits logic is that profitable orders go by closing lost orders. They never work selfishly. In this way,
Vertical Lines for Hour - Time-Based Trading Indicator The Vertical Lines for Hour indicator allows you to mark up to 4 vertical lines at specific times on your chart. Simply enter the hour without considering the minutes, and you can also choose the color for each line. This indicator is useful for identifying session ranges or implementing custom trading strategies. It provides a straightforward solution for your trading needs. Key Features: Mark up to 4 vertical lines at specified times. Sele
FREE

Tester BO and Tester Signal Bar is a script that allows you to test your trading strategies. The tester has two buffers with up / down signals. An example of use can be seen in the screenshots below. Using the indicator tester, you can achieve the maximum ratio of profitable trades for binary options. Improvement for forex is also planned. I wrote the idea at the very bottom in the “Planned work” group. You can filter your signals by the following data: 1- start date analyze. Interval (1 day, 7
FREE

An indicator in the form of a panel for collecting statistics on spreads from a specified list of pairs. It is enough to open one chart and set an indicator to collect statistics for all specified pairs.
After completion of work, the panel writes values to a file, which allows not to interrupt statistics after completion of work.
Input parameters:
-Interval to update the spread for pairs (sec) Allows you to specify how often to collect statistics (allows you to reduce the load) -List of pair
FREE

Candle Breakout EA is a trading tool for traders using the high and low breakout strategy of a previous candle. The EA waits till the price is higher than the previous candle's maximum or below the previous candle's minimum, and later opens a certain order (you can choose which type of order to open when the extremes are broken). This type of trading is well suited for classic strategies such as day trading on daily charts, breaking the morning candle on Monday, impulse trading, etc. The Expert

Kruger is a night scalper trading system for trade on EURUSD and GBPUSD. It is based on Moving Average and Candlestick Pattern to open trade. Every trade using stop loss and take profit. Kruger does not use any dangerous money management such as martingale, or grid so it can be used with minimum deposit as low as $100. The backtest result from 2015-January,2021 is showing a stable performance. Please see the screenshot below or please do backtest the EA. (Note : Past performance does not gua
The utility for manual trading to manage open positions.The built-in trailing stop has three modes and seven instruments: by pips, by bar extremes, by fractals, by volumes, by MA, by Parabolic SAR and by ATR. With the help of the built-in trading simulator, you can check how the EA works in the strategy tester. Guide to UTrailingMini can be found in the "Comments" section. Benefits 3 trailing stop modes: normal, total and mobile stop loss; 7 options: by points, by bar extremes, by fractals, by v
The LordAdvancedPivot Indicator is an indicator for META TRADER 4, with the function of analyzing the main daily channels of the currency pair, known as RESISTANCE, SUPPORT and PIVOT (center), to determine the levels at which market sentiment can change from "bullish" "to" low ".
Pivot points can be points that correspond to trend lines, Fibonacci levels, moving averages, previous highs / lows or closings and many more indicators, depending on the trader's philosophy.
LordAdvancedPivot has 7
LordCandleSignal is an indicator for META TRADER 4, using by default ENVELOPES, STOCHASTIC, RSI techniques with Lord strategies in its source code.
LordCandleSignal issues a new buy / sell signal through its strategy before the action, that is, the signal comes before it happens.
Difficult to make mistakes, each signal sent, it is possible to close profitably even before the next signal, or using the Lord strategy, closing profitably every 20-50 pips in a comprehensive and safe way.
LordCand

The indicator shows entry points with Risk-Reward-Ratio 1 to 5. Main timeframe H1. Works on every pair. The main logic - is to find a reversal level, and then track the price reaction to this level. Doesn't need any settings. As a standard, it paint 5 levels of the same take-profit (red / blue for sellers and buys) and 1 stop-loss level - orange. ATTENTION! The full version of indicator. You can t est full work of indicator free only on the USDCAD pair here https://www.mql5.com/en/market/produ

Scanner and Dashboard for Cycle Sniper ATR Fibo Channels Indicator
As users know indicator draws Fibonacci Channels and arrows according to the user's settings.
With CS ATR Fibo Channels Scanner, you will have the ability to watch the market.
- Multi Timeframe - Multi Instrument
Enter your parameters to watch (as explained in Cycle Sniper ATR Fibo Channels Indicator )
- If you cho0se "Arrows by ATR Levels" , you will receive the potential reversal arrrows. - If you choose "Arrows by Median
Gold Standart - a trading expert for the XAUUSD (Gold) trading instrument. The Expert Advisor is tested on real ticks on any part of history. No hazardous trading methods are used.
Each trade has a stop loss and a take profit. Support: https://www.mql5.com/en/channels/TrendHunter
Recommended trading instrument (TF 1M): XAUUSD (Gold).
We recommend using a remote server (VPS).
Settings: This LOT: - This lot For each of this amount (if> 0) - For each of this amount of balance; MaxLot - You can
APIPS Expert Advisor puts a Take Profit on all positions at the total breakeven distance or at the distance of the specified take Profit value .
If several orders are opened, the Expert Advisor puts a Take Profit on all positions at the total breakeven distance + the specified Take Profit value. You can specify to close all positions only on the excess without profit. If there are no open orders and you open a trade on the market, the APIPS Expert Advisor automatically sets the Take Profit by t
This expert is a pure volatility scalper working with two pending orders (buy stop and sell stop). Expert not use any indicator, only use prices action and volatility of price to generate signals. There are three conditions for it to work: Tight spread Fast execution Stop level = 0 Please during the tests of this EA do not simultaneously use another EA in the same terminal because it affects the modification speed. Try expert on demo account first before use it on real one.
FREE

Math Profit Diamond is a Safe Scalper System for Trading on Forex. This is an automatic Expert Advisor designed for scalping during the period of low market volatility. The EA uses an advanced algorithm to find the entry points, as well as several additional filters for entering and exiting the market. The Ea does not require optimization or any additional configuration. TF M30 on GU! If you have ay question, please contact me!

Note: MT4 Backtest cannot test EAs that trades with several symbols simultaneously. For backtest use MT5 versions download here . Note : Limited version can trade with the volume less than 0.05 lots.
Important :
This is Arbitrage EA and may not work on all accounts. It is recommended to follow the testing process described on product screenshots. If you are not familiar with arbitrage trading, It is recommended to use our other trading robots .
Strategy :
EA will place trades based on Tria

Fully Automated And ready just follow the instructions below to see it work right. Enjoy! MINIMUM ACCOUNT SIZE - $500 RECCOMENDED ACCOUNT SIZE - $1000 For EurUSD Trade On 15M Candle For IG broker Another broker it works on is OANDA but I run mine on IG
Comes ready as is all you need to do is make sure the above is correct and then run it on EUR USD (15M)
Goes off of equity in the account
I have worked on this EA on and off and now I think it has enough data and backtesting to give to you al
FREE

https://www.youtube.com/watch?v=4WVZqh9oKeY
The function of this ea is to open both buy and sell simultaneously, If next order with matingale lot size And there's a clear order when it's dragged to reduce collection time. It can be left open forever through server rentals, no fear of news, no temptation to set a minimum investment of 10% of the capital to be safe. Run at time frame 5m. Suitable for a pair of gbpusd,eurousd A proper investment should be put to the test for the safety of the cap

Lines Resource is an technical indicator that dysplay lines in the chart giving some notion of supports and resistance levels for the correct functionallity of Optimal Investor EA an multicurrency EA that gives an 52% return monthly. Please install it, to run Optimal Investor EA correctly. Next to it, install Profitnator Resources Indicator FREE , to Run Optimal Investor EA.the second and last one resource.
FREE

PROMOTIONAL OFFER. NEXT PRICE WOULD BE 125 USD.
HAWA is pleased to introduce Price Action Setup indicator for all symbols with high success rate. It's advanced algorithm finds the spots for you where smart money is moving in or out of the market. Indicator will produce signals with pre-calculated entry and exit levels keeping money management in place. The system aims to achieve small, steady and consistent profits and reduce losses.
Unique Features: High Probability Success rate. Steady pro

Namiri Trade Engine is an ALL in ONE trading system that combines price structure, volume pressure, market condition & risk management to give you the BEST opportunities for A+ trade setups with auto lot size
WAIT FOR YOUR A+ SETUP || ONLY TAKE YOUR A+ TRADE || RINSE REPEAT YOUR A+ MOVE
Chart Features
Panel - Shows the asset, market, price, pip, account, trade & profit|loss information Structure - Shows areas of support & resistance Risk Management - Shows risk analysis period of 100 bars, buy

Note : i only sell this EA on MQL5, any other sellers is fake. Orbit Rage Final is base on the bull/bear candle strategy and divergence. To be specific it can make you what you want in your life. Just download and extract to experts advisors folders of your MT4. Orbit Rage Final is a risk-free trading strategy that allows retail forex traders to make a profit with no open currency exposure. The strategy involves acting on opportunities presented by pricing inefficiencies in the short window the

Some users are very comfortable keeping their trades for ages, while other users are happy to get the least and leave :)
Please please do not take unnecessary risks. (Trading is risky, and there are no guarantees for winning)
We wish you successful trading. (Trading is risky, and there are no guarantees for winning)
Check our other products which will be added to the market soon.

Some users are very comfort 2 able keeping their trades for ages, while other users are happy to get the least and leave :)
If you cannot wait on your trades, then this expert will be the best for you!
The expert tries to enter trades on a high probability of success, and in most cases it do catch the right wave. If not , don't worry because the expert will deal with the situation by itself and will take the trades to profits! (Trading is risky, and there are no guarantees for winning)
You
学习如何在MetaTrader AppStore上购买EA交易,MetaTrader平台的应用程序商店。
MQL5.community支付系统支持通过PayPay、银行卡和热门付款系统进行交易。为更好的客户体验我们强烈建议您在购买前测试EA交易。
您错过了交易机会:
- 免费交易应用程序
- 8,000+信号可供复制
- 探索金融市场的经济新闻
注册
登录