适用于MetaTrader 4的新EA交易和指标 - 287
This Indicator will simplify your trading life. The Indicator has no input parameters. Red arrows indicate the beginning of the Down trend and it will be a good time to open a Short position. Green arrows indicate the beginning of the Up trend and it will be a good time to open a Long position.

The Expert Advisor is based on the momentum of the price rate of change. When the speed of the price begins to increase sharply, the EA opens an order in the direction of its movement. Rate of Change is defined as the distance of StepPrice ticks that the price has moved for the period of TimePrice seconds. In contrast to the standard algorithm, virtual levels are modified not only after the TimePrice time, but also after the change of direction of the price movement—momentum. The built-in filter

iCC in iMA is indicator to change color in iMA if iCCI crosses level up (up trend) or crosses level down (down trend). It is a useful tool to track when the upside and the downside iCCI on iMA.
You can to get source code from here .
Parameters MA_Periods —Period for iMA. MA_Method — Method for iMA. CCI_Periods —Period for iCCI. CCI_ApliedPrice — Price used for iCCI. CCI_LevelsUp — Level iCCI for up trend. CCI_LevelsDN — Level iCCI for down trend. BarsCount — How many bars will show the line.
FREE

This indicator was inspired by М & W Wave Patterns by A. Merrill. 5 extremums or 4 edges of ZigZag are enough to build M or W pattern at arbitrary offset in the history. The classical approach includes a table of predefined figures of ZigZag waves, which can transform into each other under special rules—so that next edge can be forecasted based on these rules. Unlike to this approach, the indicator analyses available history and builds statistics for all M and W patterns, which differ in their c

iRSI in iMA is indicator to change color in iMA if iRSI crosses level up (up trend) or crosses level down (down trend). It is a useful tool to track when the upside and the downside iRSI on iMA.
You can to get source code from here.
Parameters MA_Periods — Period for iMA. MA_Method — Method for iMA. RSI_Periods — Period for iRSI. RSI_ApliedPrice — Price used for iRSI. RSI_LevelsUp — Level iRSI for up trend. RSI_LevelsDN — Level iRSI for down trend. BarsCount — How many bars will show the li
FREE

This indicator uses Moving Average to detect markets trend. It's a very useful tool for manual trading. If line is Midnight Blue, indicator detect up trend. If line is Dark Violet, indicator detect down trend. The readings are very simple to use and understand. Indicator works best on H1 timeframe. You can use this indicator with FollowLine to have more accurate signals.
You can to get source code from here .
Parameters BarsCount —How many bars used to show the line. MAperiods —Period of Mov
FREE

此产品无需任何设置。简单地在图表上拖动它,它就会开始工作。针对流行品种的优化设置每月更新: EURUSD, AUDUSD, GBPUSD, USDCAD, USDJPY, EURJPY, NZDUSD 和 M15 时间帧。 原型 4 自动是原型 4 EA 的优化版。原型 4 的详细描述和设置可在此发现 https://www.mql5.com/zh/market/product/6088 。 本 EA 的监控在 我的信号 https://www.mql5.com/zh/users/r0s/seller 里提供。
每月优化 本 EA 针对所有列出的品种每月优化。新版本会在必要修改后上载。优化执行如下: 优化周期为 5 年,自当前日期起前推 (例如: 假设今日是 10.10.2014。所以, 优化周期是 10.10.2009-10.10.2014)。 风险级别参数设为高。 在策略测试员的参数里设置最大点差。 执行所有参数的优化。 获取结果之后, 优化周期增加到 6 年 (在我们的例子中, 它是 10.10.2008-10.10.2014)。 最佳的结果被选中。 降低风险级别和点差至正常

Description The Panel is designed to select top signals from the terminal database and the MQL5.community website. To allow web requests for the program, you need to enable the "Allow WebRequest for the following URL" option in the terminal settings and explicitly manually specify URL https://www.mql5.com/ .
Parameters The terminal tab — selecting signals form the terminal data base. sorting — choose a sorting field to select the best signals from the data base: NONE RATING DATESTART DRAWDOWN

This indicator uses Bollinger Bands lines to detect markets trend. It's a very useful tool for manual trading. Furthermore it is possible to use the indicator with ATR as a filter , as well as the option to pop up an alert when a reverse trend occurs. The readings are very simple to use and understand. Indicator works best on H1 timeframe.
You can to get source code from here .
Parameters BarsCount - How many bars used to show the line. BBperiod - Period of Bollinger Bands. BBdeviations - De
FREE

A simple, intuitive scalping assistant - Z Panel .
Features Quick order placing, closing of all orders or BUY and SELL orders separately, setting breakeven by pressing a button. Automatic calculation of the three levels of the lot size, depending on the available funds on the account. Displays the breakeven level. Can be located in any place on the chart. It is recommended to use on ECN accounts.
Parameters Risk of Button1 — risk amount as a percentage to set the lot size on the buttons of t
FREE

This indicator is designed for M1 timeframe and shows: sum of ticks when the price goes up divided by sum of ticks when the price goes down (red color); sum of points when the price goes up divided by sum of points when the price goes down (green color). The correlation between the number of ticks and the number of points for each and every minute will give enough data for scalping.

This is a simple but functional Moving Average Cross Alert, just set the parameters for both moving averages and when they cross or are equal you will get an alert. If you configure your terminal to send emails or notifications, the indicator will send you an alert by mail or notification. You can set the number of iterations for your alerts on the platform and the interval between the alerts. You can use Simple, Exponential, Smoothed or Linear Weighted moving averages. You can apply any type of

突破趋势 是为剥头皮者和日内交易者准备的指标。指标在图表上以实时模式选择并显示趋势级别。指标反应价格动量: 它在动量幅度超过指定参数里设置的阀值之时,开始搜索趋势。此指标当价格越过当前的趋势线时,还可以播放声音。在正常模式, 此指标只显示一条 (最后发现的) 上行和一条下行趋势线, 但在高级模式 - 以前检测到的趋势线依旧在图表上绘制。 注意 突破趋势 指标不会产生完整的决定。它只做脏活,显示出可能的选项。交易者应该做出决定。
指标参数: ExtMode - 启用/禁止高级模式; Sound - 启用/禁止 当价格与趋势线交叉时声音通知; UTColor - 设置上行趋势线颜色; DTColor - 设置下行趋势线颜色; HistoryDepth - 设置使用历史的深度, 0 - 整个历史; Rank - 设置搜索等级; PulseThr - 设置动量振幅阀值点数。
FREE

PositionSizer is an indicator that calculates the number of lots you have to trade if want to risk a set percentage of your account per entry. To start using it, just add it to a chart. When you want to get a position size you have to establish, just press Shift B on your keyboard to calculate a buy or Shift S to calculate a sell. Three price arrows will appear on your chart. The blue one represents the point where you want to entry the trade, the red one represents the price to place the Stop L

The main purpose of this indicator is to show 2 lines of possible Trailing Stop Loss values: Yellow/Aqua line for Trailing Stop Loss closer to the current price Orange/Blue line for more risky (but more profitable) Trailing Stop Loss. If the line (looks like a staircase) changed the colors from Yellow to Aqua (line #1) and/or from Orange to Blue (line #2) accordingly this mean that we have a situation when a trend changed its course to the opposite. So, this Indicator can be useful to open pos

Description DealsCopyMaster opens additional positions on a single symbol in the appropriate amount and tracks them automatically. Opening additional positions may be necessary in case a subscriber starts to lag behind the provider dramatically in the volumes of the currently opened positions and in the volumes difference when provider's balance was at some moment of time equal to the current subscriber's one. In multicurrency/multisymbol mode, the EA is attached to the chart of each financial i

This Indicator is based on the classical indicator "Relative Strength Index". IT draws 2 lines: Main blue line with input parameter RSIPeriod . Signal red line. Buy when the main line (Blue) falls below a specific level = 30 and then rises above that level and main line rises above the signal line (Red). Sell when the main line (Blue) rises above a specific level = 70 and then falls below that level and main line falls below the signal line (Red).

MetaTrader 4 的交易复制器。 它从任何账户复制外汇交易、头寸、订单。 它是最好的贸易复印机之一 MT4 - MT4,MT5 - MT4 为了 复制 MT4 版本(或 MT4 - MT5 MT5 - MT5 为了 复制MT5 版本)。 MT5版本
详细描述 +DEMO +PDF 如何购买
如何安装
如何获取日志文件 如何测试和优化 Expforex 的所有产品 复印机 版本 MetaTrader 5 终端 ( МТ5 - МТ5, МТ4 - МТ5 )- Copylot 客户端 MT5 独特的复制算法将所有交易从主账户准确复制到您的客户账户。
该产品还以其高运行速度而著称,并且具有强大的错误处理能力。
一组强大的功能。
该程序可以在多个终端绑定上运行。
使用它作为您在一个账户上交易的多个账户的交易 的同步器 , - COPYLOT 会将您的交易复制到其他终端。
从已关闭的账户中复制 Invest 密码;
部分关闭仅从 mt4 到 mt4

МetaТrader的交易复印机4.它复制任何账户的外汇交易,头寸,订单。
这是МТ5↔️МТ4今天贸易复印机的最佳 МТ4 - МТ4, МТ5 - МТ5, МТ4 - МТ5, МТ5 - МТ4 。 独特的复制算法将所有交易从主账户复制到您的客户账户。运行速度快。严格的错误处理。一组强大的功能。 所有这些品质都合并在一个程序中 - EXP - COPYLOT。 该程序可以在多个终端绑定上运行。 在一个账户上交易的各种投资者账户中将其用作交易的同步器, - COPYLOT会将您的交易复制到其他终端。 安装 CopyLot Master - 要在帐户上安装的专家,您要从中复制职位和订单。 在终端中安装此专家,您可以从中将位置复制到投资帐户。 将任何文本标签名称指定为pathWrite(pathRead),例如“COPY”。 EA需要设置为1图表!默认情况下,我们的顾问会复制您帐户中的所有头寸和订单!
要复制您需要在第二个帐户或 Copylot客户端MT5 上安装 COPYLOT客户端MT4 的位置
注意:设置列表在我们的 博客中 ! 特
FREE

VR ATR Pro 指标是一个强大的专业工具,用于确定金融工具的目标水平。该指标的有效性已被真实和模拟账户的数千次测试所证明。 VR ATR Pro 指标在真实数据上运行,使用实时真实的统计数据。统计数据是很顽固的东西,在数学计算中使用真正的统计数据可以让你计算出金融工具的准确目标水平。 对于安装文件,说明,愉快的奖金 联系我 好处 该指标有许多优点,以下是其中的几个。 指标的高精确度。 超自然现象可以排除在计算之外。 直接在图表上简单显示目标水平。 适用于任何金融工具(外汇、金属、差价合约、期货、加密货币)。 它不会被重新绘制,它不断地保存它的读数。 对确定 Stop Loss 和 Take Profit 水平有效。 智能手机通知,电子邮件和MetaTrader提醒。 MetaTrader 4和MetaTrader 5的版本是完全相同的。 易于设置和安装。 适用于初学者和有经验的交易者。 适用于所有时段和时间范围。 建议 计算指标的时期必须小于指标的时间框架。 在新金融工具的设置中使用读数的准确性计算。 使用该指标来计算每日或长于一天的时期的水平。 将该指标与你的交易系统结合起来使

新闻操盘手专业版 是一个独特的机器人,让您使用您预先定义的策略进行消息交易。它从几个流行的外汇网站加载的每条消息的片断。您可以选择任何消息和预设的策略进行交易,之后新闻操盘手专业版根据选定的策略,在新闻来临时自动进行交易。 新闻发布给出了赚点数的机会,因为在那个时刻,价格通常有大动作。现在,利用这款工具,新闻交易变得比以往任何时候更容易,更灵活,更令人兴奋。不要等待,不要错失,不要再迷惑了。每周只需针对重要新闻设置一次,这个工具将完全按照您的计划进行精准交易。 演示版: 由于这不是一个自动交易机器人 (它是半自动), 您需要下载单独的演示版本: https://www.mql5.com/zh/market/product/5931 参考: 如果您只需要加载新闻 (无需交易), 您可以购买新闻加载机专业版: https://www.mql5.com/zh/market/product/5463
功能 包括所有 新闻加载机专业版 的功能 (查看详情)。 针对每条新闻构建您自己的策略,具有非常灵活的参数。 支持五种高级策略,带有大量控制参数 (止损, 止盈, 尾随, 网格间隔, 手数缩放

SMARTMASS INDICATOR This indicator is different from all known volume indicators. It has a significant distinction; it is an algorithm that relates price movement to volume, attempting to find proportionality and efficient movement while filtering out noise and other movements that are more random and do not follow a trend or reversal. Ultimately, it reveals the true strength of the movement, indicating whether it has genuine support from bulls or bears or if it's merely a high-volume movement

Introduction to Harmonic Pattern Scenario Planner
The present state of Forex market can go through many different possible price paths to reach its future destination. Future is dynamic. Therefore, planning your trade with possible future scenario is an important step for your success. To meet such a powerful concept, we introduce the Harmonic Pattern Scenario Planner, the first predictive Harmonic Pattern Tool in the world among its kind.
Main Features Predicting future patterns for scenar

Trade Receiver Free is a free tool to copy trades/signals from multiple MT4/MT5 accounts. The provider account must use copier EA to send the signal. This version can be used on MT4 accounts only. For MT5 accounts, you must use Trade Receiver Free for MT5 . Reference: - For MT4 receiver, please download Trade Receiver Free .
- For MT5 receiver, please download Trade Receiver Free MT5 .
- For cTrader receiver, please download Trade Receiver Free cTrader .
- If you only need copy from MT
FREE

Prototype 4 is an automated trading system, which opens positions in trend direction from correction based on data of built-in indicators. Test results show a stable profits for almost 15 years since 2000 (see. the screenshots), as well as in real trading. Monitoring: https://www.mql5.com/en/users/r0s/seller This Expert Advisor can be used in combination with Prototype 1 . Part of the orders of two Expert Advisors is hedged (opened in different directions). The Expert Advisor works on any accou

Description One of the Dow theory tenets states: "Trends are confirmed by volume". This product is a multicurrency/multisymbol indicator that has been designed to define large and/or small tick volumes according to the mentioned tenet. The indicator may be used with any broker, irrespective of the name of the financial instrument since it is necessary to manually enter the name as an input parameter. If you enter a non-existent or incorrect name of a financial instrument, you will receive an err

This is a multi-timeframe (MTF) indicator displaying support and resistance lines. Support and Resistance lines are calculating automatically from three higher timeframes (TF). Traders may use Support and Resistance to enter positions and update a Stop Loss value.
Input Parameters bPeriod - use this parameter to optimize indicators for each timeframe; VisibleBars - for how many Bars (from the current one) the indicator's lines will be visible. Any changes are possible.

Do you use dynamic ranges (like Bollinger Bands or Envelopes) in your trading? A fixed period is usually used for such calculations. But is such approach relevant to the very nature of the market? In fact, the price chart consists of a series of successive processes - trends and flats. In this case, we can talk about the internal development logic inside a single process only. Therefore, the nature of the market is better described by dynamic ranges designed for the processes occurring "here and
FREE
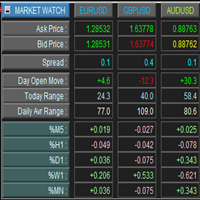
This is a panel for market review and evaluation of multicurrency price movements. It shows main parameters for a user defined group of symbols in the form of a table. The following values are displayed: Symbol name; Ask price value; Bid price value; Spread size in pips; Stop level in pips - may be hidden by a user; Change of price in pips comparing to the day start; Current daily range (High - Low) in pips; Average daily range in pips for user defined number of days; Price change percentage dur
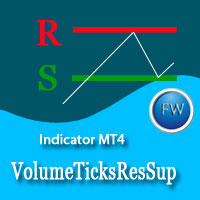
The market price is moved by the market makers with large amounts of equity. The only way to understand intentions of big players is to track their activity by concentration of volumes on one level or another. Volume Ticks ResSup draws a level with the maximum concentration of a tick volume since the beginning of a day. In most cases, such level is an actual support or resistance level. Parameters ColorLevelSupport - support line color; ColorLevelResistance - resistance line color; BarsDayCount
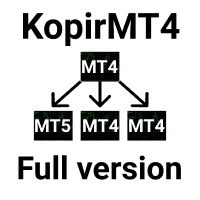

This indicator enhances the zoom capabilities of your MT4. It operates in three modes: 1) Setting Price and Zoom Levels for a timeframe You can set price and zoom levels for each timeframe by selecting the first mode of Zoomer in the properties of the indicator. Then on the chart, set the price levels by dragging the price scale area and the zoom level using the buttons 'Zoom In' or 'Zoom Out'. Then just click on the picture of the open lock. Each time you get back to the timeframe where you hav

MACD Converter is an analogue of the MACD Message with more advanced functionality: It has two signal lines: Signal Line 1 and Line 2, bar outlines are colored according to Line 1, it also triggers the trend notifications. MACD Converter converts the parameters of Fast MA, Slow MA and Signal Line 1 and Line 2 lines from the interval specified in the settings (Convert Time Frame) to smaller timeframes. This allows receiving a signal for making a decision within the specified (Convert Time Frame)

Smart Grid Executor is an Expert Advisor built for MetaTrader 4 platform only. Smart Grid Executor will work on all account types and sizes on MetaTrader 4 brokers (outside of NFA regulations). Recommended leverage >= 1:500.
Features Multicurrency EA Interval - H1 recommended Working with 4 and 5-digit brokers Working with Martingale Automatic multiplier Working with ECN
Input Parameters Name - Smart Grid Executor v 4.00 Start - Short & Long, Only Long, Only Short. Time Frame [Recommended H1

Summary This indicator is based on RSI and Momentum indicators. It also considers moving averages of these two indicators. The three indicators have adjustable settings. The arrows do not repaint since the indicator only uses confirmed values and waits for the candle to close before painting an arrow. The indicator is also able to alert when arrows appear. There are 3 types of alerts - Popup, Email and Mobile Push Notifications. The arrows can be used in the EA and the inputs can also be optimiz
FREE
Do you use dynamic ranges (like Bollinger Bands or Envelopes) in your trading? Usually such calculations use a fixed period, but does it reflect the nature of the market? In fact, the price chart consists of a series of successive processes - trends and flats. In this case, we can talk about the internal development logic inside a single process only. Accordingly, the dynamic ranges built for the process occurring "here and now" suit the nature of the market better. The Growing Bands indicator u
The indicator is designed for easy construction of synthetic charts based on data of various financial instruments. It will be useful both arbitrage and pair trading, as well as for analysis purposes. Its main advantage is simplicity and clarity. Each chart is given as a common mathematical formula. For example, if you want to plot the spread (difference) between EURUSD and GBPUSD with coefficients 4 and 3, then set the following formula: EURUSD * 4 - GBPUSD * 3 The resulting chart is shown in t

TIL Multi RSI indicator applies RSI to 28 currency pairs all at once and displays the most current signal of each one in a two-column list. The currency pairs involved are the combinations of the eight major currencies (USD, EUR, GBP, CHF, JPY, CAD, AUD, and NZD). All the currency pairs are sorted automatically from the one with the highest signal down to the one with the lowest signal in a two-column list starting from the top left to the bottom right. Just a quick recap on what the Relative St

This is our newer and improved tool to assist you in the Elliott Wave counting, which represents an improved version of the ElliottWaveTool7pasos idea. How to Use It Start counting a new wave Start by clicking the "<>" button to indicate you want to deselect any previous wave (if applied). Set the pattern's type that you want to count (if you do not have our free Elliott Wave Font, you will see the letters instead of the pattern's icons in the Type's Section buttons: I=Impulse, D=Diagonal, Z=Zig

Summary This indicator is based on the MA applied to the Momentum indicator. It draws arrows at the confirmed crosses of the MA over the Momentum line. When the MA crosses upwards, then a buy arrow is displayed and vice versa. The arrows do not repaint since the indicator only uses confirmed values and waits for the candle to close before painting an arrow. The indicator is also able to alert when arrows appear. There are 3 types of alerts - Popup, Email and Mobile Push Notifications.
Inputs A
FREE

TIL New Bar Timer executes one simple yet very powerful task - it displays the time left before a new bar forms in any timeframe. With this indicator, you can effectively prepare to enter or exit trades in most occasions, as TIMING IS EVERYTHING. TIL New Bar Timer also changes color gradually as the timer ticks down to zero. This helps the user to estimate quickly how much time there is left in one glance. There are basically three colors that the timer changes to: Red - this means that a new ba

Pivot Point is a technical indicator widely used by traders to predict major price movements by calculating various levels of support and resistance. Investopedia defines the pivot point as follows: A technical analysis indicator used to determine the overall trend of the market over different time frames. The pivot point itself is simply the average of the high, low and closing prices from the previous trading day. On the subsequent day, trading above the pivot point is thought to indicate ongo

TIL Currency Performance Meter is an intuitive technical indicator for quantifying and visualizing the current momentum and relative strength of the eight major currencies, namely: USD, EUR, GBP, CHF, JPY, CAD, AUD, and NZD, on all timeframes. This is achieved by calculating and consolidating the price percent changes of 28 currency pairs from a certain point in time. The indicator generates a chart wherein each currency is represented by a color-coordinated bar that either shoots up or drops do

此指标显示世界主要市场的当前时间。它也显示当前时段。 使用非常容易。它不会占用太多图表空间。 它可以与 EA 或其它面板一起工作, 比如 虚拟交易板 。 此版本在图表上显示模拟时钟。 Dear friends and users of our EAs, please add your ratings in the Reviews section. All updates to our forex software are free ! This is a free trading utility! 其它功能: 输入参数中有一个选项: 显示/隐藏鼠标覆盖按钮提示, 您也可以选择提示的语言英语 / 俄语; 关闭按钮终止此应用程序; 最大化/最小化按钮在图表上缩放格板; 格板可以在图表上移动。要想移动,在面板上部靠近关闭和最小化按钮的地方用鼠标拖拽,移动到期望的位置。 Expforex,Vladon,Indicator,Utility
FREE

Summary: This EA places a single trade at a time in a RANDOM direction (buy or sell) and uses a simple TP & SL. A lot multiplier is also optional. Once a trade hits TP/SL, it will place another trade in a random direction. And so on. Since it only ever has 1 trade open at a time, it can be used on any broker. Which means it can be used on US brokers with the FIFO rule. Inputs are few and everything is based in Points too. So it can be used on any chart reliably and easily. You will be amazed how
FREE

This indicator monitors the vital constants of your trading account to keep it healthy and away from excessive risks. It monitors all trades, absolute exposure, account floating point and leverage currently in use, using different color codes for your interpretation. [ Installation Guide | Update Guide | Troubleshooting | FAQ | All Products ] Amazingly easy to understand The indicator is clean and simple It calculates exposure by pairs and currencies Keep your used leverage controlled at all ti
FREE

Summary This indicator is based on the MA applied to the RSI indicator. It draws arrows at the confirmed crosses of the MA over the RSI line. When the MA crosses upwards, then a buy arrow is displayed and vice versa. The arrows do not repaint since the indicator only uses confirmed values and waits for the candle to close before painting an arrow. The indicator is also able to alert when arrows appear. There are 3 types of alerts - Popup, Email and Mobile Push Notifications.
Inputs All inputs
FREE

This is a script for quick evaluation and selection of the most appropriate signals from the available database. The list can be sorted (ascending or descending) by the following criteria: Position in the Rating of Signals; The number of subscribers; Date of signal monitoring start; ROI (Return on Investment); Trading result in pips; Number of trades; Signal subscription price; Account balance; Account growth in percent; Maximum drawdown. Signals can be filtered by the following criteria: Accoun
FREE

NewsMomentum is an indicator that monitors the market between the specified hours and sends an alert to potentially buy or sell when the momentum of the market increases such that there may be a reaction to the news for the observed currency pair. As always, it is best to confirm these movements with other factors such as support and resistance breaks. This indicator works on any timeframe but it is recommended to be used on a smaller timeframe, such as M5, due to the speed at which the news inf

The exp_iCustomNew Expert Advisor allows to trade using any custom and standard indicators, using their various values: arrows, the intersection of two lines, level crossing, extremum, color. To define the entry signal, the EA can use one main indicator and up to four indicators to confirm by trend and up to four indicators to confirm by volatility. Confirmation indicators can be calculated on any other symbol and timeframe. Additionally, the entry signals are filtered by time (up to three sessi

本算法基于货币功率计指标的概念。在此版本中,显示值的数量是无限的,它的代码更紧凑、快速,当前柱线的数值可以通过指标缓存来获取。 指标显示什么 : 在货币之前上部的一条细带显示最后 N 小时的相对强度指数 (N 是参数里的变量 'Hours'), 一条宽带显示日线指数。在输入参数里您可以指定更多使用此货币的货币对 (假设您的经纪商提供这些货币对的报价), 更多指数权重 (但注意 "非主要" 的货币对或异种货币, 它们会扭曲整个画面)。例如, 如果您仅指定了 EURUSD, Euro 的相对指数就会只基于此货币对计算, 如果您加入了 EURGBP, 则 Euro 的指数将会基于两个货币对计算, 并且得到更多的权重值。 如何使用数据 : 在缺乏重要消息时,指数的最低/最高值, 更像是技术性调整或趋势延续。
FREE

热图指示器 此热图指标允许您显示在市场报价中选择的所有代码的“热图”。在此版本中,它显示了 相对于上次每日收盘价的价格变化百分比 ,可以快速了解市场概况。 这是一种工具,可帮助交易者确定一种货币相对于所有其他货币对的强度。这是一个可视化工具,不能在“EA 交易”中使用。从这个意义上说,它更像是一种自由交易者的工具,而不是自动交易者。因此,对于那些有兴趣使用此工具进行自动交易的人来说,很遗憾这是不可能的。 它对股票或期货市场特别有用,例如巴西交易所 Bovespa。
设置 热图指示器中有几个设置需要自定义: <头> 设置 可能的值
描述
隐藏图表? 真 /假
您可以完全隐藏图表或保持原样。当指标从图表中移除时,图表将恢复。
在前景中绘制的图表? 真/ 假
如果之前的设置为 True,您可以选择在前景 (true) 或背景 (false) 中显示图表。
自动排列热图? 真 /假
如果为 true,所有尺寸和排列都会自动完成。否则必须选择进一步的设置。
刷新时间(毫秒) >=1000
数据默认每 5 秒刷新一次。最小值为 1,000(1 秒)。
上色 任何颜色
默认

新闻加载机专业版 是一款从若干在线数据源获取实时的详细信息,并自动更新财经新闻的工具。它采用了独特的技术,加载来自流行外汇交易网站的数据详情。在即将发布新闻时,发送提示到您的移动终端或邮箱。此外,它也在图表上标记新闻发布点,用于进一步查验和研究。 在外汇交易中,新闻可以说是推动市场的重要因素之一。关注新闻可以帮助您更好地做出交易决策, 如果您是新闻交易者, 更能助您进行正确的交易。 利用这款工具,整个新闻中心现在就可以加载到您的 MT4。 演示版: 由于这不是一个交易机器人, 您需要下载单独的演示版本: https://www.mql5.com/zh/market/product/5897 参考: 高级版的新闻操盘手专业版, 可以自动进行新闻交易, 它在此提供: https://www.mql5.com/zh/market/product/5558 注:
您必须添加数据源的 URL, 选项 -> 智能程序 -> '允许 WebRequest 访问列出的 URL', 以便新闻加载机能够从数据源加载新闻数据。
请调整您的计算机时钟,以便新闻装载机可依据正确的定时器运行。
突出特点
Information is a subject of the market mood. Information is objective when it comes from different sources. If information is identical then we may speak about its convergence. Otherwise, we may speak about its conflict (divergence). Indicators and oscillators are the sources of information for technical analysis. Bullish CD LTB Osc (Bullish Convergence/Divergence Low Top Bottom Oscillator) is a universal analytical bulls convergence/divergence indicator between any of the twenty three stand
Information is a subject of the market mood. Information is objective when it comes from different sources. If information is identical then we may speak about its convergence. Otherwise, we may speak about its conflict (divergence). Indicators and oscillators are the s ources of information of the technical analysis. Bearish CD HBT Osc (Bearish Convergence/Divergence High Bottom Top Oscillator) is a universal analytical bears convergence/divergence indicator between any of the twenty three st

Information is a subject of the market mood. Information is objective when it comes from different sources. If information is identical then we may speak about its convergence. Otherwise, we may speak about its conflict (divergence). Indicators and oscillators are the sources of information of the technical analysis. Bearish CD HTB Osc (Bears Convergence/Divergence High Top Bottom Oscillator) is a universal analytical bears convergence/divergence indicator between any of the twenty three sta
Information is a subject of the market mood. Information is objective when it comes from different sources. If information is identical then we may speak about its convergence. Otherwise, we may speak about its conflict (divergence). Indicators and oscillators are the sources of information of the technical analysis. Bullish CD LBT Osc (Bullish Convergence/Divergence Low Bottom Top Oscillator) is a universal analytical bulls convergence/divergence indicator between any of the twenty three sta
PivotPoints Advanced is the usual pivot point table indicator but with the following enhanced features: Customizable start hour to calculate daily pivots Alerts you when some level is crossed by the price Pivot Point's timeframe depends on the chart's one: daily below daily charts, weekly on daily charts and monthly above daily charts. Support and Resistance are mutable for those who only use the pivot point line. Keep the cleanest possible screen following the rules below: Show as much as Pi

IceFX Heatmap is a special indicator that shows the places where the price has been staying and ranging over the past few days. These sites will be displayed in a "Heatmap style", with which you can clearly see the main formed bands. The main rates (where the price has "lingered/stayed" much) are indicated in bright colors (in case of black-and-white view) or red color (in case of color view).
Settings Days - the number of days the heat(map) is calculated for. Resolution - resolution rate. 10
FREE

This expert is a tool to check broker execution and spread. Attach expert in any chart and wait to finish check. Expert sends a pending order (Buy Stop) away from the current price (100 pips) and then modifies it. When expert is removed from chart, pending orders expire and are deleted after 15 minutes.
You can to get source code from here .
Parameters OrdersID - Magic number for orders. ManualLotSize - Lot size for orders. TypeOfOrderUse - Type of order to place (pending or market). TimesMo
FREE

Trades Viewer Free supports EURUSD only. Trades Viewer is a trading helper app for a serious trader. It offers several important data like day range, 22 days average range and predefined PL. It draws trades history and current open positions on a chart. It has a detail panel for viewing a particular trade with just a click on that trade. All these make it very convenient and straightforward to view your entry/exit positions and thus improve your trading system. Features Profit/loss of the curren
FREE
Tick Chart — full-featured chart for MetaTrader 4. A utility for creating and working with a tick chart in the MetaTrader 4 terminal. You can create a tick chart that works exactly the same as a regular chart. You can apply indicators, Expert Advisors and scripts to the tick chart. You get a fully functional tick chart on which you can work just as well as on a regular chart. You can enable the output of the Ask price data. The data are generated in the form of the upper shadow of a tick bar. Fr

MultiCrossAlert is an all-in-one solution to get alerts when an indicator or oscillator makes a cross over or under another indicator line. MultiCrossAlert can manage up to 3 line crosses, so it will be helpful for those traders who work with indicators like Moving Average, Bill Williams' Alligator, Ichimoku, etc. MultiCrossAlert uses the default MetaTrader Alert System but also can send you email notifications or MetaTrader messages if these options are properly configured in the MT4 platform (

The difference between the arithmetic and geometric means at the specified range. Since the greater is the difference between the values, the greater the resulting figure is, actually the indicator shows volatility fluctuations. The arithmetic mean of a certain number of values is the sum of the values divided by their number. The geometric mean is the root of the power of the number of values extracted from the product of these values. If all values are equal, the arithmetic mean and th
Overview Money management is an all-important aspect of trading that many traders often overlook. It is very possible that even with a winning strategy, bad money management can often result in huge loses. Verdure Forex Calculators aims to help traders minimize risk and exposure in the Forex market. Verdure Forex Calculators implements 4 calculators in one single indicator. It is the first of it's kind on MT4 platform. Calculators implemented are: Lot (Trade or Contract Size) Calculator. Margin

The VR Orders History script is designed to upload a trade report to a csv file. This format is intended for additional analysis of trading history in programs such as EXCEL, Openoffice, and Libreoffice. Thanks to the script, it is now much easier for a trader to analyze their trading history. The program facilitates the analysis of the trading history for the MetaTrader 5 terminal. The trader sees structured trading. The entire report is based on the following principle: Position > Order on the
FREE

The difference between the arithmetic and geometric means at the specified range. Since the greater is the difference between the values, the greater the resulting figure is, actually the indicator shows volatility fluctuations. The arithmetic mean of a certain number of values is the sum of the values divided by their number. The geometric mean is the root of the power of the number of values extracted from the product of these values. If all values are equal, the arithmetic mean and th
FREE

Indicator finds most prominent extremums (highs and lows) in history and displays their price levels for currently visible range of prices. 8 levels are shown at most. This is a tool for those who used to lookup the history for important levels formed by reversal points outliers. If price scale is changed manually or adjusted automatically for changes in time scale, indicator visualize all found levels (if any) inside visible area. The width (importance) of a level depends from a number of times

Overview Money management is an all-important aspect of trading that many traders often overlook. It is very possible that even with a winning strategy, bad money management can often result in huge loses. Verdure Lot Calculator aims to help traders minimize risk and exposure in the Forex market. Verdure Forex Calculators implements Lot (Trade or Contract Size) Calculator as an indicator on MT4 platform.
Lot Calculator (trade or contract size) A lot refers to a bundle of units in trade. In For

Monster Harmonics Indicator is a harmonic pattern indicator. It recognizes Gartley, Bat, Crab, Butterfly, Cypher, White Swan, Black Swan, Shark and several other patterns. Projected patterns that are not yet completed are recognized, too. Monster even shows the PRZ (Potential Reversal Zone). Users can add their own user defined patterns to Monster. Besides the current pattern, Monster also shows all patterns in the symbols history. Monster will provide alerts for developing patterns. Introduced
您知道为什么MetaTrader市场是出售交易策略和技术指标的最佳场所吗?不需要广告或软件保护,没有支付的麻烦。一切都在MetaTrader市场提供。
您错过了交易机会:
- 免费交易应用程序
- 8,000+信号可供复制
- 探索金融市场的经济新闻
注册
登录