适用于MetaTrader 4的新EA交易和指标 - 263

The YFX Symbol Watermark indicator is used to display a watermark on your chart, which makes it easy to see at a glance the symbol information for any chart. The displayed information includes: Symbol Name and Timeframe on the chart Description of the currencies Tag line, which can contain any user-defined information All the information can be displayed on the chart so that it can be easily read. The indicator also has parameters that can be set to customize which information is displayed. Para
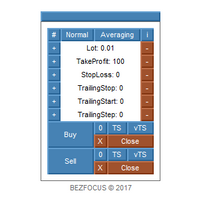
Trading panel for scalping.
Features Two languages (English, Russian). Adjustable panel scale. Two color schemes. Virtual trailing stop. Trailing stop. Averaging.
Parameters Lot - lot size. Lot Button Step - step for changing the lot size using buttons. Take Profit - take profit. Take Profit Button Step - step for changing the take profit using buttons. Stop Loss - stop loss. Stop Loss Button Step - step for changing the stop loss using buttons. Trailing Stop - trailing stop. Trailing Stop B

The indicator allows you to quickly switch from one instrument to another, from one time period to another using the keyboard or buttons on the monitor. Each command can be assigned a hot key from 0-9, a-Z (case-insensitive) and VK_OEM_COMMA ("<" on the keyboard) and VK_OEM_PERIOD (">" on the keyboard). This can help you to operate the maximum number of instruments that are available at your broker, analyze more instruments/periods in less time. This product cannot be tested in the tester , beca

This is a free demo version of the Replicator utility ( https://www.mql5.com/en/market/product/23028 ), which trades the minimum lot and only on EURUSD. The program is designed for copying your successful orders. The price is often fluctuates within a channel. But there is no time to place the next orders, especially if it happens at night. Place an order, when it closed with profit, the program repeats your order as a pending limit order. This will continue until the order closes with a loss, o
FREE

This Script Shows your Account & Symbol information which you use on your graphics. These are: Account Information Number Name Currency Server Leverage Stop Out Level Balance Information Balance Equity Margin Free Margin Symbol Information Symbol Lot Size Min.Lot Lot Step Max.Lot Tick Value Tick Size Spread Stop Loss Level Swap Long Swap Short Initial Margin Maint.Margin Required Margin Trade Allowed

SRP (Strong Retracement/Reversal Points) is a powerful and unique support and resistance indicator. It displays the closest important levels which we expect the price retracement/reversal! If all level are broken from one side, it recalculates and draws new support and resistance levels, so the levels might be valid for several days depending on the market!
Key Features You can use it in all time-frames smaller than daily! Displays closest significant support and resistance levels Update the l

Djinn EA is a fully automated trading robot. Djinn expert system analyzes situation on the market and opens positions in a trend direction. The EA is optimized for GBPUSD pair. When used on H1 chart it is prepared to gain profit in long-term period. Recommended charts are M1 and H1.
Settings Lot - volume of the opened position MaxTrades - maximum number of opened buy or sell trades Maxspread - maximum allowed spread Global_TakeProfit - set to True if you want to automatically close orders when

The Avato is one of our standalone tools. (A Signal based on it will also be provided on Mt4 Market in the future). It is designed around a combined form of hedging and martingale techniques and uses sophisticated algorithms and filters to place the trades. It uses Stop loss and Take profit levels while Lot size is calculated automatically following the according multiplier settings. We consider it a toolbox for every seasoned trader. Made with Gold market in mind, it can be tested in other inst

The EA "Opposite" is a full automated trading expert. The EA uses the hedging strategy as follows: He opens a buy and a sell position at one moment and closes one of the positions after reaching the take profit. Then he opens again two orders in two directions, but in one direction the lot size is bigger than in the other one. Thus one has two possibilities: Either one takes the profit in the direction with less lot size or one takes the profit in the direction with bigger lot size. In the last

軟體說明 此指標可以在不同的時間範圍和設定上顯示 1 或 2 個 MACD 指標。 有一個使用 EMA 進行計算的免費版本。 此專業版使用所有 4 種移動平均類型進行計算:簡單、指數、平滑和線性加權。 活動指示器可以發出彈出、聲音、推播或電子郵件警報。 免費版本僅針對零電平交叉警報,如果使用者選擇該選項,則此專業版警報可以設定為零電平交叉或直方圖訊號線交叉。 可以在一個或兩個活動指標上設定警報,即使每個指標的時間範圍和週期不同。 當使用 2 個 MACD 指標時,警報可以分別對每個指標起作用。
主圖表上有一個帶有按鈕的顯示面板,顯示活動指標及其設定。 有一個選項可以隱藏此面板。 使用臨時按鈕,您可以隱藏活動的 MACD 之一
增加了免費版本所沒有的額外功能:分歧。 您可以選擇在兩個 MACD 上顯示背離。 您可以選擇常規背離或隱藏背離,也可以兩者兼有。 您可以選擇在直方圖或訊號線上顯示分歧。 您也可以只在 MACD 子視窗或價格圖表和 MACD 中顯示線條。 在價格圖表上,您也可以顯示背離箭頭。 您可以針對兩種類型的背離分別設定警報。 顏色和線條粗細選項的完全客製化。

This simple indicator helps defining the most probable trend direction, its duration and intensity, as well as estimate the possible range of price fluctuations. You can see at a glance, at which direction the price is moving, how long the trend lasts and how powerful it is. All this makes the indicator an easy-to-use trend trading system both for novice and experienced traders.
Parameters
Period - averaging period for the indicator calculation. Deviation - indicator deviation. Lag - calculat
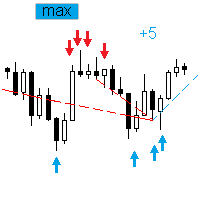
The Expert Advisor trades the signals from an artificial neural network with one hidden layer. Presence of a signal is checked at the closing of the specified period. MAIN PARAMETERS Net option - setting the order grid. When placing a market (not pending, Pending order offset=0 ) order according to a signal, the grid order is set. The following direction are available: follow the trend , against the treand and both directions . The number of placed orders is taken from the ...maximum deals with

This is the multi-time frame Fisher Divergence indicator for MetaTrader 4, with signal arrows and a Signals panel which is freely movable showing the last signals and their time in color. The indicator draws some lines based on signal time. On the time frames below H4, the indicator scans for H4 divergence signals and draws it on chart with thick trend lines, and also it draws arrows for them. And also it scans the current time frame and draws a line at divergence location and places signal arro

This is a simple but sophisticated scalper designed to grab the big, quick moves - always ready to pounce. The STALKER ELITE works by waiting for when the market starts moving quickly and then pounces with quick acting trades. It does this by placing pending buy and sell stop orders above and below the current market price and regularly updates these orders regularly to ensure no false triggers. If the market has a sudden move in any direction, one of these trades will be triggered and the money

Ideally, this is we hope : The good numbers on news should make the related currency become stronger, and the bad numbers on news should make the related currency become weaker. But the fact is: The good numbers on news that has been written on the economic news calendar could not always instantly make the related currency become stronger. and vice versa, the bad numbers could not always instantly make the related currency become weaker. Before placing new position: We need to know which actuall

This tool is developed to make your trading risk and profit management easier. It is able to move all of your opened transaction's take profit and stop loss on to one similar price.
How to use Draw a trend line/horizontal line and name it to "tp_" as the take profit line and "sl_" as the stop loss line. The EA will modify all of your orders' and pending orders' take profit and stop loss to the given line. You can drag the gray box to drag the line. You can see the risk in the account currency

If you would like to trade reversals and retracements, this indicator is for you. The huge advantage is that the indicator does not have input parameters. So, you will not waste your time and will not struggle to change them for different timeframes and symbols. This indicator is universal. The green triangle represents a possibility to go long. The red triangle represents a possibility to go short. The yellow dash represents a "non-trading" situation. This indicator could be used on M1, M5, M15
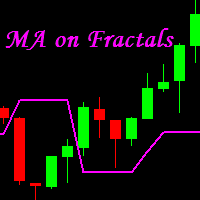
MA on Fractals is a professional trend-following indicator for MetaTrader 4 . It builds a moving average using Bill Williams' fractals. We believe that MA on Fractals is much more efficient than a standard moving average. Its combination with other indicators allows receiving more accurate trading signals. It is most suitable for M15, M30, H1 and H4.
Advantages Unique indicator. Generates minimum false signals. Suitable for beginners and experienced traders. Simple and easy indicator configur

This is an unconventional version of the Heiken Ashi Smoothed indicator implemented as lines rather than a histogram. Unlike a usual histogram, the indicator draws the readings of the two moving averages in the form of colored lines.
Example If the candle crosses two indicator lines upwards, a trend is assumed to be changing from bearish to bullish. If the candle crosses two indicator lines downwards, a trend is assumed to be changing from bullish to bearish. The indicator is good at displayin
FREE

The indicator finds strong trend movements of a currency pair over the specified number of bars. It also finds correction to this trend. When the trend is strong enough, and the correction becomes equal to the values specified in the parameters, the indicator generates a signal. You can set different correction values, while the best suiting are 38, 50 and 62 (Fibonacci levels). In addition, you can configure the minimum length of trend, the number of history bars for search and other parameters
FREE

Super Trend Bars is a trend finding indicator. It tries to find the trends that are most likely to trend. A set of indicators and a set of algorithms. Trend probability changes color when it finds a high trend. The red color represents the declining trend. The lime color represents the upward trend. Super Trend Bar changes color when it finds a trend.
Features This indicator is a trend indicator by itself. It can operate without the need for additional indicators. When you see the first lime c
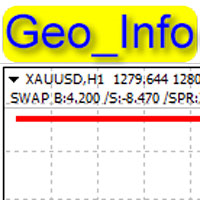
Geo_Info is one of the most informative indicators displaying net levels as well as basic data on a symbol and trading positions in a space-saving manner. displays brief data on the basic symbol parameters in the upper left corner of the chart: Swap for Buy order, swap for Sell order, current spread, margin, tick size, stop level, order freeze level . The data is shown for one lot in points. The data is displayed as follows: SWAP B:4.200 /S:-8.470 /SPR:342 /MRG:256.0/TCV:0.10/STL:0/FRL The data
FREE

"The Niffler is a fluffy, black and long-snouted beast. This burrowing creature has a predilection for anything glittery. Nifflers are often kept by goblins to burrow deep into the earth for treasure." Newt Scamander, "Fantastic Beasts and Where to Find Them". Niffler is a multicurrency trend trading Expert Advisor based on moving averages. A classic seasoned with the magic of modern technology. Niffler uses SMA, EMA, LMA, SWMA, HMA, AMA, TMA, EPMA and RMA on the timeframes M15, M20, H1, H3, H6,

The Expert Advisor of the Forex Fraus family, the system is designed for scalping and adapted for the accounts with fast execution of orders.
Operation Principle It buys and sells based on the values of the internal indicator; When a signal is received, the orders are opened by injection, using tick data; Always sets a stop loss; Positions are closed by Trailing Stop; Not closed positions are closed at the opposite trade; Built-in adjustable risk management block. Depending on the balance, it

The EA consists of multiple virtual Prototype-1 robots (up to 100 strategies depending on the currency pair). Each strategy has different settings. Once the lot sizes for all strategies are calculated, the EA obtains the resulting trading lot. The operation principle is trading within a corridor. When leaving the corridor, the EA closes the positions and saves them for opening in the future. The best condition for trading is a flat, the worst condition is a long trend without rollbacks. Recommen

This is a fully automated multi-currency Expert Advisor with unlimited number of currency pairs using MACD and Envelopes indicators. You can specify how the EA should work with each currency pair. You can add orders manually. The free version is available here .
Parameters Common TradeObjectsDelete : delete trade objects. OrderPanel : display the panel for opening orders. TradeToBalance : target balance to stop trading. The parameter is triggered only after all trades are closed. Otherwise, i

The EMA Trend indicator is a trend indicator using two moving averages. These two moving average is the main trend indicator with 89 EMA. 89 EMA is generally regarded as a trend in the Forex market. The second moving average is 49 EMA. A trend was created using two moving averages. You can use this display alone as a trend indicator. Or with other indicators suitable for your strategy. This indicator sends a warning every new trend starts.
Features You can select and edit the periods. Time fra

Real Trend Lines is an indicator that calculates trends using a set of channels and using a set of algorithms. This indicator helps to find trend return points. It generally represents an oscillator. This trend tracking system helps the investor to understand small or large trends and determines the direction according to it.
Trending features Up trend Rule 1 - yellow trend line should be below zero level. Rule 2 - the yellow trend line should be in the green and orange channel. Rule 3 - the t

Range bands works the same way as Bollinger bands except that they are self adapting, with range trading in mind. Unless you are familiar with Bollinger bands, it is a standard deviation indicator that is based around the concept that when price deviates to quickly from the average, it's going to encounter resistance. This is true for all period settings, since standard deviation 2 or 3 is an extreme on any data. This indicator automatically chooses the period that is currently most suitable for

TOP Xios is a ready-made trading system, which provides the trader with signals for opening and closing deals. The information panel in the right corner of the screen shows the total number of signals, the number of points in profit or loss and the percentage of valid and false signals. Working with this indicator is very simple. As soon as a blue arrow appears, open a buy deal and wait for a red cross to appear, which indicates the necessity to close the deal. When a red arrow appears, open a s

Background It only needs a small initial deposit. Suitable for multi-currency trading. Real account monitoring: https://www.mql5.com/en/signals/294440
Operation Principle The EA opens orders based on a built-in indicator. The EA determines the order with the greatest negative profit each tick. Then the determines the total profit of Buy and Sell orders on each currency pair. If the total profit of Buy or Sell orders on each currency pair plus the amount of the order with the greatest negative

The super oscillator trading system is a trend finding tool. This system consists of a few indicators and a few algorithms. The aim of this indicator is to direct the investor to find healthy trends.
Trade Rules This indicator has two channel lines. These channels are red lines below zero and above zero. There is a line in two places to process. These are blue lines. There is one trend line, the yellow line. Up trend rules Rule 1 - the yellow trend line should close below the red line below th
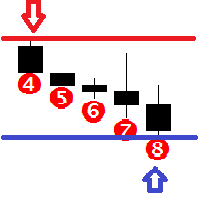
Features This indicator determines consecutive bullish and bearish bars; Determines the High and Low for the last N bars (N can be changed in the settings); It shows the Buy and Sell signals based on the values of other indicators, such as Bollinger Bands, Stochastic and MACD; It graphically displays from 4 to 12 consecutive bullish and bearish bars with an alert; It is possible to disable the alert and unnecessary graphical elements; It is also possible to adjust the number of bars in history,

The trend beads indicator is software that does not include trend indicators such as moving average, Bollinger bands. This indicator works entirely with price and bar movements. The purpose of the indicator is to calculate the most likely trends. To assist the user in determining trend trends. The user determines the trend direction with the colors on the screen. You can use this indicator alone as a trend indicator. Or with other indicators suitable for your strategy.
Trade Rules Rising trend
Drawdown Control (DC) is a helpful utility that can be used like an EA to limit the drawdown of any MT4 account . You can choose between different, fully customizable options of how DC must react if the drawdown reaches critical levels. To utilize the symbol with the most ticks per minute it is highly recommended to put the product on a EURUSD-M1 chart.
Input Parameters Equity / Balance in % to stop trading (0 = disabled) : 85.0 [etc.] Current Balance / Initial BalanceHW in % (0 = disabled) :
Auto-closing a trade using candle Сlose price based on a timeframe opened.
No need to set TP/SL point Make sure connection and PC are always ON (I recommend using 99.9% up-time VPS) Only support for one direction ticket only, if buy and sell ticket exist at the same time, the EA will not activate The EA will automatically activate if the conditions are met
Input NumberOfTry - number of retries if order trigger failed
Condition For Buy Ticket Blue line must be ABOVE the current price Blue l

Olofofo Fx Scanner is a Custom Indicator created to scan through the currency pair it is being attached to in the market on ALL time frames simultaneously from a Minute to Monthly looking for just 3 things that make Forex trading exciting and worthwhile to invest in. Once these are found, it alerts the User immediately for a timely action on the part of the Trader. This is a self-fulfilling prophecy of the market, meaning that even if you are a newbie, by the time you see the graphical display o

Golden Monowave is monowave indicator, the monowave theory is one of Elliott wave approach and one of most complicate and accurate method. Golden Monowave can shortcut many major steps to identify and describe the monowave. It works on any timeframe and with any trading instrument, including currencies, indices, futures, etc.
Input Parameters initial_Bars - set the initial number of bars to calculate. wave_color - select the color of the wave. label_color - select the color of labels. temp_lab

The PriceAction_Helper indicator automatically recognizes Japanese candlestick patterns on charts. The indicator marks the location of a candle pattern and indicates the most likely price direction based on that pattern.
Who can use the indicator If you are a novice in trading Japanese candlesticks, PriceAction_Helper will help you detect patterns, demonstrate how they work and enable you to memorize candle pattern types and names. If you are an experienced trader familiar with Price Action, t

This SMART Expert Advisor trades SAFE and STEADY a nd manages all position's risk.
This is why we call it Smart Safe Steady .
Features Scalper: It is Scalper EA, but does not accept risk a lot to trade over sized, although you can bypass it's default setting in your own risk. Conservative: It is not going to keep trades open in high volatile market so it is SAFE and would close the trades even in zero profit. Martingale: This is not loss accepting so in case of loss, it runs special type of M
FREE
"我相信在市场转折点上能赚到最多的钱。每个人都说,你会因为选择顶部和底部而送命,你可以通过把握中间的趋势赚到所有的钱。十二年来,我一直错过了中间的机会,但我在顶部和底部赚了很多钱。
- 保罗-都铎-琼斯
交易策略:在趋势反转或回调时入市。 货币对: 欧元/美元。 建议最低存款额:100 美元/0.01 手。
操作说明 Trend Raptor 使用的专有交易策略由 Kalinka Capital OU(爱沙尼亚)公司的交易员开发。Trend Raptor 是一款高效、无风险的自动外汇交易智能交易系统。
Trend Raptor 的主要特点之一是根据 EA 预测的市场情况,采用灵活的方法获取利润并应用四个指定参数中的一个。
Trend Raptor 能非常准确地确定进场点。它通过位于交易终端图表上的信息面板提前通知交易者即将做出的决定。EA 使用集成的非标准指标和过滤器进入市场。测试期间,盈利交易的数量超过 90%。每笔交易的获利范围从 20 点到 100 点不等。
EA 还应用了 "盈利时间 "功能。如果价格在设置中指定的时间后未达到指定的止盈,且预测未被
該指標使用輸入參數柱檢測策略檢測突破。 您可以使用 WaitForBarClosed 函數來確認信號 (true),但它有時會比 false 晚一點激活。 該指標在單獨的窗口中打開。 適用於所有時間範圍和貨幣對。 藍線表示趨勢方向。
將指標附加到任何圖表 在彈出的指標對話框的輸入選項卡中選擇所需的輸入。 選擇確定以確認並繼續。
參數 Lines_Break:Period,推薦值為3~21,period越大指標越平滑。 WaitForBarClosed:“真”或“假”。 您可以通過更嚴格的止損和較小的獲利水平使用“false”作為較早的信號。 您可以使用“true”來確認信號。 查看同時使用 true 和 false 選項的屏幕截圖。 该指标使用输入参数柱检测策略检测突破。 您可以使用 WaitForBarClosed 函数来确认信号 (true),但它有时会比 false 晚一点激活。 该指标在单独的窗口中打开。 适用于所有时间范围和货币对。 蓝线表示趋势方向。
将指标附加到任何图表 在弹出的指标对话框的输入选项卡中选择所需的输入。 选择确定以确认并继续。
参

Twins 基于随机指标的振荡器。指标的上限读数可用作买入信号,指标的下限读数可用作卖出信号的读数。 设置: Kperiod - 用于计算% K 线的周期(柱数)。 Dperiod - 用于计算 % D 线的平均周期。 减速——减速。 方法 - 平均方法(简单、指数、平滑、线性加权)。 价格 - 计算价格(0 - 最低价/最高价,1 - 开盘价/收盘价)。 Coefficient_K - 动态系数。 基于随机指标的振荡器。指标的上限读数可用作买入信号,指标的下限读数可用作卖出信号的读数。 设置: Kperiod - 用于计算% K 线的周期(柱数)。 Dperiod - 用于计算 % D 线的平均周期。 减速——减速。 方法 - 平均方法(简单、指数、平滑、线性加权)。 价格 - 计算价格(0 - 最低价/最高价,1 - 开盘价/收盘价)。 Coefficient_K - 动态系数。

这个多时间框架和多品种指标扫描 Pin bar、晨星/晚星、吞没、镊子、三线罢工、内线和三角旗。该指标也可用于单一图表模式。请在产品的 博客 。结合您自己的规则和技术,该指标将允许您创建(或增强)您自己的强大系统。 特征
可以同时监控您的市场报价窗口中可见的所有交易品种。将该指标仅应用于一张图表,并立即监控整个市场。 监控从 M1 到 MN 的每个时间范围,并在识别出模式时向您发送实时警报(弹出、推送或邮件)。 可以使用 RSI 和布林带作为 pin bar、晨星/晚星、吞没和镊子形态的过滤器,以便正确识别潜在的逆转。 可以使用移动平均线作为主要趋势过滤器 ,使用 ADX 作为波动率过滤器。 该指示器包括一个交互式面板。当单击一个项目时,将打开一个带有相关代码和时间范围的新图表。 该指标可以将信号写入一个文件,EA 可以使用该文件进行自动交易。比如 这个产品 。
Pennant 和三角形扫描可识别高概率的突破模式。它通过识别强大的、对称的三角旗和三角形来做到这一点。这种模式在更高的时间范围内不会经常出现。但是当它发生时,这是一个非常高概率的设置。请看截图 在这里 。

这个多时间框架和多品种指标识别高概率的突破模式。它通过识别强大的、对称的三角旗和三角形来做到这一点。这种模式在更高的时间范围内不会经常出现。但是当它发生时,这是一个非常高概率的设置。该指标还包括一个内柱扫描仪。例如,它可用于检测由主蜡烛 (MC) 和 4 个内部蜡烛形成的特殊类型的内线形成(请参阅下面的策略说明)。 可在此处 找到该策略的单独指标。结合您自己的规则和技术,该指标将允许您创建(或增强)您自己的强大系统。 特征 可以同时监控您的市场报价窗口中可见的所有交易品种。将该指标仅应用于一张图表,并立即监控整个市场。 可以监控从 M1 到 MN 的每个时间范围,并在识别出三角旗、三角形或内线形态时,或在形态发生突破时向您发送实时警报。支持所有 Metatrader 原生警报类型。 该指示器包括一个交互式面板。请参阅下面的屏幕截图 #4。 可以配置为显示买入/卖出线和 TP/SL 线(基于 ATR 乘数)。这些线将显示在您通过单击面板中的信号打开的图表上。请参阅下面的屏幕截图 #5。 该指标可以将信号写入一个文件,EA 可以使用该文件进行自动交易。比如 这个产品 。 输入参数
请

特征 这是一个识别特殊类型内线形态的指标,该形态由主蜡烛和 4 个较小的蜡烛形成(请参阅下面的策略说明)。 在图表上绘制买入/卖出止损线以及止盈和止损水平。 TP/SL 水平基于平均真实范围 (ATR) 指标。 对象颜色是可变的。 当确定主蜡烛形成时向您发送实时警报 - 声音/弹出窗口/电子邮件/推送通知。 提出建议后,您可以通过自己的图表分析进行确认。通常,最好的交易设置是围绕重要支撑/阻力、整数、供需区域等发生的设置。 如果您想在多个图表上使用该指标,您可以考虑利用我的三角旗和三角形扫描仪中的内线扫描,您可以找到 在这里 。 输入参数
内部蜡烛的数量 :为了获得最佳信号质量,建议将其设置为 4。请参阅下面的策略说明。 最大蜡烛图信号适用于 :此设置控制建议的入场线将扩展多长时间。 买入/卖出止损点的距离 :入场线的偏移量/缓冲区。建议主蜡烛高/低至少 5 个点。 以点为单位的最小主蜡烛尺寸 :请参阅下面的策略说明。 以点为单位的最大主蜡烛尺寸 :请参阅下面的策略说明。 等待蜡烛关闭 :真/假。默认为真。如果设置为 False 那么警报将在 4 个 蜡烛打开。 忽

The indicator trades during horizontal channel breakthroughs. It searches for prices exceeding extreme points and defines targets using Fibo levels. The indicator allows you to create a horizontal channel between the necessary extreme points in visual mode quickly and easily. It automatically applies Fibo levels to these extreme points (if the appropriate option is enabled in the settings). Besides, when one of the extreme points and/or Fibo levels (50%) is exceeded, the indicator activates a so

PointerX is based on its own oscillator and built-in indicators (Pulser, MAi, Matsi, TCD, Ti, Pi) and operates independently.
With PointerX you can create your own strategies . Theoretically all indicator based strategies are possible, but not martingale, arbitrage, grid, neural networks or news.
PointerX includes 2 Indicator Sets All Indicator controls Adjustable Oscillator Take Profit controls Stop Loss controls Trades controls Margin controls Timer controls and some other useful operations.

LogicalTraderEA is a Hedging expert advisor which uses a grid recovery strategy. Trading Strategy LogicalTraderEA trades on all types of pairs. It works most efficiently on an account with a high margin, which plays a huge role in any strategy. The user has to be able to consider withdrawal as a part of the strategy. This EA works on all time frames without losing its efficiency, but it works most efficiently in the H1 time frame. I have already set the most optimal default parameters in accorda

Operation principles The main advantage of the Expert Advisor is that you do not need to set multiple parameters and understand the Forex market principles. All you need is to set one parameter according to the recommendations given in the description and launch the EA. The robot calculates the necessary lot volume, acceptable risk and closing amount. The EA works on any timeframe and symbol. Several parameters and indicators are analyzed during the EA operation. Orders are opened and profit is
This Expert Advisor uses ATR as CORE indicator for GRID operative.ATR measures intrinsec volatility. Using ATR on a GRID, you will give enought space between lines considering current volatility.
On this EA, you can set ATR period and timeframe parameters, and also you can set a ATR multiplier factor, to increase margin between each GRID level. In the same way, you can also configure the number of GRID levels (up and down) as well as the color of the drawn lines.
In addition, it has a start/

SMArtin is an adaptation of the classic SMA+WPR strategy, which enters the market at the overbought/oversold states of the WPR indicator, with the SMA indicator as a filter. Trading is performed during the European and at the beginning of the American sessions. If there is a loss, the next entry will be made with an increased lot, and with an increased take profit in a trade series (which allows using a smaller order volume and, correspondingly, decrease the deposit load). Symbol : EURUSD; Timef

This indicator is based on a classical Commodity Channel Index (CCI) indicator and shows a digital values of CCI from two higher (than current) Time Frames. If, for example, you will put it on the M1 TF it will show a digital values of the CCI from M5 (TF1) and M15 (TF2). As everybody knows, the CCI is using +100 (LevelUp) and -100 (LevelDn) boundaries. You have the possibility to change those numbers according to your strategy. When a line graph of the CCI will go higher than LevelUp then a gre

The MACD_stopper_x2 indicator shows where the trend has a tendency to stop or reverse. It uses the standard MACD indicator and a proprietary formula for processing data obtained from MACD. There are 2 types of stop/reversal signals: Small cross - probability of a trend stop/reversal is 70-80%; Large cross - probability of a trend stop/reversal is 80-80%; If there are open trades (for example, BUY) on the symbol the indicator is attached to, and the BUY trend ends, the indicator sends push notifi
FREE

Developed by Etienne Botes and Douglas Siepman, the Vortex Indicator consists of two oscillators that capture positive and negative trend movement. In creating this indicator, Botes and Seipman drew on the work of Welles Wilder and Viktor Schauberger, who is considered the father of implosion technology. Despite a rather involved formula, the indicator is quite straightforward to understand and easy to interpret. A bullish signal triggers when the positive trend indicator (VI+ green line) crosse
FREE

The indicator is based on the analysis of interaction of two filters. The first filter is the popular Moving Average. It helps to identify linear price movements and to smooth minor price fluctuations. The second filter is the Sliding Median. It is a non-linear filter. It allows to filter out noise and single spikes in the price movement. A predictive filter implemented in this indicator is based on the difference between these filters. The indicator is trained during operation and is therefore

The arrow indicator 'Magneto Flash" is based on candlestick analysis and does not use built-in terminal indicators. It determines entry points in the current candlestick (a signal can be canceled) and informs about a confirmed signal on the next candlestick.
Indicator setup and use Only two parameters can be used for optimization - the hour of the beginning and end of chart analysis period. These data for some instruments will be available in product comments page, but you can easily find your
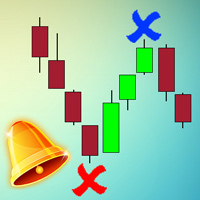
The MACD_stopper_x2 indicator shows where the trend has a tendency to stop or reverse. It uses the standard MACD indicator and a proprietary formula for processing data obtained from MACD. There are 2 types of stop/reversal signals: Small cross - probability of a trend stop/reversal is 70-80% Large cross - probability of a trend stop/reversal is 80-80% If there are open trades (for example, BUY) on the symbol the indicator is attached to, and the BUY trend ends, the indicator sends push notifica

Every successful trader knows what support and resistance spots are working. And always know that these points need to be kept in mind. They always trade according to this point. The support and resistance point indicator operates in two different modes. The first is the standard support and resistance points we know. The second is Fibonacci levels. This indicator automatically calculates and displays the support and resistance points on the screen.
Features You can select the time frame you w
This is a simplified and effective version of the library for walk forward analysis of trading experts. It collects data about the expert's trade during the optimization process in the MetaTrader tester and stores them in intermediate files in the "tester/Files" directory. Then these files can be used by the special WalkForwardBuilder script to build a cluster walk forward report and rolling walk forward reports for refining it. The intermediate files should be manually placed to the "MQL4/Files

Box martingale system is an indicator designed to trade martingale. This indicator sends a signal from the highest point where the trend is likely to return. With these signals the user starts the trades. These signals appear in the form of a box. The user can see from which point the signal is given. The important thing in trading martingale is to find a good starting point. This indicator provides this starting point.
Trade rules Start processing when the first trade signal arrives. The impo
This script allows performing a walk-forward analysis of trading experts based on the data collected by the WalkForwardLight library. The script builds a cluster walk forward report and rolling walk forward reports that refine it, in the form of a single HTML page. Since the library generates files with the metadata in the "tester\Files" directory (during the optimization), it is necessary to manually move the files to the "MQL4\Files" directory. The script only works in conjunction with the lib
FREE

The indicator plots an affine chart for the current instrument by subtracting the trend component from the price. When launched, creates a trend line in the main window. Position this line in the desired direction. The indicator plots an affine chart according to the specified trend.
Input parameters Maximum number of pictured bars - the maximum number of displayed bars. Trend line name - name of the trend line. Trend line color - color of the trend line. Black candle color - color of a bullis
FREE

Critical Regions Explorer displays two fixed regions daily. These regions are powerful regions where price are likely change direction. It can be best used with all timeframes less than or equal to Daily timeframes and can be used to trade any instruments.
Graphical Features Critical regions display. No repainting.
General Features Automated terminal configuration. Accessible buffers for EA requests.
How to Trade At the start of the day, do these four things: Identify upper critical region

The High and Low Points indicator is designed to calculate potential order points. The main feature of this indicator is to specify the points that the price can not exceed for a long time. The market always wants to pass points that can not pass. It is necessary to place an order waiting for this point indicated by this indicator. Is an indicator that constitutes many EA strategies. Designed for manual trading.
Transaction Strategies High point buy stop order Low point sell stop order For exa

Are you tired of channeling? This indicator is designed to draw channels. Triple graphics channels, automatically installs 3 different graphics channels. These channels are shown on a single graphic. These channels are calculated by a number of different algorithms. Automatically draws on the screen. You can select three time zones.
Parameters Period1 - from here you can select the first period. It can be selected from 1 minute time period to monthly time period. Period1_Channel_Color - period

The RSI Signals Manager Expert Advisor trades the signals of the RSI indicator. Trades are performed in an appropriate direction when the indicator reaches the value of RSI_Level_Down or RSI_Level_Up . If the indicator exceeds RSI_Level_Up , Short direction is selected for initial trades. If the indicator falls below RSI_Level_Down , Long one is selected. If Inversion = true , the trades are opened in the reverse direction. Profitable trades are closed by take profit. Loss-making ones are averag

Tired of online risk calculators that you manually have to fill out? This neat little dashboard instantly shows you, your risk, reward and risk vs reward as soon as you've sat your Stop-loss or Take-profit. Works on both market and pending orders. By far, my most used indicator when trading manually on mt4.
Advantages Can handle multiple positions. And gives the total risk and reward for all positions on all manually placed or pending positions on the current chart. Automatically recalculates

The Quantum Expert Advisor is designed for trading EURUSD H1 . The trading algorithm lies in placing pending orders at the peaks of currency fluctuations, after a preliminary analysis of the market conditions. Trading is fully automated. Lot size is calculated automatically based on the lot percentage.
Parameters MaxRisk - percentage of the deposit, used for the automatic calculation of the lot. LongWave - long wave of price fluctuation. ShortWave - short wave of price fluctuation. Level contr
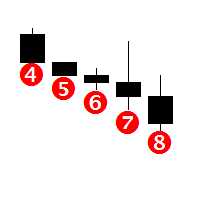
Features This indicator determines the consecutive bullish and bearish bars; It graphically displays from 4 to 12 consecutive bullish and bearish bars with an alert; It is possible to disable the alert and unnecessary graphical elements; It is also possible to adjust the number of bars in history, where the graphical elements of the indicator are to be drawn (0 = all available bars); There is an option to change the size of the graphical elements. This indicator is well suited for trading binary
MetaTrader市场是您可以下载免费模拟自动交易,用历史数据进行测试和优化的唯一商店。
阅读应用程序的概述和其他客户的评论,直接下载程序到您的程序端并且在购买之前测试一个自动交易。只有在MetaTrader市场可以完全免费测试应用程序。
您错过了交易机会:
- 免费交易应用程序
- 8,000+信号可供复制
- 探索金融市场的经济新闻
注册
登录