 MetaTrader 5
 专家
 指标
 程序库
 实用工具
 窗口小部件
 规则
适用于MetaTrader 4的新EA交易和指标 - 16
 EA交易自动执行市场交易,而指标可使您更准确地分析报价并预测价格行为。
通过这些应用程序,您将能够更明智地在MetaTrader 4执行交易,抓住更多的交易机会。

Volatility Dots puts a trailing line of dots on your chart. In an uptrend the dots sit under the price, in a downtrend above it, and they flip when price closes through the opposite band. It works on any symbol and any timeframe. It reads only the prices your terminal already has, does not use any server, does not send anything out, and does not open or change orders. What It Shows One dot per bar. White dots under the candles mark a rising trend, red dots above the candles mark a falling trend.

Daily Range Ladder draws six horizontal levels across the current trading day. The distances come from how far the symbol usually travels in a day, so the levels adapt to every symbol without any setting. It works on any symbol and any chart timeframe. It reads only the daily bars your terminal already has, does not use any server, does not send anything out, and does not open or change orders. What It Shows Three resistance levels above the day's low and three support levels below the day's hig

The Chart Mechanics Opening Range Indicator for MetaTrader 4 draws the opening range of the Asia, London and New York sessions and marks breakouts from each range on closed candles. What it shows A box for each session's opening range (the first 30 minutes by default, adjustable) Session times adjusted to your broker's clock and daylight saving automatically, or set manually A breakout arrow when a candle closes outside the range Optional entry, stop-loss and take-profit lines for each breakout,

The Chart Mechanics SMC Indicator for MetaTrader 4 marks market structure on your chart: supply and demand zones, breaks of structure, liquidity grabs and fair value gaps. Everything is calculated from closed candles. What it shows Fresh supply and demand zones, extended to the right until price returns to them, with the option to also show zones that have been revisited Breaks of structure (BOS), labelled on the chart Liquidity grabs (LQG), where price runs a recent high or low and turns back F

The Chart Mechanics Trend Indicator for MetaTrader 4 highlights trend-following setups on closed candles and shows a suggested entry, stop-loss and take-profit for the latest one. What it shows An arrow under or over the candle when a bullish or bearish trend setup appears, on closed candles only, so arrows do not repaint Entry, stop-loss and take-profit lines for the latest setup, with the stop based on market volatility A title and status line showing the current state Risk : reward
Choose 1:

The Chart Mechanics Trend Expert Advisor is a trend-following Expert Advisor (EA) for MetaTrader 4, built for the major currency pairs and gold (XAUUSD). Every trade is opened with a stop-loss and a take-profit already set, and the position size is worked out from the risk you choose. It holds one trade at a time per chart. How it works
The EA waits for a trend to be confirmed on closed candles and on a higher timeframe before it looks for an entry. It then sizes the trade from your risk settin

Maxgen Multi Strategy Grid is a grid expert advisor for MetaTrader 4. It runs up to nine independent strategy slots on a single chart. Each slot has its own magic number, so the positions it opens are managed separately and never interfere with the other slots.
The EA was developed and tested on XAUUSD. It also runs on major currency pairs and on crypto CFDs such as BTCUSD.
HOW IT TRADES The EA opens a position and, if price moves against it, adds further positions at a fixed distance. Each a

KRAKEN 8X:多货币强度交易 EA 配备 10% 最大回撤硬性止损保护。
买家重要通知 请注意 针对部分自营交易公司(Prop Firm),我们只能提供数量有限的定制参数设置。这是有意为之,目的是避免多位买家使用完全相同的设置,从而在不同账户上触发相同的交易。 早期买家将优先获得最佳的可用设置。随着用户数量的增加,这些优选配置的可用名额可能会越来越有限。 如果您计划将此EA用于自营交易公司账户,强烈建议您尽早购买,以确保获得最佳设置。 实盘信号 :2 年真实交易
稳定增长 | 回撤 2.9% | 真实账户,未追加入金 加入我们的公开群组 了解更多 --> [ 阅读博客 ]
适合自营交易公司(Prop Firm)
内置 FTMO 限制新闻过滤器 | 每日回撤保护 | 可选每日盈利目标 最低资金:$500 | 无 DLL | 全自动 欢迎使用 Kraken 8X! Kraken 8X 是一款多货币 EA,由独有的货币强弱分析引擎驱动。大多数 EA 只看它所加载的那一个图表。Kraken 8X 会同时分析 8 种主要货币,只在市场出现明确机会时才交易。 运作方式 Kraken

AI GOLDEN LIFE is a professional AI-powered trading system developed exclusively for XAUUSD (Gold) on the H1 timeframe. It represents a new generation of automated Gold trading, combining advanced technical analysis, intelligent market filtering, adaptive trade management, and innovative geopolitical risk protection. Unlike traditional scalping systems that focus on rapid market fluctuations, AI GOLDEN LIFE operates on the H1 timeframe , analyzing broader market structures, price action, moment

X-Prime EA
MT5 版本: https://www.mql5.com/en/market/product/195895 X-Prime EA 是一款专为 XAUUSD(黄金) 开发的高级自动化交易系统。
基于精密的市场结构分析和动态机构风险模型,它在严格保护您账户余额的同时,充分利用黄金的波动性。 “无需繁琐设置——选择您的风险级别,X-Prime EA 将为您完成所有重活。” 价格提示: 当前价格为促销价,达到销售限制后 将很快涨价 。请在涨价前立即锁定您的购买资格。
重要链接与资源:
[ MT5 MQL5 市场链接 ]
[ 下载道具公司(Prop-Firm)SET 配置文件 ]
[ 信号监控 1 ] | [ 信号监控 2 (PropFirm 低风险) ]
[ 开发者主页与技术支持 ] 核心特点与优势 智能风险管理: 内置动态手数计算、回撤预算管理和风险控制区域,全面保护您的资金安全。 3 种风险与活动模式: 提供 6 种预设活动级别(Minimal、Light、Balanced、Strong、Full、Auto),完美契合您的风险偏好。 自适应黄金扩展算

别再猜手数了。TravaRisco Lot Calculator 直接在图表上显示与您所选风险相符的精确手数。 工作原理: 在面板中输入风险百分比和以点数表示的止损,指标会立即计算: 风险金额(以账户货币计) 该止损下每 1 手的亏损 按您经纪商的交易量步长取整后的精确手数 取整后的实际风险 适用于外汇、黄金、指数和加密货币,使用您自己经纪商的点值。面板支持英语或葡萄牙语。它不会开仓,只做计算。 参数: Risk per trade:每笔交易风险,占余额的百分比(默认 1%) Default stop loss:初始止损点数(默认 200) Language:面板语言(英语或葡萄牙语) X position / Y position:面板在图表上的位置 Background color:面板背景颜色 需要用于自营交易公司挑战的每日亏损锁定?请查看 TravaRisco Daily Loss Lock MT4。 下一步:一键以此精确手数开仓,自动管理止损、止盈、保本和部分平仓: TravaRisco Trade Manager MT4 觉得有用吗?在本页留下简短评价,可帮助其他交易者找到
FREE

糟糕的一天就可能让自营公司挑战失败。TravaRisco 每秒检查账户四次,在规则被违反之前采取行动。 模拟账户 14 天免费试用版: https://www.mql5.com/en/blogs/post/778026 v2.0 新功能 自营公司预设: FTMO 2-Step、FTMO 1-Step、The5ers High Stakes、FundedNext Stellar 2-Step 或自定义。选择预设并输入账户规模,每日和最大亏损规则即自动设置。 挑战跟踪: 在面板上实时显示盈利目标进度、最少交易天数和最佳日一致性规则。达到目标和最少天数后,可平掉所有仓位并锁定账户。 保护功能 每日亏损限额,可按百分比或固定金额,从当日基准或初始余额计算。 达到限额时:平掉所有仓位,删除挂单,并在每日重置前阻止新交易。 锁定期间开立的任何交易(手动或其他 EA)都会被立即平仓。 最大回撤:静态、按余额追踪或按净值追踪。 每日最大交易次数、单笔最大亏损、可选每日盈利目标。 可选周五平仓,避免周末持仓。 在限额的指定百分比时提前警告,带弹窗和手机推送。 手数计算器,建议手数永远不超过当日剩余限额。

ApexConverge 是一款 MetaTrader 5 指标,可自动识别三角形形态(上升、下降和对称三角形),绘制带阴影区域的边界线,并用箭头标记突破的K线。 MT5-version: https://www.mql5.com/en/market/product/200424
工作原理 指标先找出波段高点和低点,通过它们拟合两条趋势线并检验形状:上沿水平、下沿上升为上升三角形;上沿下降、下沿水平为下降三角形;两条线以相近斜率收敛为对称三角形。价格在突破之前必须一直处于形态内部。形态会延迟几根K线出现(参见 Swing confirmation (bars after) ),已确认的信号不会重绘。 交易用法 上升三角形 (水平阻力):通常关注向上突破。 下降三角形 (水平支撑):通常关注向下突破。 对称三角形 :中性形态,顺着突破方向交易。 向上箭头表示收盘价突破上沿,向下箭头表示收盘价跌破下沿。可在箭头出现时或回踩突破线时入场;止损放在对侧边界或最近的波段点之外;常见目标是以三角形最宽处的高度从突破点向外投射。 带有“(no breakout)”或“(expired)”标注的虚线

SAYON Performance PRO MT4 is a professional statistics dashboard for MetaTrader 4.
Three sections in one window: the Dashboard with everything about your account, the new Monte Carlo that shows how far your account can fall and how big your lots can be, and the new Analysis that tells you which EA really makes money and how your trading behaves. It is an indicator: it works on any chart, next to any Expert Advisor. It does not trade and does not change anything on your account. NEW – MONTE CARLO

Elliott Live 是一款 MetaTrader 5 指标,可在历史行情和当前K线上自动标注艾略特波浪。已完成的波浪用实线绘制,正在形成的波浪用虚线并带有问号标记(例如“3?”),同时显示斐波那契目标位和失效位。 MT5-version: https://www.mql5.com/en/market/product/200604
工作原理 指标首先构建波段(ZigZag):当价格从极值回撤至少 ATR × 倍数时,确认一次反转。最后一个点是当前极值,尚未确认,可能继续移动。 在这些波段上,按艾略特规则识别推动浪 1-2-3-4-5:第 2 浪不会跌破(或突破)第 1 浪起点,第 3 浪不会是最短的一浪,第 4 浪不会进入第 1 浪的区域。推动浪之后识别 A-B-C 调整浪,再识别下一组推动浪。 如果最新的波段只构成形态的一部分(例如 1-2),指标会显示正在形成的波浪:带“?”的标签、指向当前极值的虚线、斐波那契目标位和失效位。价格已经越过的目标位会自动隐藏。 当下一次反转达到 ATR 阈值时,该波浪被确认,线条变为实线。 使用方法 判断当前所处的市场阶段:是推动浪还是调整浪

Adaptive Volume Profile 直接在图表上绘制最近 K 线的成交量分布(Volume Profile):控制点(POC)、价值区域(VAH / VAL)、高成交量节点(HVN)、低成交量节点(LVN),以及可选的成交量直方图。价格行的大小会根据当前波动率(ATR)自适应,因此在任何品种和周期上都清晰易读。 功能特点 POC - 窗口内成交量最大的价格水平 Value Area (VAH / VAL) - 包含所选成交量比例的价格区间(默认 70%) HVN / LVN - 高成交量和低成交量节点(价格倾向于停留或快速穿过的水平),根据档位的平均成交量进行统计判定;相邻的价格行会合并为一个区域,使图表保持整洁 自适应价格行宽度 - 价格行根据 ATR 确定大小,并受最大行数限制 实时滚动档位 - 每根新 K 线根据最近 N 根 K 线重新计算 固定日期档位 - 构建截止于所选日期的档位(例如开仓时刻),查看当时的价位水平 独立的档位周期 - 例如在 M15 图表上使用 H4 档位 两种成交量分配模式 - 每根 K 线的成交量分布在其最高-最低价范围内(默认),或放在收盘
FREE

Gold Aegis Protocol 是一款适用于 MetaTrader 4 的智能交易系统(EA),通过待成交的停止单交易高时间框架的 XAUUSD 枢轴突破。止损、止盈、追踪止损和保本规则在入场之前即已确定。可以同时监控多个相互独立的结构。 这是 MetaTrader 4 版本,规则与之相同。以下数据来自 MetaTrader 5 真实报价(tick)测试。MetaTrader 4 测试器由于其自身的报价时序和成交模式,结果会有一定差异。 逻辑 读取高时间框架上的枢轴结构。 在确认的价位附近下待成交停止单。未被成交的订单会自动过期。 同时跟踪多个相互独立的结构,每个结构有各自的几何形态和各自的风险份额。 不存在马丁格尔、网格或向下摊平操作,也不会为了挽回亏损而加大仓位。每一笔已成交的持仓都在券商侧设有止损。 输入参数 风险级别 固定手数 最大手数 魔数(Magic number) 订单注释 最大点差 表格中的每一行都有对应的预设(preset)文件。 历史模拟 在 MetaTrader 5 策略测试器中对 XAUUSD 进行模拟,使用真实报价数据,区间为 2019 年至 2026

Gold Oracle Cipher 是一款适用于 MetaTrader 4 的 Expert Advisor(EA),在选定的更高时间周期 XAUUSD 突破经过额外确认后进行交易。它使用挂单(stop order)和预先设定的出场。默认 preset 采用较低的风险敞口,可通过风险输入进行调整。 这是 MetaTrader 4 版本,规则相同。以下数据来自 MetaTrader 5 的真实 tick 测试。MetaTrader 4 的测试器由于其自身的 tick 时序和成交模型,结果会有所不同。 逻辑 跟踪一组独立的更高时间周期结构。 在介入其中任何一个之前,要求获得额外确认。 订单挂在价位上等待,而不是追价,并且出场预先设定。 未按预期发展的持仓会被释放,而不是死守。 不存在马丁格尔、网格或摊平加仓,也不会为了挽回亏损而加大仓位。每一笔已成交的持仓都有券商端的止损。 输入参数 风险级别 固定手数 最大手数 Magic number 订单注释 最大点差 表格中的每一行都有对应的 preset 文件。 历史回测 MetaTrader 5 Strategy Tester 在 XAUUS

Gold Titan Vanguard 是一款适用于 MetaTrader 4 的 EA,使用挂单(stop order)在高时间框架上交易 XAUUSD 的价格扩张行情。每笔订单都有预设的出场和移动止损规则。亏损仓位不会被加仓放大。 这是 MetaTrader 4 版本,规则完全相同。以下数据来自 MetaTrader 5 的真实 tick 测试。MetaTrader 4 的策略测试器由于其自身的 tick 时序和成交模式,结果会有所不同。 逻辑 在高时间框架上交易已确认的结构,可同时存在多个独立的交易设置。 每个交易设置的仓位大小独立计算。 入场使用挂单(stop order),因此市场价格必须触及该价位才会成交。 出场位置在入场时即固定,之后只做向有利方向的管理,绝不会放宽。 不使用马丁格尔、网格或摊平加仓,也不会为了挽回亏损而加大仓位。每笔成交的持仓都在券商侧设有止损。 输入参数 风险级别 固定手数 最大手数 Magic number 订单注释 最大点差 表格中的每一行都有对应的 preset 文件。 历史回测 MetaTrader 5 策略测试器在 XAUUSD 上使用真实

Gold Zenith Meridian 是一款适用于 MetaTrader 4 的 Expert Advisor,它对高时间周期的 XAUUSD 突破位应用交易时段和市场状态过滤条件。它使用挂单(stop order)、预设的出场规则以及可配置的风险参数。 这是 MetaTrader 4 版本,规则相同。以下数据来自 MetaTrader 5 真实 tick 测试。MetaTrader 4 策略测试器由于其自身的 tick 时序和成交模型,结果会略有不同。 逻辑 跟踪高时间周期上的多个独立结构。 检查突破前后的条件,而不仅仅是突破本身。 挂单在未触及价位时保持等待,并在未成交的情况下失效。 止损、目标位和追踪规则在持仓建立之前就已确定。 不使用马丁格尔、网格或向下加仓摊平,也不会为了挽回亏损而加大仓位。每一笔成交的持仓都有经纪商侧的止损。 输入参数 风险水平 固定手数 最大手数 Magic number 订单备注 最大点差 表格中的每一行都有对应的 preset 文件。 历史模拟 MetaTrader 5 策略测试器在 XAUUSD 上的模拟,使用真实 tick 数据,2019 年至

Gold Pantheon Sovereign 是一款适用于 MetaTrader 4 的智能交易系统,在同一程序中包含多个相互独立的策略账本,用于交易 XAUUSD。各账本使用挂单(止损买单/止损卖单)和预设的出场规则。仓位规模通过一个账户级别的风险预算进行统一协调。 这是 MetaTrader 4 版本,规则相同。以下数据来自 MetaTrader 5 真实 tick 测试。MetaTrader 4 策略测试器由于其自身的 tick 时序和成交模型,结果会有所不同。 逻辑 每个账本在各自的时间周期上读取市场结构。 每个账本围绕已确认的价位设置挂单(止损买单/止损卖单)。未被触发的订单将过期失效。 止损、目标位和跟踪规则在持仓建立之前就已确定。 一个风险输入参数同时缩放所有账本,使各账本之间的比例保持一致。 不存在马丁格尔、网格或向下加仓摊平,也不会通过加大仓位来挽回亏损。每个成交的持仓都带有经纪商端的止损。 输入参数 风险等级 固定手数 最大手数 Magic number 订单注释 最大点差 表格中的每一行都对应一个预设文件。 历史模拟 MetaTrader 5 策略测试器在 XA

Gold Obsidian Crown 是一款适用于 MetaTrader 4 的智能交易顾问(Expert Advisor),用于监控多个更高时间周期的 XAUUSD 结构。它会按预设的出场设置下达挂单形式的 stop order,并在各个激活的结构之间分配风险。 这是 MetaTrader 4 版本,规则相同。以下数据来自 MetaTrader 5 的真实 tick 测试。MetaTrader 4 的测试器由于其自身的 tick 时序和成交模型,结果会有一定差异。 逻辑 读取更高时间周期的结构,并在已确认的价位附近下达挂单形式的 stop order。未成交的订单会过期失效。 多个相互独立的结构并行运行,每个结构都有自己的几何形态和风险预算份额。 出场是预设好的。 RiskBudgetPercent 输入项用于设定总风险预算。 不使用马丁格尔、网格或向下摊平,也不会通过加大仓位来挽回亏损。每一笔已成交的持仓在券商端都有止损。 输入参数 风险预算(RiskBudgetPercent) 固定手数 最大手数 Magic number 订单注释 最大点差 每一行表格都有对应的 preset

Currency Pulse — MetaTrader 4 货币强弱排名面板 用途 Currency Pulse 在图表上的一个紧凑面板中,同时按多个时间周期显示当前哪些货币强、哪些货币弱。指标根据这一排名提示货币之间分歧最大的货币对:买入强势货币,卖出弱势货币。指标与所挂载图表的品种无关。 MT5 -version: https://www.mql5.com/en/market/product/200977
工作原理 所选货币会在每个已启用的时间周期上相互比较,并按从强到弱排列。彩色条表示波动幅度。 Total 列把所有时间周期合并为每种货币的一个综合得分。 Open chart 列从排名中挑选最有潜力的货币对(强势对弱势),并显示方向 buy 或 sell。点击该行即可打开图表。 使用方法 确认所选货币的品种已在报价窗口(Market Watch)中(例如 EURUSD、USDJPY、XAUUSD)。 将指标拖到任意图表上,等待几秒钟加载历史数据。 阅读面板:各列顶部的货币较强,底部的较弱。Total 列给出所有时间周期的整体情况。 在 Open chart 列查看当前最佳货币

AURA TRADING PANEL PRO MetaTrader 4 (MT4) 专用的终极超高速、简洁而强大的手动交易、网格矩阵与风险管理杰作
你是否经常为订单执行迟缓、错过入场时机、追踪止损延迟以及繁琐的手工风险计算而苦恼?在瞬息万变的黄金 (XAUUSD)、外汇、股指和加密货币交易世界中,每一毫秒都至关重要。如果你的交易终端拖了后腿,你实际上就是在白白流失利润。
认识 Aura Trading Panel Pro ——一款为 MT4 量身打造的革命性机构级交易助手,从底层架构精心优化,赋予你对图表的绝对、闪电般的掌控力。无论你是追求微小点数的剥头皮交易者,还是管理复杂多单矩阵的资深机构交易员,这款面板都能完美架起复杂数学执行与轻松一键操作之间的桥梁。
为什么选择 Aura Trading Panel Pro 以及它能带来哪些核心优势? 市面上的大多数交易面板要么充斥着拖慢终端的无用功能,要么过于简陋而无法应付专业的风险管理。 Aura Trading Panel Pro 通过以下核心优势彻底改变了游戏规则:
超高速且稳定的执行: 采用优化的 MQL4 代码

BoS and CHoCH Market Structure 直接在图表上标记市场结构:波段高点和低点、结构突破(BoS, Break of Structure)以及性质转变(CHoCH, Change of Character)。当某个波段点是其两侧所选数量K线中的最高点或最低点时,该波段被确认。当一根K线收盘突破最近的波段点时,指标会从该波段点到突破K线画一条线并加上标签:如果突破方向与当前趋势一致则为 BoS,与当前趋势相反则为 CHoCH。 功能 BoS(结构突破) - 收盘价沿当前趋势方向突破最近的波段点(趋势延续) CHoCH(性质转变) - 收盘价逆当前趋势方向突破最近的波段点(可能的方向转变) 以K线收盘价判断突破 - 仅用影线触及波段点不算突破 多空事件使用不同颜色 ;四种事件类型(看涨 BoS、看涨 CHoCH、看跌 BoS、看跌 CHoCH)均可单独开启或关闭 可调波段强度 - 每侧 2 到 50 根K线:数值越小事件越多,数值越大事件越少但更有意义 可选的突破K线上的 箭头 可选的波段上的 HH / HL / LH / LL 标记(每个波段与上一个同类波段比较)
FREE

Order Block Mitigation Tracker 会识别订单块(Order Block),并在图表上以彩色区域绘制。订单块是推动价格突破市场结构的那段走势的起始K线:看涨突破之前最低的那根K线,或看跌突破之前最高的那根K线。许多交易者把这些区域视为价格回到此处时可能出现反应的位置。指标会标出该区块,向右延伸,并跟踪价格对它的反应:在价格对其进行缓解(mitigation)之前,该区块保持开放。 功能 看涨区块 - 在被突破的摆动高点与突破它的K线之间,最低价最低的那根K线 看跌区块 - 在被突破的摆动低点与突破它的K线之间,最高价最高的那根K线 以K线收盘价判定突破 - 仅触及摆动点的影线不算突破 可选择由哪些突破生成区块 - 所有突破、仅CHoCH(逆势,可能的反转)或仅BoS(顺势) 区块大小 - 整根K线范围(最高到最低)或仅K线实体(开盘到收盘) 区块样式 - 填充或仅轮廓(多个区块重叠时,仅轮廓更方便) 三种缓解规则 - 影线穿过区块、收盘穿过区块或首次触及 已缓解的区块 - 要么在缓解它的K线处结束并变为暗灰色,要么从图表上消失 区块按所选的K线数量向右延伸 看
FREE

PRICE ACTION OB OB EA 是一款基于价格行为研究的出色自动交易系统!
交易理念基于著名的强大价格行为形态——外柱形态! 提供 7 个设置文件! D1 timeframe! No Grid!
下载用于测试和交易的EA设置文件: NZDCAD Set_file EURUSD Set_file USDCHF Set_file NZDUSD Set_file AUDUSD Set_file USDJPY Set_file AUDCHF Set_file 价格行为 OB EA 是一项非常好的投资——它将为您带来多年的收益,所有设置文件都具有正的数学期望值!
交易系统功能: - 系统不会像许多短线交易者那样收取高额佣金。 - 无严格的点差要求——EA 可用于任何账户。 - 系统不使用任何危险的网格交易方法。 - EA 默认内置复利资金管理功能。 - 每笔交易都设有止损 (SL) 和止盈 (TP),经纪商不可见。 - 止损和止盈是动态的,默认情况下会根据市场波动进行调整。 - EA 设置中提供补偿模式。 - 内置趋势和震荡指标过滤器。 - 也内置了动态追踪止损。

在合适的时间,把合适的EA挂到合适的图表上;它的时段结束时自动移除,并在同一步按Magic Number平掉它的持仓,全程无需触碰图表。Rotation Manager Console适用于您已有的EA,无需源代码,也不用改动EA本身:直接从图表把每个EA保存为配置,用时间窗口、重复和星期编写计划,面板就会替您轮换EA,支持英语、俄语、德语、西班牙语、法语、意大利语、日语、韩语、葡萄牙语、土耳其语和中文。 如需定制,请通过私信或评论留言联系我。 Rotation Manager Console是运行在独立图表上的控制面板。您可以把最多5个槽位绑定到已打开的图表,把最多10个EA保存为配置,并为每个槽位设置10行计划。一行可以在某个窗口内挂载配置,例如08:00至12:30,可以在一天内重复,可以只在选定的星期运行,也可以清空图表并平仓。替换由面板完成,您可以去做别的事。 它自己不交易,也没有自己的策略。它不会打开或关闭图表,也绝不会碰Magic Number不属于正在平仓的配置的任何交易。 独特之处 功能 价值 适用于您已有的任何EA 配置直接从图表保存,所以不需要源代码,也不用改动E

Pivot Points Classic and Camarilla 直接在图表上绘制经典枢轴点位(P、R1-R3、S1-S3)和 Camarilla 位(H1-H4、L1-L4)。这些价位根据所选时间周期(默认 D1)上一个周期的最高价、最低价和收盘价计算,每个周期都会在其适用的时间段上绘制一条水平线,因此您可以看到价格在之前的几天、几周或几个月对这些价位的反应。 功能 经典枢轴点 - 中心枢轴 P,以及三个阻力位(R1-R3)和三个支撑位(S1-S3) Camarilla 枢轴点 - 八个价位 H1-H4 和 L1-L4;H3/L3 和 H4/L4 绘制得更粗,因为这是 Camarilla 交易者最关注的价位;在经典模式中,枢轴 P 和外侧价位 R3/S3 更粗 经典、Camarilla 或两者同时显示 在同一图表上;经典线条为实线,Camarilla 线条默认使用虚线样式(线条样式可在输入参数中更改) 任意来源时间周期 - 日内图表上显示日线枢轴点,更大周期的图表上显示周线或月线枢轴点 过往周期历史 - 1 到 200 个周期,便于研究价格在这些价位附近的表现 价位根据上一个已收
FREE

VEXOR — 适用于 MetaTrader 5 的高级交易面板与风险管理工具 使用 VEXOR 掌控每一笔交易,这是一款专为重视精准、速度和更佳交易体验的交易者设计的现代化 MetaTrader 5(MT5)交易面板。通过直观的图形界面下达市价和挂单、计算仓位大小、管理风险,并设置止损和止盈水平。 MT5 Version 与传统交易面板僵硬的布局和过时的界面不同,VEXOR 将时尚的深色设计、交互式控制、实时价格信息、动态风险计算和直接图表交互整合到一个精简的工作空间中。 VEXOR 在 MetaTrader 5 中是什么? VEXOR 是一款先进的 MT5 交易面板,旨在简化手动交易并使订单配置更加直观。直接从图表上的单一界面管理手数、订单类型、风险设置、入场价、止损和止盈。 通过交互式控制和可视化订单验证,VEXOR 帮助您更高效地准备交易,同时将关键交易信息保持在触手可及的范围内。 VEXOR MT5 交易面板的核心功能 1. 现代深色界面 VEXOR 采用精心设计的深色用户界面,为传统 MetaTrader 交易面板提供现代化替代方案。 现代深色主题图形界面。 带悬停效果的
FREE

Fair Value Gap Fill Tracker 会识别公允价值缺口(Fair Value Gap,FVG,也称失衡区),并在图表上以彩色区域绘制。公允价值缺口是一种三根K线形态:第一根与第三根K线的影线互不重叠,因此中间那根K线留下了一段价格极快穿越的区域。指标会标出该区域,向右延伸,并跟踪价格对它的反应:在价格将其回补之前,该区域保持开放。 功能 看涨缺口 - 第三根K线的最低价高于第一根K线的最高价;区域位于这两个价位之间 看跌缺口 - 第三根K线的最高价低于第一根K线的最低价;区域位于这两个价位之间 以ATR(14)的倍数设定 最小缺口大小 - 在任何品种和周期上都会自动过滤掉细小、不重要的缺口 三种回补规则 - 影线穿过区域、收盘穿过区域或首次触及 已回补的区域 - 要么在回补它的K线处结束并变为暗灰色,要么从图表上消失 区域按所选的K线数量向右延伸 看涨与看跌区域使用不同颜色;每个方向都可以开启或关闭 每个区域上可选显示 FVG 文字标签 新区域的 提醒 :弹出窗口和/或推送通知(默认关闭);提醒仅针对实时图表上的新区域发送,不针对启动时加载的历史 适用于任何品种和任
FREE
Multi Timeframe Average True Range 可在您所操作的图表上显示任意周期的波动率(ATR),例如在 M1 图表上显示 M15 或 H1 的 ATR。您可以根据实际交易所用周期的波动率来设置止损、目标和过滤条件。 功能特点 在任意图表上显示所选周期的波动率(M1 至 MN1) 标准 ATR 或 NATR (截尾 ATR):在求平均之前舍弃最大的 True Range(或两端极值),因此单根新闻 K 线不会抬高数值 可选的第二条线显示标准 ATR,便于与 NATR 对比 “Closed bar only”模式:所选周期最后一根已收盘 K 线的值。该值在 K 线内部不会变化,也不会重绘 数值以价格单位(与标准 ATR 相同)或点数显示 防“拉伸”保护:如果图表周期大于所选周期,指标将按图表周期计算(可关闭) 自动加载所选周期的历史数据:在终端尚未使用过的品种上,窗口可能短暂为空,随后线条会自动出现,无需切换周期 轻量快速:数值按高周期 K 线缓存,计算的 K 线数量由参数限制 不进行交易,不使用 DLL、文件或网络请求 输入参数 Timeframe - 显示其波
FREE

GoldPulse AI Trader – XAUUSD黄金智能剥头皮EA ( 价格从 3,000 美元降至 30 美元。 ) 产品概述 GoldPulse AI Trader 是一款面向 MetaTrader 4 平台 XAUUSD(黄金)的自动交易系统。它结合多指标信号分析、趋势识别、动量评估和波动率过滤器,用于识别潜在的短线交易机会。 系统采用自适应评分机制,在考虑开仓之前评估市场状况。其交易逻辑旨在过滤质量较低的信号,并在市场环境变化时按照一致的规则管理交易。 主要功能 智能信号分析 结合 EMA、RSI、ADX、ATR、布林带、动量指标和 Parabolic SAR,评估市场方向及交易条件。 黄金剥头皮策略 主要面向 XAUUSD M1 时间框架,并允许用户调整入场过滤条件和交易管理参数。 自适应止损与止盈 根据 ATR 计算保护价位,使止损和止盈参考水平能够适应市场波动。 移动止损管理 当价格朝有利方向运行时,根据设定参数自动调整保护性止损。 市场保护过滤器 包括点差控制、异常价格波动检测、波动率保护,以及可配置的交易时段限制。 灵活的持仓管理 支持设置手数、最大持仓数量、

适用于 MT4 的“8 个交易品种 CCI ”外汇指标,无需重绘。 - CCI 是最受欢迎的交易震荡指标之一。 - 商品通道指数 (CCI) 衡量当前价格与历史平均价格之间的差异。 - 重要水平:+/-200。 - 非常适合在 +200 以上区域进行卖出操作,在 -200 以下区域进行买入操作。 - “8 个交易品种 CCI” 允许在一张图表上控制多达 8 个不同交易品种的 CCI 值。 - 此指标也非常适合与价格行动入场相结合。 ............................................................................. Click here to see high quality Trading Robots and Indicators! 这是仅在 MQL5 网站上提供的原创产品。

适用于MT4的加密货币外汇指标 “Micro M and Micro W patterns Pro” ,无重绘,无延迟。 - “Micro M and Micro W patterns Pro”指标是一款功能强大的价格行为交易指标。 - 该指标可检测图表上的Micro M和Micro W形态: - 看涨Micro W形态 - 图表上的蓝色箭头信号(见图)。 - 看跌Micro M形态 - 图表上的红色箭头信号(见图)。 - 内置PC和移动设备警报。 - “Micro M and Micro W patterns Pro”指标非常适合与支撑/阻力位结合使用。 - 可用于任何时间周期。 - 该指标是检测趋势变化或趋势修正结束的绝佳指标。 - 指标带有信息显示功能 - 显示所关联外汇货币对的当前点差和隔夜利息。 - 显示内容还包括账户余额、净值和保证金。 - 信息显示可以放置在图表的任意角落 . Click here to see high quality Trading Robots and Indicators! 这是仅在 MQL5 网站上提供的原创产品。

Trade Desk 是 MetaTrader 上的交易面板和交易管理器。在图表上规划入场,用手数计算器确定仓位,然后在同一面板管理持仓:止损、多个止盈、保本和移动止损。 附加说明: 模拟账户试用版 — MetaTrader 5 版 Trade Desk 多数图表工具只帮助下单。成交之后仍需要仓位管理器。 Trade Desk 把这两件事放在同一张图表上。拖动价位并实时看到风险回报比,从面板发送订单,再选中任意持仓进行修改,不必打开单独的下单窗口。发给经纪商的修改会保持为预览,直到按下「更新」,因此拖动线条不会意外改动持仓。 主要功能 图表上的交易面板: 快速 Buy 和 Sell,手数、固定金额风险和账户百分比风险,与价位表和持仓列表放在一起。 图表交易助理: 拖动入场、止损和止盈线。移动时面板显示价格、点数、金额和 风险回报比。 手数计算器: 固定手数、美元风险或账户百分比。仓位随止损距离变化。 多个止盈: 同一笔交易可放多个目标价,每个目标有自己的距离和 风险回报比。 目标达到后移动止损: 保持止损、移到保本,或在该级别到达后移到上一个止盈。 保本与移动止损: 价格走出设定距离后

适用于 MT4 平台的“移动平均线加速度”( MA Acceleration )加密货币/外汇指标,无重绘(No Repaint)。 MA Acceleration 是一款剥头皮(scalping)交易指标,旨在作为“MA Speed”(移动平均线速度)指标的辅助工具。 该指标基于物理学公式进行计算,用于显示移动平均线的加速度。 利用 MA Acceleration 指标,您可以升级现有的标准交易策略,从而发掘更多交易机会。它适用于 SMA(简单移动平均线)、EMA(指数移动平均线)和 LWMA(线性加权移动平均线)。 MA Acceleration 本质上是相应移动平均线的二阶导数。 该指标反映了 MA Speed 指标数值的变化速率。 当 MA Acceleration 指标值 < 0 时,表示移动平均线在看跌方向上加速;当 MA Acceleration 指标值 > 0 时,表示移动平均线在看涨方向上加速。 建议将 MA Acceleration 指标与 MA Speed 指标结合使用,针对主趋势方向进行快速剥头皮交易:若 MA Speed 指标值 < 0,则趋势向下;若 MA
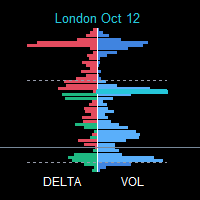
SessionFlowMap — 多时段成交量与Delta分布图(含POC关键位) SessionFlowMap 为外汇交易日的各个交易时段(亚洲、伦敦、纽约,另可选悉尼和自定义时段)生成成交量分布图和Delta分布图(买卖失衡)。对于每个时段,指标会找出 POC(控制点,即成交量最大的价格)和价值区域 Value Area(VAH 与 VAL,容纳大部分成交量的区间),并把这些水平位以水平线的形式向右延伸。你可以一眼看出市场在每个时段把时间和资金花在了哪里,以及哪些价位可能再次变得重要。 MT5-version: https://www.mql5.com/en/market/product/200942
工作原理 每个时段按各自的时间从 M1 历史数据中截取。亚洲、伦敦、纽约和悉尼的时间以 GMT 设置,并自动换算为经纪商服务器时间;自定义时段直接使用服务器时间。 时段的价格区间被划分为若干价格行(目标行数由你设置),成交量分配到各行。外汇没有集中式成交量,因此使用的是 Tick 成交量。 成交量分布图是每一行的总成交量;Delta 分布图是每一行的买入量减去卖出量(绿色表示买方

Gold Swing Trend – 自动化的纪律性黄金交易
黄金波动迅速。大多数交易者亏损,并不是因为看错了市场,而是因为入场太晚、风险过大,或在关键时刻犹豫不决。Gold Swing Trend 正是为消除这些错误而打造的。它替您盯盘 XAUUSD,耐心等待黄金出现真正动能的时刻,并在每一笔交易中保持同样的纪律。
为什么交易者选择 Gold Swing Trend
专为黄金打造。Gold Swing Trend 不是从货币对移植过来的通用机器人。它围绕 XAUUSD 的速度和波动性而设计,开箱即为黄金优化。
耐心,而不是过度交易。本 EA 不会为了交易而交易。它将动能信号与多层市场过滤相结合,避开横盘、震荡和方向不明的行情,只在市场坚定运行时才出手。
聪明入场,不追价。Gold Swing Trend 不会在最差的价格追入,而是通过挂单争取在回调时入场,挂单会根据最新价格行为持续调整,直到成交。
每笔交易都有保护。每个持仓从开仓的第一刻起就设置了止损和止盈。止损根据市场结构设定,而非随意距离,盈亏比完全由您掌控。
基于风险的自动仓位计算。告诉 EA 每笔交易愿意承

Eagle Queen 是一款用于黄金(XAUUSD)的多策略 EA。它运行 9 个独立策略,每个策略将其交易作为一个篮子管理,并设有止盈和保护性止损。 Eagle Queen 是网格系统:篮子可以在固定的价格间距逆势加仓,始终使用 相同手数 (无马丁格尔,手数从不增加)。每个篮子都有保护性止损,可按金额或最大层数设置。 实盘记录 Eagle Queen 在我们的 IC Markets 真实账户上交易,与我们的其他智能交易系统一起运行。 我们所有的实盘信号: Financial Freedom Signals . 我们的商店: Financial Freedom Shop . 主要特点 9 个策略,可逐个开启或关闭 网格每一层使用相同手数:无马丁格尔,无手数倍增 每个篮子都有保护性止损(金额止损或最大层数) 手数计算:固定手数、资金阶梯或按篮子止损的风险百分比 每月第一个星期五(非农)和星期五晚间不开新篮子;可选的美元高影响新闻过滤和年末暂停 图表面板显示每个策略的状态 我们的测试方式 回测使用 2008 年以来 100% 真实报价,每笔交易都扣除佣金、滑点和隔夜利息。图片显示的是基于

MQLTeam Currency Power 把两种货币放在同一张图上,并显示哪一种更强。每种货币有自己的一篮子货币对。指标窗口里的柱状图是两个篮子之间的差,表格则显示是哪一个货币对造成了这个差。现成的例子是欧元对美元。改两个名称和货币对列表后,读法对任意两种货币都一样。 另有版本: MetaTrader 5 版 MQLTeam Currency Power 数值以点为单位。默认测量的是快慢两条移动平均之间的距离。如果想更快地看,还有两种直接按 K 线计算的方法。同一个指标用于 MetaTrader 4 和 MetaTrader 5。 如何阅读 表格每一行把第一列的一个货币对和第二列对应的货币对放在一起。正数表示该货币在这一行更强。 Gap 是货币 1 的强度减去货币 2 的强度。差为负,表示货币 2 更强。差为正,表示货币 1 更强。 可以这样读:EUR −11,USD +17,Gap −28。美元更强,差就是领先的幅度。底部一行是整个篮子的平均值。底部的差为负,表示货币 2 在篮子里更强。为正,表示货币 1 更强。 指标窗口里的柱子显示这个差随时间的变化。绿色表示差在上升,也就是货

ValueOrbit 显示当前周期的“公允价格”所在位置,以及市场偏离它的程度。这是一个背景分析工具:它绘制中心线 Value Core,并在其周围绘制三对“轨道”(±1σ、±2σ、±3σ),面板则显示价格被拉伸的程度。本指标不提供入场信号。 MT5-version: https://www.mql5.com/en/market/product/201292
工作原理 Value Core 是一条参考线,从每个周期(交易日、周或月)开始时逐步形成,新周期开始时重新开始。轨道标出距该线的标准距离,单位为 σ。价格越靠近中心线,市场越均衡;离得越远,拉伸越大。周期切换时线条会断开,避免出现垂直跳跃。 使用方法 将指标加载到图表,并根据交易风格选择 Value Anchor:日内交易(M1–H1)选 Session,波段交易(H1–H4)选 Week,H4–D1 选 Month。 判断背景:价格在 Value Core 上方说明买方占优,下方说明卖方占优。 价值回归:在震荡行情中,价格走到 ±2σ 及以外后,常会向中心线回落。请用您自己的入场方法确认。 顺势交易:趋势中价格通常停留在中心

AI ZONE RADAR — 用价格区域查看支撑与阻力 请选择与平台对应的版本 此页面为MT4版,另有MT5版可选。 查看MT5版商品 MT4版和MT5版是独立Market商品,本次购买仅包含所选平台的版本。 在判断信号之前,也看清价格位置 出现买入信号时,上方是否紧邻阻力?看到回调时,附近的支撑在哪里?增加更多水平线并不一定让这些问题更容易判断。AI ZONE RADAR 将附近价格区域及其相对强度集中呈现,帮助您先确认信号所处的位置。 AI ZONE RADAR 是 MetaTrader 4 图表分析指标。面板、状态信息和提示支持Market全部11种语言,可自动或手动切换。 English / Russian / Chinese (Simplified) / Spanish / Portuguese / Japanese / German / Korean / French / Italian / Turkish 水平线周围的区域、1至5级相对强度以及不同线宽,帮助您查看重要价格位置。面板集中显示品种、周期、附近支撑与阻力、距区域的点差距离(pips)、当前状态及方向倾向。强度

Crypto_Forex 指标 HTF DeMarker 适用于 MT4。 - 该指标是技术交易者用来寻找入场点和出场点的有用工具。HTF 表示 - 更高时间框架。 - DeMarker 振荡器线指示当前价格相对于之前高点和低点的位置。 - DeMarker 提供其他振荡器中最有效的常规发散信号。 - 当 DeMarker 高于 0.7 时为超买区域,当 DeMarker 低于 0.3 时为超卖区域。 - 指标具有内置移动和 PC 警报。 - 该指标非常适合具有价格行动条目或与其他指标结合使用的多时间框架交易系统。 - HTF DeMarker 指标允许您将更高时间框架的 DeMarker 附加到当前图表 --> 这是专业的交易方法。 Click here to see high quality Trading Robots and Indicators! 它是仅在此 MQL5 网站上提供的原创产品。

Crypto_Forex MT4 上吊线指标“上吊线形态”,无需重绘,无延迟。 .............................................................................. - “上吊线形态”指标是价格行为交易的强大指标。 - 指标可检测图表上的看跌上吊线形态:图表上显示红色箭头信号(见图)。 - 支持 PC、手机和电子邮件提醒。 - “上吊线形态”指标非常适合与支撑/阻力位结合使用。 ............................................................................. Click here to see high quality Trading Robots and Indicators! 这是仅在 MQL5 网站上提供的原创产品。

外汇指标“INFO 价差掉期显示”适用于 MT4,交易辅助工具。 ....................................................................... - INFO 价差掉期显示指标显示其所附外汇对的当前价差和掉期。 - 它还显示账户余额、净值和保证金。 - 可以将指标值定位在图表的任何角落 . - 也可以设置颜色和字体大小。 ............................................................................ Click here to see high quality Trading Robots and Indicators! 这是仅在 MQL5 网站上提供的原创产品。

反超短线交易者专业版EA——一款基于最新价格行为研究的高级自动交易系统!
交易理念基于价格行为!提供6个预设文件!D1时间框架!
下载EA预设文件进行测试和交易: NZDCAD Set_file CHFJPY Set_file EURGBP Set_file GBPJPY Set_file CADCHF Set_file AUDCHF Set_file 反超短线交易者专业版是一项非常不错的投资——它将为您带来多年的收益,因为所有预设文件都具有正的数学期望值!
EA功能: - EA可同时运行6个货币对。 - 每笔交易都旨在追求可观的利润——这完全不是超短线交易策略。 - 系统不会像许多超短线交易者那样浪费资金支付佣金。 - 无严格的点差要求——EA适用于任何账户。 - 系统不使用任何危险的网格交易策略。 - EA 默认内置复利资金管理功能。 - 每笔交易都设有止损 (SL) 和止盈 (TP),经纪商不可见。 - 止损和止盈是动态的,默认情况下会根据市场波动进行调整。 - EA 设置中提供补偿模式。 - 交易货币对:NZDCAD、CHFJPY、EURGBP、GBPJPY、CADCF

欢迎使用 Golden Scalper Pro! 适用于 MetaTrader 4 的精准剥头皮系统。它仅在您选择的交易时段内运行,其余时间不进入市场。
专为快速、流动性高的品种设计。所有操作均通过图表上的一个菜单完成,几分钟即可完成设置。
为获得最佳表现,需要使用原始点差 / ECN 账户。在使用真实账户之前,请务必先在模拟账户上测试。
注意: 点差很重要。点差较大或波动较大的经纪商,其结果会与您在测试中看到的结果不同。
主要功能: 非常易于使用:附加到图表后,会自动加载适合您品种的预设 内置 XAUUSD、USTEC / NAS100 和 GER30 / GER40 预设 挂单或市价模式 固定手数或按风险百分比计算手数 交易时段控制及每小时订单数量限制 图表上的绩效面板 支持 11 种语言的全屏设置菜单 为每个交易品种保存和加载您自己的预设 要求: 项目 详情 品种 XAUUSD, USTEC / NAS100, GER30 / GER40 时间周期 H1 账户 原始点差 / ECN 连接 建议使用 VPS
回测: 请在受支持的品种上运行。策略测试器中会自动加载该

Break and Retest Hunter MT4 is a powerful MetaTrader 5 indicator designed to automatically identify support and resistance levels, breakout structures, and potential retest opportunities in real time. Bonus Indicator: After purchasing Break and Retest Hunter , contact me to receive Trade Indicator Assistant EA completely free as a bonus utility.
$65 for the next 10 copies . Next price is $120. Combining adaptive market analysis, clear BUY/SELL signals, Fibonacci-based profit targets, and a pre

KT Support Resistance EA trades bounces only from the support and resistance levels where price has reversed its direction many times in the past. Every level carries a Reversal Chance: out of all the times price reached that level, the share of times it reversed instead of breaking through. The EA trades a bounce only when the Reversal Chance is high. Each trade opens with a stop loss beyond the zone and a take profit at the next opposing level. Five tested settings built in Choose JP225 M30, J

親愛的朋友們,大家好!
今天,我向大家隆重推出終極智慧交易系統(EA)-凝聚了超過20年交易經驗的結晶。這款EA是市面上最優秀的,獲利率高達97%以上。它擁有多種演算法,並能有效抵禦高點差和新聞波動的影響。建議搭配低點差帳戶使用,以最大化獲利。數量有限,欲購從速!購買前可先試用,終身有效。
關於運行EA的重要提示:請更改以下設定:
(價格偏移量 = 50)
數量非常有限。
初始價格 349 美元
第二價 649 美元
第三價 949 美元
第四價 1299 美元
第五價 1499 美元
第六價 1799 美元
第七價 1999 美元
第八價 2499 美元
第三價 2999 美元
推薦設定
關於運行智慧交易系統的重要提示:
請更改此設定(價格偏移 = 50)
歐元兌美元
差價:0.1 至 0.2,最大 0.9
帳戶類型:Raw/ECN
時間週期:H4
資金:200 美元
請更改此設定(價格偏移 = 50)
這是一個運作方式複雜、波動性極低的系統。

Correlation Radar PRO — MetaTrader 4 专业多资产相关性仪表盘 简短描述: 快速过滤市场噪音,秒级捕捉品种价格背离。Correlation Radar PRO 实时计算多资产在历史、月度、周度及当前周期的相关性,并支持将其他品种 K 线直接叠加至主图表,无需频繁切换品种。 完整描述: 频繁切换图表来判断市场联动不仅耗时,更易错过最佳进场时机。 Correlation Radar PRO 为您提供专业的跨市场分析仪表盘,将多资产联动动态直接集成于 MetaTrader 4 图表中。在 4 个维度(历史 500 棒、24 个月、52 周、当前 30 棒)下精确度量品种间关联度,助您在相关性增强或破裂时抢先捕捉高概率交易契机。 Correlation Radar PRO 的核心优势: 热力图直观视觉: 智能色彩矩阵,瞬间识别强正相关、中度相关或强负相关。 相关性动态趋势指示: 实时提示跨市场关联是在增强、减弱还是保持稳定,为交易决策提供可靠依据。 一键图表 K 线叠加: 点击面板中的任意资产,即可将其 K 线同屏叠加至主图表,无需改变原图表品种即可直接对比走

ULTIMA HYBRID GOLD V2 (XAUUSD) “专为黄金(XAUUSD)打造的终极机构级混合交易系统。”
1. 简介与策略概览 Ultima Hybrid Gold v2 是一款专为黄金(XAUUSD)M5 时间周期设计的高级高性能智能交易系统(EA)。该 EA 结合了机构级“聪明钱概念”(SMC)——如订单块(OB)、溢价/折价区间(Premium/Discount Arrays)以及来自 H1/H4 周期的流动性扫荡(Liquidity Sweeps)——并辅以多层算法风险管理机制。
与那些让账户面临无限风险的标准网格或马丁格尔(Martingale)机器人不同,Ultima Hybrid Gold v2 采用智能对冲回撤修复与动态篮子平仓系统,并配备自动回撤控制及重大新闻过滤功能。
️ 2. 核心功能与交易机制 多策略入场模式:支持多种信号过滤组合,包括 EMA 交叉 + RSI、动态 ATR 波动率过滤、纯粹的 K 线吞没形态(Engulfing)及随机指标(Stochastic)回调,此外还包含高准确度的“大信号”(H1 狙击手)模块。

免费。设置风险,点击 Buy 或 Sell,搞定。 TrueRisk Trade Panel 为您计算手数。输入您想用账户的多少比例承担风险(例如 1%),以点数设置止损或在图表上拖动止损线,BUY 和 SELL 按钮就已经显示正确的手数。无需手数计算器,无需猜测,不会出现风险比预期大十倍的交易。 TrueRisk Account Dashboard MT4(免费) | TrueRisk Symbol Changer MT4(免费) | MT5 版本 | 所有 TrueRisk 工具 新品(免费):自动保存每一笔交易的图片。 TrueRisk Trade Journal MT4 在交易开仓和平仓时各保存一张图表图片,图上写有交易数据,并把每笔已平仓交易连同其 R 记入表格。 根据风险计算手数:余额百分比、净值百分比或固定金额(例如 50 美元) 以点数设置止损,或自动设置(1.5 x ATR) 止盈为风险的倍数(2 = 风险的两倍) 在图表上拖动止损线和止盈线:拖动时手数实时更新 从入场线挂单(自动选择限价单或止损单) 平一半、平掉本品种、全部平仓、将止损移至保本 适用于任何账户、任何
FREE

大多数 FVG 指标只会画方框。这个指标还会检验这些方框是否真的有效。 ICT Fair Value Gap FVG Honest Stats 在图表上绘制每一个公允价值缺口(FVG),并基于该图表自身的历史统计价格回到缺口的频率以及缺口守住的频率,并与同样大小的假方框对比。免费,属于 Honest Stats 系列。 MT5 版本 | ICT Killzones Honest Stats MT4(免费) | ICT Liquidity Levels Honest Stats MT4(免费) | ICT SMT Divergence Honest Stats MT4(免费) | TrueRisk Trade Panel MT4(免费) 新品(免费):反转公允价值缺口(IFVG),附回测信号和提醒 -> ICT Inversion FVG Honest Stats (被价格收盘穿越的缺口,回测箭头,同样的诚实统计表) 新品(免费):Silver Bullet 时间窗口,附扫荡 + FVG 信号和提醒 -> ICT Silver Bullet Honest Stats (伦敦、纽约上午和下
FREE

大多数流动性指标只会画线。这个指标还会检验价格是否真的尊重这些线。 ICT Liquidity Levels Honest Stats 绘制 ICT 交易者关注的价位:前一日高点和低点、前一周高点和低点,以及亚洲盘区间的高点和低点。表格在您自己的图表上统计价格到达每个价位的频率以及在那里反转的频率,并与附近的随机线对比。免费,属于 Honest Stats 系列。 MT5 版本 | ICT Killzones Honest Stats MT4(免费) | ICT FVG Honest Stats MT4(免费) | ICT SMT Divergence Honest Stats MT4(免费) | TrueRisk Trade Panel MT4(免费) 新品(免费):反转公允价值缺口(IFVG),附回测信号和提醒 -> ICT Inversion FVG Honest Stats (被价格收盘穿越的缺口,回测箭头,同样的诚实统计表) 新品(免费):Silver Bullet 时间窗口,附扫荡 + FVG 信号和提醒 -> ICT Silver Bullet Honest Stats
FREE

大多数 Killzone 指标只会画方框。这个指标还会检验这些方框是否真的有效。 ICT Killzones Honest Stats(MetaTrader 4 版)绘制 ICT 的四个 Killzone(亚洲盘、伦敦开盘、纽约开盘、伦敦收盘),并在您自己的图表上统计当日最高价或最低价真正出现在每个区间内的频率,与纯随机情况对比,同时统计伦敦 Judas swing 真正反转的频率。免费,属于 Honest Stats 系列。 MT5 版本 | ICT FVG Honest Stats MT4(免费) | ICT Liquidity Levels Honest Stats MT4(免费) | ICT SMT Divergence Honest Stats MT4(免费) | TrueRisk Trade Panel MT4(免费) 新品(免费):反转公允价值缺口(IFVG),附回测信号和提醒 -> ICT Inversion FVG Honest Stats (被价格收盘穿越的缺口,回测箭头,同样的诚实统计表) 新品(免费):Silver Bullet 时间窗口,附扫荡 + FVG 信
FREE

大多数 SMT 指标只会标出背离。这个指标还会检验它们是否真的有效。 ICT Correlation SMT Divergence Honest Stats 将您的图表与相关市场对比(黄金对白银、EURUSD 对 GBPUSD、BTC 对 ETH、US500 对 US100),并标出每一个 SMT 背离。表格在您自己的图表上统计 SMT 之后价格反转的频率是否高于普通新高或新低之后的反转频率。免费,属于 Honest Stats 系列。 MT5 版本 | ICT Killzones Honest Stats MT4(免费) | ICT FVG Honest Stats MT4(免费) | ICT Liquidity Levels Honest Stats MT4(免费) | TrueRisk Trade Panel MT4(免费) 新品(免费):反转公允价值缺口(IFVG),附回测信号和提醒 -> ICT Inversion FVG Honest Stats (被价格收盘穿越的缺口,回测箭头,同样的诚实统计表) 新品(免费):Silver Bullet 时间窗口,附扫荡 + FVG 信
FREE

使用手册 将您的交易复制到每个账户,MT4 和 MT5 均可,每个账户按自己的风险计算手数 TrueRisk Trade Copier 在同一台电脑或 VPS 上的 MetaTrader 4 终端之间、以及 MetaTrader 4 与 MetaTrader 5 之间(配合 MT5 版本)复制交易:从您交易的账户复制到您的其他账户、自营交易公司挑战账户,或从个人账户复制到资金账户。每个接收账户根据发送方的止损,按自己的风险百分比计算每笔复制交易的手数,并且绝不让复制交易的止损突破该账户的每日或最大亏损限额。 MT5 版本 | 如何复制交易(指南) | TrueRisk Trade Panel MT4(免费) 一个 1 万和一个 20 万的账户复制同一笔交易,各自承担相同百分比的风险 MT4 到 MT4、MT4 到 MT5 以及 MT5 到 MT4:MT4 和 MT5 版本使用同一个频道(每个平台需要各自的版本) 止损和止盈的修改、部分平仓和平仓都会同步(MT5 实盘测试:复制交易在 0.5 秒内开仓和平仓) 每个接收端都运行完整的 TrueRisk Account Guard Pro

使用手册 TrueRisk Account Guard Pro 监控您的整个 MetaTrader 4 账户,在自营交易公司的亏损限额被突破之前介入。除了每日和最大亏损限额之外,它还限制每笔交易的亏损、为缺少止损的交易补上止损、限制交易量,并在周末前平掉所有仓位。 公司预设:FTMO 2-Step、FTMO 1-Step、FundedNext Stellar 2-Step、The5ers High Stakes,或您自己的规则 按公司所在时区每日重置(布拉格、纽约、UTC 或服务器时间),自动处理夏令时 单笔亏损上限,并为未设止损的交易自动添加止损 与 MT5 版本相同的保护功能,已在 MT4 实盘图表上测试 MT5 版本 | TrueRisk Trade Copier MT4 | TrueRisk Trade Panel MT4(免费) 您需要哪一个? TrueRisk Account Guard Pro :另外还有公司预设、单笔亏损上限、自动止损、交易次数限制和周五平仓。 TrueRisk Trade Manager :包含 Guard Pro 的全部功能,外加一键交易面板:根据风

使用手册 TrueRisk Trade Manager 是一个适用于 MetaTrader 4 的一键交易面板。您设置风险百分比和止损;面板计算手数,检查止损不会让您突破每日或最大亏损限额,然后开仓并为您管理交易:部分平仓、保本和移动止损。 根据风险百分比计算手数,并削减到距离亏损限额所剩的空间之内 以 R 为单位自动执行部分平仓、保本和移动止损 为您在手机上开的交易设置止损和手数 完整的 TrueRisk Account Guard Pro 引擎保护整个账户,带自营交易公司预设 MT5 版本 | TrueRisk Account Guard Pro MT4 | TrueRisk Trade Copier MT4 | TrueRisk Trade Panel MT4(免费) 您需要哪一个? TrueRisk Account Guard Pro :另外还有公司预设、单笔亏损上限、自动止损、交易次数限制和周五平仓。 TrueRisk Trade Manager :包含 Guard Pro 的全部功能,外加一键交易面板:根据风险计算手数、保本、部分平仓和移动止损。 底层运行的是 TrueRi

AbouAminALG02_v5 Overview:
An advanced automated trading system designed to capture market opportunities with high precision. The EA operates by integrating proprietary trend indicators and sophisticated digital filters to pinpoint accurate entry and exit levels. It features a flexible money management system and an intelligent grid martingale mechanism to optimize trade execution, ensuring maximum efficiency in both trending and ranging markets. · Optimal Performance: The default sett

TradeDeck is a trade assistant and trading panel for manual trading: a lot calculator, risk management and one-click order placement from the chart. You set the risk and place three lines on the chart; the panel calculates the volume, sends the order and then takes care of the routine management: breakeven, trailing stop and partial close.
Placing a trade from the chart Press Lines (or Shift+L) and three lines appear on the chart: entry, Stop Loss and Take Profit. Each line has a label with th

SMC Super position - Smart Money Structure & Liquidity Intelligence Professional multi-module market structure, liquidity and trade-planning indicator for MetaTrader 5, designed to combine structural analysis, liquidity behavior, trend context and confirmed signal logic in one compact workspace. The system includes Smart Money structure tools, an independent Master Signal engine, Confluence setups, Scalping analysis, Queen Trend context, multi-timeframe routing and an integrated Signal History d

ATR Stops 是一个 判断振幅大小的MT4 指标,用它会协助你判断止损、止盈应该放的位置,避免过大止损造成的损失或者过大止盈造成的利润回撤,一个很实用的指标。 他的主要功能 一行数据面板,它告诉你振幅的大小 一条止损辅助定位线,方便你快速拉止损线 一条止盈辅助定位线,方便你快速拉止盈线 参数 ATRPeriod - ATR 平均周期(默认 14) SLmult - 止损宽度 = SLmult × ATR(默认 1.5) TPmult - 止盈宽度 = TPmult × ATR(默认 2.0) FontSize - 标签字号,单位磅(默认 10) TagOffsetBars - 线上标签从最后一根 K 线右侧第几根开始(默认 3) SLColor - SL 线颜色(OrangeRed) TPColor - TP 线颜色(LimeGreen) 使用方法 把指标添加到图表上,在参数面板里调整各项。如果已经清楚自己习惯的 ATR 倍数,直接设置 SLmult 和 TPmult 即可。线上的标签实时显示点数距离,角落标签一眼可见同样的数值。
FREE

时区时钟是一个小巧的 MT4 指标,看它一眼就能回答一个问题:经纪商时间转换成我的本地时间是多少? 它在图表上是这样的 LOCAL 23:58:43 | SERV 15:58:43 | 10-02 SERV 是终端服务器时间, LOCAL 是你自己的时钟,末尾的 MM-DD 是服务器日期。当你准备用本地时间去描述交易或者选择一段时间进行交易时,这个小工具很有用。 功能 本地时间 服务器时间 服务器日期 时间精确到秒 文本颜色和字体大小都是可以根据自己的喜好进行调节的 显示的时钟可以用鼠标左键抓取并移动到任何地方 参数
LocalOffsetHours - 要加到服务器时间上以得到本地时间的小时数
ShowSeconds - true 显示 hh:mm:ss,false 显示 hh:mm
ShowDate - 在末尾附加服务器日期,格式为 MM-DD
TextColor - 文本颜色(clrWhite)
FontSize - 字体大小,单位为磅(11)
ScreenCorner - 0 左上,1 右上,2 左下,3 右下
X_Distance - 距角落的水平偏移,单位
FREE

ZZ Impulse PRO is an authoring toolkit for reading market structure: two independent fractal ZigZags, Classic and Impulse/Correction modes, non-standard period candles, and full panel control — on a single chart. Concept The market speaks on both lower and higher scales at once. A typical ZigZag often keeps only one of those voices. ZZ Impulse PRO delivers controlled structure : two markups with separate settings, two ways to read waves, a flexible multiplier, and HTF/synthetic candles overlaid

Bar Countdown 是一款标识K线大小以及多久会结束的 MT4 指标,它是高频交易或者是炒短线交易中经常用到的一个实用工具。 它的核心功能有三个: 倒计时(Time) ——当前这根 K 线距离收盘还剩多少时间,每秒跳动,让你精确掌握"还有几秒换线",为平仓或者是开仓提供信息支持。 K线振幅(Bar) ——当前这根 K 线从最高到最低的振幅,交易者判断K线的大小不再是通过肉眼观察K线的大小,而是真实的数据描绘。 点差(Spread) ——显示当前品种的实时点差,为是否开仓提供信息支持。 它的特点 只显示、不下单 :纯指标,零交易逻辑,绝不替你开仓/平仓。 贴着价格走 :文字自动贴在当前实时买价(Bid)那条线上,价格动它就跟着动,永远在你视线范围内。 整组拖动 :鼠标可以水平方向拖动它的位置。 自由设置 :可以自己设置字体颜色/大小。
FREE

WPR MTF shows Williams Percent Range for the current chart and optional higher or lower timeframes in a single subwindow. Features Up to 8 %R lines at once (Chart, M1–MN) Adjustable period, colours, styles and widths Classic levels at −20 and −80 Optional text panel with latest values (off by default) How to use Attach to any chart. Enable the timeframes you need (e.g. Chart + H1 + H4). Watch overbought / oversold zones together across timeframes. Note
This is an analytical tool, not an auto-tr
FREE

WaveForce PSAR MTF plots Parabolic SAR calculated on a timeframe you choose and maps it onto the chart you are viewing. Features SAR from Chart, M1, M5, M15, M30, H1, H4, D1, W1 or MN1 Adjustable acceleration step and maximum Colour, size and arrow code for dots Two display modes: fill every chart bar (default) show dots only on the open of the SAR timeframe How to use Attach to any chart. Select the SAR timeframe (e.g. H1 on an M15 chart). Fine-tune step / maximum if needed. Note
This is an an
FREE
MetaTrader市场是 出售自动交易和技术指标的最好地方。
您只需要以一个有吸引力的设计和良好的描述为MetaTrader平台开发应用程序。我们将为您解释如何在市场发布您的产品将它提供给数以百万计的MetaTrader用户。
