适用于MetaTrader 4的新EA交易和指标 - 243

NC Crazy Line EA 是一个基于RSI以及移动平均线设计的自动下单系统。 当移动平均线和RSI发生短线突破信号时进行下单。 若发生虚假突破,则会根据设置的StopLoss参数进行补仓。 自行设置止损范围,风险更加可控
可灵活设置风险等级,当然了,风险与利润往往是成正比的。 最低资金要求:1000$,但我建议最好不要低于2000$
参数 MoneyManagementType:资金管理模式 Risk:资金风险的百分比 Lots:订单手数(MoneyManagementType=Fixed时有用,仅第一个订单有效,后续订单仍然会按照LotFactor增加仓位) MagicNumber:订单的ID LotFactor:补仓的手数因子 TakeProfit:获利点数(pips),必须大于0 StopLoss:进行补仓的亏损点位(pips) MaxOrder:最大订单数量 StopPercentage: 强制止损资金百分比
设置 当MoneyManagementType设置为Auto时,将按照Risk自动设置订单手数 当MoneyManagementType设置为Fixe

The Indicator automatically draws trend lines ( Support & Resistance Lines) when attached to any opened chart with any time frame. Button controls with on(green)/off(red) are provided to display the Support & Resistance lines of short, medium, long, very long, v.v.long trends. For ex: to display only short, long term trend lines, make sure that the short and long buttons are in green color and the remaining 3 buttons in red color.
Indicator builds the following historical month levels: Resistance Levels — a price level above which it is supposedly difficult for a security or market to rise: R3 Month — monthly resistance price #3; R2 Month — monthly resistance price #2; R1 Month — monthly resistance price #1; Support Levels — a price level below which it is supposedly difficult for a security or market to fall. S1 Month — monthly support line price #1; S2 Month — monthly support line price #2; S3 Month —

This indicator draws Horizontal Support and Resistance automatically. It works with any symbol and any timeframe. Stronger Support Lines are displayed in thicker green horizontal lines. In the same way, Stronger Resistance lines are displayed with thicker red lines. Change the timeframe to display the Support and Resistance Lines of various timeframes.
Indicator builds the following historical week levels: Resistance Levels — a price level above which it is supposedly difficult for a security or market to rise: R3 Week — weekly resistance price #3; R2 Week — weekly resistance price #2; R1 Week — weekly resistance price #1; Support Levels — a price level below which it is supposedly difficult for a security or market to fall. S1 Week — weekly support line price #1; S2 Week — weekly support line price #2; S3 Week — weekly s

IdeaIlan expert system applies IdeaTrend indicator. The EA applies the martingale principle. The EA allows trading in two directions simultaneously. It also has a full set of tools allowing the EA to follow a trend and add to a position if the trend moves in unfavorable direction. The EA correctly handles errors and reliably works with a deposit of 10 000 USD and higher. M5 and higher timeframes are supported. Stop levels and trailing stop are applied.
Parameters Magic - magic number; Requotes
Indicator builds the following historical day levels Resistance Levels — a price level above which it is supposedly difficult for a security or market to rise: R3 Day — daily resistance price #3; R2 Day — daily resistance price #2; R1 Day — daily resistance price #1; Support Levels — a price level below which it is supposedly difficult for a security or market to fall. S1 Day — daily support line price #1; S2 Day — daily support line price #2; S3 Day — daily support line price #3; Extremes Level

This indicator is designed for monitoring RSI levels on the current and higher timeframes. The control panel is user friendly and consists of buttons, with which you can control the display of lines as per the names of the buttons. The button color matches the line color.
Parameters "___| Settings of the main indicator " RSI Period - averaging period for index calculation (default is 14); RSI Price type - price used for calculations (default is the Close price); "___| Color palette " Text colo

Fractal is one of the main indicators in a number of strategies. Volume Fractals has expanded the functionality of the standard indicator version. The product features fractals sorting and displaying fractals representing both price and volume extreme points.
Application Stop losses Reversal signals Placing pending orders for a fractal breakout
Options Bars of history - number of chart bars the indicator is displayed for Left side minimum bars - minimum number of bars to the left of the frac
FREE

The indicator analyzes the change in the minimum and maximum prices of the previous bars fixing the entrance of the big players. If the change (delta) increases, a signal is displayed on the graph in the form of an arrow. At the same time, virtual trade on history is carried out. In the free version, virtual trade is performed without refills in case of a repeat of the signal. The results of virtual trading in the form of losses / losses, profitability, drawdown and transaction lines are display
FREE
Daily Average Retracement Dashboard is an indicator that allows you to monitor multiple currency pairs at one time. This indicator is mainly for strategies that trade price retracement based on Resistance 3/4 or Support 3/4. After applying this indicator to the chart window, it will hide the chart and display the currency pairs in a table form. There are several data shown on the table that will help trader know when to analyze the currency and do trade using retracement. The indicator will only
FREE

The Adaptive Moving Average (AMA), created by Perry Kaufman, is a moving average variation designed to have low sensitivity to market noise and volatility combined with minimal lag for trend detection. These characteristics make it ideal for identifying the overall market trend, time turning points and filtering price movements. A detailed analysis of the calculations to determine the AMA can be found in MetaTrader 5 Help ( https://www.metatrader5.com/en/terminal/help/indicators/trend_indicators
FREE

This non-indicator trading strategy searches for the candles having wicks exceeding the candle body. The strategy is somewhat similar to trading by Pin Bar pattern. The EA buys when the lower wick exceeds the candle body and the upper wick. The minimum candle body size is set as % of ATR.
The EA works by a new bar open prices, so that test/optimization results are as close to real trading as possible. The EA applies dynamic order placement levels, stop loss, take profit and trailing stop level

Multicurrency trend advisor. Analyzes and trades up to 300 trading instruments simultaneously. Always follows the trend. 4 timeframes are taken for analysis: W1, D1, H4, H1. The main trend is determined by the highest selected timeframe (W1, D1, H4 - selected by a trader in the settings). Transactions open with a signal on H1. Closing orders takes place by take profit or by chains, when the specified profit of the chain is reached (specified in the settings).
Parameters LotSize - base trade lo

Carousel expert system compensates drawdowns. The main indicator is Divergents . The EA allows working in one direction (for example, sell order series), while another direction (for example, buy order series) is in drawdown (compensation mode). If series in both directions operate in normal mode, the system does not switch to compensation mode. If a drawdown is detected in one of the directions, the EA goes into the compensation mode and starts compensating the loss-making series by the profita

The seed of a big tree 这是一个基于价格波动性的全自动 EA ,采用价格与金额双重识别的特殊买卖原则。参数简单,适应性强,能够自如应对震荡、趋势、数据和新闻等各类行情,表现稳定。 运行周期:任意周期获得的结果相同。 EA的实时交易记录在下面链接可以查看: https://www.mql5.com/zh/signals/470101 要求和建议: 请在EURUSD H1时间周期使用这个EA,强烈建议每周7天,每天24小时在VPS上运行。
参数说明: explanation:The seed of a big tree 0.01/12/$2000, 关于参数的简单说明。 Magiccode : 113301, 魔术码,主要用于区分不同 EA 的订单。 startposition : 0.05, 按照 10000 美元设计,根据实际账户资金每 2000 美元为 0.01。 profit : 60, 按照 10000 美元设计,实际使用时根据余额按比例自行调整,12—120都是适当的。 distance : 15, 挂单间距,也可适当调整,15—50都是适当的。 bu

Versatile expert system follows the principle "stay in the market for as long as possible". The main indicators are Moving Average and Relative Strength Index. The EA supports working in two directions simultaneously both following a trend and against it depending on the settings. A limited number of orders LimitOrders is used for operation. The EA correctly handles errors and reliably works with a deposit 1000 USD and higher. M5 and higher timeframes are supported. The EA has very flexible sett

The Long Term EA is a fully automated EA that is designed to trade on the Long Term using various strategies like trend trading and hedge at different timeframes. It may take some time to take a trade. SL and TP are always present. The Expert's strategy depends on the trend, where it takes positions along a cycle of price movements, either upward or downward. The stop loss is set to buy or sell orders as a security measure in case the price moves below or above a certain predetermined levels. In

Most professional traders declare strict compliance with risk management. This simple tool allows quick calculation of trading lot size in accordance with the following basic risk management rules: The maximum allowable risk is set as a fixed percentage of the account deposit (for example, 1-2%). The risk is measured as a distance in points between the order opening level and the stop loss level. It is always difficult for beginners to calculate trade lot based on the risk value, so this indicat
The indicator paints the candlesticks in colors of volumes depending on the market situation. Along with candlestick coloring, you will receive alerts in the form of a regular alert. Red candles indicate the end or beginning of a downtrend or the end of a correction during an uptrend. Green candles mean the beginning or end of an uptrend or the end of a correction during a downtrend. Yellow candles represent the lack of interest on the market and a possible beginning of a flat. Blue ones have an

Differences of Moving Averages This indicator plots short term trend with two moving averages difference and its signal line. Best result at 5 min chart in default parameters. There are 7 extern input parameters: MaShortPeriod: period of the first MA. MaLongPeriod: period of the second MA. ModeDoMA: DoMA method. ModePrc: MA price mode. SignalMaPeriod: Period of Signal MA. ModeSma: Signal MA mode. LabelLevel: Horizontal line level on display. Default parameters can be changed by user.
The indicator is a modification of RSI Alerts . However, it does not have a separate RSI indicator window. Instead, it uses signal arrows on the price chart. This saves space on the symbol chart, without affecting the quality of received signals and alerts. Similar to RSI Alerts, the indicator can generate sound alert, send push notifications and email messages, as well as draw signal arrows. The display of arrow can be disabled. If the arrows are enabled, they only display the signals chosen in

The indicator shows which trading pairs, strategies, robots and signals that you use are profitable and which are not. The statistic of trades and balance graph are displayed in the account currency and pips - to switch simply click on the graph. button "$"(top left) - minimize/expand and move the indicator panel button ">"(bottom right) - stretching and resetting to the original size
Statistic of trades 1 line - account balance, current profit and lot of open trades; 2 line - the number of al
This utility provides a very intuitive, versatile and helpful visual display of the live trades in a chart window - particularly good if you have a basket of live trades.
How to use The program runs as a Non-Trading Expert Advisor - it is not an indicator. Therefore it should be placed in the Expert Advisors folder and then attached to a separate chart window, maybe stacked in front of your live EA trading window - see screenshots for many variations. Or you could trade manually in the Dynamic

It's a multi-currency grid and martingale system that can trade all input pairs from one chart. The expert will close all orders for each pair using a profit level. The expert has the possibility to trade up to 100 pairs.
Information
Chose a broker with fast execution and low spreads for effective results. Please make some tests on a demo account to see how the expert works before using it on a real account. For 0.01 lot size and leverage 1:500, you need an initial balance of at least 10,000
FREE

这个指标可以用来衡量主要货币的相对强弱。在设定的时间周期内,相对较强的货币分值较高,相对较弱的货币分值较低。 指标的设置选项 Strength Period - 更改Strength Period(力度计算周期)会影响到计算的蜡烛数量,从而影响计算结果。较高的值让指标表示的线条较为平滑,而且指标的结果会表现出各个货币更长时间里的相对强度,而不是最近的强度。 Display Options - 设置视觉呈现的偏好(show strength/weakness/kebab) "show strength" 模式,越强的货币分值越高,最弱的货币是0分。 "show weakness" 模式,越弱的货币分值越低,最强的货币是0分。 "show kebab"模式,越强的货币分值越高,平均强度分值为50分。 参照这个指标,你不仅可以用它交易主要货币对,也可以用来交易各种不同的交叉对。 基本上扫一眼能大略看懂目前各种货币的相对强弱。 如果指标没有正确载入,可以多次切换不同周期来刷新。 默认状态下指标的固定最大值和最小值是可以更改的。可以根据喜好改变指标里每种货币表示的线型和颜色。
FREE

Expert Advisor that uses breakthrough strategy to open positions. The EA allows one trade at a time(per currency pair), so there is no additional risk for the user. It offers Money Management Systems(MM) - AutoLot based on account equity and,of course, manual lot size set up. On further updates the Money Management strategies would be expanded. All parameters are optimized. Hour Selection Mode - When desired, user can easily set up hours of non-trade. Lot Management : Two setups available for m

Gap EA is an automated trading system, which uses regularities of a price gap closing. It is known that in about 90% of cases the gaps are likely to close, i.e. the price almost always approaches to the close price of the previous bar. The Expert Advisor utilizes this principle. The robot tracks the gap and places an order with a take profit at the extreme of the gap, with a small stop loss.
Parameters MAGIC - magic number for the EA's orders Lots - traded lot size Stop - fixed stop loss in po
Индикатор POC line автоматически находит накопления крупных игроков и отображает структуру перетекания объемов, в виде линии проходящей по уровням Point Of Control (POC) - максимальных горизонтальных объемов. Незаменим для торговли на рынке FOREX. Применение
Уровни установки лимитных ордеров Уровни за которые прячут стоплосс Для переноса стоплосса в качестве трала Установите индикатор на любой график, и он самостоятельно найдет и выделит уровни Point Of Control свечных флетов и накоплений. Рас
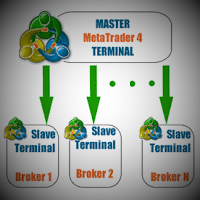
This utility copies the trades between MT4 on one computer. It also supports partial closing trades.
Parameters ID - is not required. If you want to use multiple MASTERs on one PC or on one MT4, each MASTER must have a different ID (alphanumeric). Then SLAVE must have the same ID as the MASTER. Mode MASTER - for a provider account; in this mode, the tool transmits trades from the master account. SLAVE - for a recipient account; in this mode, the tool receives the data transmitted from the mast

New to Binary Options Trading? You are not able to win while trading binary options? Need help with your trading? You have come to the right place! This indicator provides Put (SELL) and Call (BUY) signals for binary options on the M1-M15 timeframes.
Advantages Ability to easily recognize impulsive moves. Effective and flexible combination to different trading strategies. Advanced statistics calculation following the entry point. Signals strictly on the close of a bar. Works in all symbols and

SPD Neutron is an automated Expert Advisor. The strategy is based on price level. That means reversing trades when they reach a certain price level. This EA contains many strategies as well as internal settings that are available. It automatically deploys stop-loss and profit-taking settings that are latent in the system. The Expert Advisor does not use martingale, grids, hedging, averaging and other risky strategies.
Key Features Trades on timeframe: M5,M15 Trades on any pair, recommended EU

The indicator searches for the largest candles with minimum wicks for the last X candles. Sometimes, such candles mark the presence of a strong buyer, who quickly and strongly pushes the price in the right direction. However, most often, these are culmination candles, especially at the end of a prolonged trend when a single large candle knocks out stop losses of the most persistent traders and the price reverses instantly. The indicator allows you to open a position on the very edge of the marke
FREE

Price Action Trading (P.A.T.) is the discipline of making all of your trading decisions from a stripped down or “naked” price chart. This means no lagging indicators outside of maybe a couple indicators to help identify dynamic support and resistance areas and trend. All financial markets generate data about the movement of the price of a market over varying periods of time; this data is displayed on price charts. Price charts reflect the beliefs and actions of all participants (human or compute

Hope EA is a fully automated Expert Advisor that works on both Classical and ECN accounts on GBPUSD pair. It is programmed to use enhanced averaging equations to trade on the medium-term. The most important is that it passed the flash crash that happened twice on GBPUSD on 07/10/2016 & 24/06/2016 and severe gap jumps of 300 pips. It has passed 5 years backtest on real tick data with 99.9% Accuracy (check screenshots section). Minimum balance required is $1000 for standard accounts or $10 for mic

The principle of this indicator is very simple: detecting the trend with Moving Average, then monitoring the return point of a chart by using the crossing of Stochastic Oscillator and finally predicting BUY and SELL signals with arrows, alerts and notifications. The parameters are fixed and automatically calculated on each timeframe. Example: If you install indicator on EURUSD M5: the indicator will detect the main trend with the Moving Average on this timeframe (for example, the Moving Average
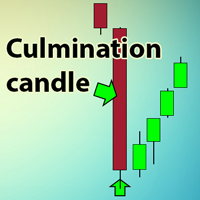
The indicator searches for the largest candles with minimum wicks for the last X candles. Sometimes, such candles mark the presence of a strong buyer, who quickly and strongly pushes the price in the right direction. However, most often, these are culmination candles, especially at the end of a prolonged trend when a single large candle knocks out stop losses of the most persistent traders and the price reverses instantly. The indicator allows you to open a position on the very edge of the marke
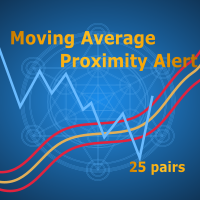
Moving Average Proximity Alert Multiple Pairs
Moving Average Proximity Alert Multiple Pairs is a 25 pairs multi-timeframe indicator which can trigger the alarm when the price approaches the moving average (MA) alert zone. Features:
Can monitor 25 currency, index, stock, crypto, metal, commodity pair’s moving average. The names (Symbol_01, Symbol_02, ...) must be exactly the same as they are displayed in the "Market Watch" window. Some brokers have non-standard names, such as "EURUSD.pro"

The Expert Advisor is a great tool that allows you to control your trade with ease and precision. The tool can be moved in the graphs and offers the following characteristics:
Instant order entry with a single click. Entry of pending orders using price tags and trend lines. Instant order closure with a single click. Instant order closure using trend lines as output levels that the broker can not see. We can modify the way to enter and exit the market, allowing us to choose the way to do it. Fo

The Yellow mouse manual tool is designed for manual trade management based in the 'EA Yellow mouse scalping' strategy. Trading time and direction are selected using on-screen buttons: "Trade" (allow trading), "Buy" (only allow Buy trades), "Sell" (only allow Sell trades) and "Close" (close all trades). After that the utility will trade in the selected direction with specified settings. When orders are close in any way (by take profit, stop loss or for any other reason), the "Trade" button change
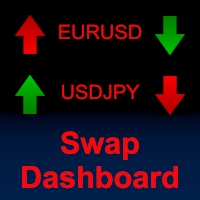
View and compare the swaps of all symbols in the Market Watch in one dashboard. A helpful tool for traders who like to use the swap to their advantage, or simply avoid trading against punishing swap rates. Choose whether you want to view the unedited swaps; adjust the swaps to show as a percentage of the Average True Range (ATR); or show the amount of currency you will get each day for trading the symbol using a given lot size. Sort the symbols by Name, or by their long or short swap value, by c

Pattern Explorer is a reliable tool for applying all the power of the most popular Japanese Candlestick Patterns . It uses Machine Learning algorithms to confirm all the patterns. What is the most impressive thing about it? Select Take Profit and Stop Loss and click on “Backtest your strategy” button to backtest your strategy in real time and to see according to your selection: Total signals Testable signals (signals that are reliable to be tested) Profitable signals (%) Loss signals (%) Total p
FREE

Trend indicator based on the price divergence. It can help you in finding the entry points during the analysis. It can be applied as a trading filter. It has two parameters: Period and Level . The Level parameter allows filtering out unnecessary signals. For example, the Level parameter can be set to 0.0001 for EURUSD. The indicator can work both as an entry point generator and as a filter. The indicator clearly visualizes the information. Keep in mind that the approach to trading should be comp

This indicator is a utility that can output spreads to CSV file in three formats. In the case of scalping where the spread greatly affects the trade result, the specification of the spread of the FX Broker you use is an important point to be aware of. Since the spread value changes greatly depending on the time zone, the average value of spreads officially announced by FX Broker is not very helpful. It is very important to investigate the spread specification of each FX Brokers by yourself. This

The COSMOS4U AdTurtle is an indicator based on the now classic Turtle trading system. The various high and low Donchian lines around the price bars show you when to open or close your positions. These lines indicate levels which result in the opening or closing of a respective position when the price crosses through them. By default, the new position barriers are drawn as solid lines and the exit barriers are drawn as dashed lines. The new long position lines and the close short position lines a

COSMOS4U AdTurtle Expert Advisor is based on the now classic Turtle trading system introduced by Richard Dennis and William Eckhardt. It employs Donchian high/low lines of various periods to decide when to open and close positions. This is an Expert Advisor that can promptly react to sudden trend reversals in everyday trading but is also suitable for executing long-term holding strategies.
How it works When the trading mode “Long&Short” is selected, a total of 8 high/low lines are used to open

Multi timeframe fractal indicator which shows the higher timeframe's fractal point on lower timeframes.
Parameters Fractal_Timeframe : You can set the higher timeframes for fractals. Maxbar : You can set the maximum number of candles for the calculations. Up_Fractal_Color, Up_Fractal_Symbol, Down_Fractal_Color, Down_Fractal_Symbol : Color and style settings of the fractal points. Extend_Line : Draws a horizontal line from the previous fractal point until a candle closes it over or a user-speci
FREE

This is a professional Expert Advisor, which implements the strategy of trading using the Divergents and DivergentsPoint indicators, as wells as filters of the global trend on higher periods. Analyzing the indicators, the system enters the market with a limited martingale and the ability to open up to 8 orders in one direction. Each series of orders has mandatory TakeProfit and StopLoss levels. Also, a trailing stop based on the SAR indicator is activated for a series in breakeven. The robot aut

The strategy is based on the idea that after n bullish/bearish candlesticks the price is likely to reverse. For example: after n bearish candlesticks in a row, the EA opens a Buy order, after n bullish candlesticks open Sell.
The EA analyzes new bar open prices, so testing/optimization results are very close to real trading. The EA applies dynamic order placement levels, stop loss, take profit and trailing stop levels invisible for brokers. The values of the levels can be calculated in pips, m

This indicator identifies short-term, medium-term and long-term highs and lows of the market according to the method described by Larry Williams in the book "Long-term secrets to short-term trading".
Brief description of the principle of identifying the market highs and lows A short-term high is a high of a bar with lower highs on either side of it, and, conversely, a short-term low of a bar is a low with higher lows on either side of it. Medium-term highs and lows are determined similarly: a
FREE

Indicator of divergences. It can help you identify the flat and trend areas. It can be applied as a trading filter. It has only one parameter - Period . The indicator does not show entry points, but only visualizes the information. Keep in mind that the approach to trading should be comprehensive, additional information is required for entering the market. Parameters Period - period of the indicator.

The strategy is based on working with the channel built by weighted average OHC and OLC prices. Entries are performed automatically both for a breakthrough and a roll-back.
The EA works by a new bar open prices, so that test/optimization results are as close to real trading as possible. It applies dynamic levels for setting new orders, stop loss, take profit and trailing stop invisible for a broker. Their values can be calculated in pips, money, % of the balance or by volatility (ATR). The EA

Tiger Moon EA robot is a automated robot for Forex trade. The EA does use a strategy of the MACD combined with martingale .
Input parameters MagicNumber : usually magic number of Tiger Moon EA is unique. Change its value only if your other EA uses the same magic number. Slippage : the maximum allowed slippage when you trade. The_MACD : the MACD parameters. Fast_EMA : Fast MACD Period. Slow_EMA : Slow MACD Period. Signal_SMA : Signal SMA Period. Management : will auto calculate lots size when M

TSO Price Channel is complete trading strategy focused on creating profit from market volatility. The system takes advantage of the intrinsic tendency of the market to reach its periodic maximum and minimum levels. By allowing the use of multiple instruments, the exposure of the system to any single instrument is reduced. Complete strategy including fully integrated positive and negative management. Works on any instrument. No pending orders placed. Any account size - $1,000+ is recommended.
B

The principle of this indicator is very simple: detecting the return point with Stochastic Oscillator, then monitoring the trend by using the Moving Average and finally predicting BUY and SELL signal with arrows, alerts and notifications. The parameters are fixed and automatically calculated on each timeframe. Example: If you install indicator on EURUSD, the indicator will detect the return point when the Stochastic Oscillator show "cross up" of the main line/signal line at the below position of
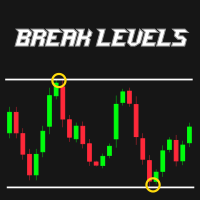
R747 BreakLevels is smart indicator that automatically detects Support and Resistance levels on actual market trend. Strength of levels can be easily adjusted by changing parameter LevelsStrength in range of 2 (weak levels) and 50 (strong levels). This indicator is accessible in EA via iCustom functions and is fully customizable by user. There is possibility to send Push notifications and Alerts of newly found levels. Follow this link to get all detailed information: >> LINK << Features Adjusta

Bomb Scalper is a ready-made mechanical trading system that analyzes the market using 12 market signals, as well as candle patterns, providing signals for opening and closing trades. On the screenshot below, you can see how the system draws the blue arrow for buying and the red one for selling. Order close signal is shown as the yellow arrow. Besides, during a closing signal, the indicator calculates potential profit/loss.
How the indicator works After launching, Bomb Scalper navigates through

Variation of Moving Averages indicator is calculated as the difference between different periods of moving averages. Obtained result filtered by another MA. It displays more precise signals of divergences between prices and the value of the indicator. It emphasizes price extremums more precisely, it moves faster.
There are three inputs FastMA: Default is 13, shows MA period. SlowMA: Default is 21, shows MA period. SignalMA: Default is 8, shows MA period. It basically detects the trend, advised

Harmonic Trading is now much easy than ever before with Harmonic Master Scanner Pro you can now scan time frames from 5m to 1w for 17 harmonic patterns on all bares at the same time. Harmonic Master Scanner Pro works based on original MetaTrader4 Zigzag indicator and the standard harmonic patterns elements. This software send alert and email to you when a harmonic pattern is detected on any charts. If you want the scanner to draw the pattern just switch the time frame to the alert time frame. Th
Version Voles Indicator without the inputs and the balance line.
Operation Principles It is based on the standard indicators of the MetaTrader 4 terminal. It shows the market entry points.
How to trade When a bar is complete and an arrow is shown, place a BuyStop order at the High of the bar if the arrow is green, or a SellStop order at the Low of the bar if the arrow is red. StopLoss should be set at the level of the last downwards fractal below the entry point at a green arrow or at the le

AUDCAD M15, EURUSDM15和GBPUSD M15。这个专业的交易机器人使用最好的成熟策略进行交易。除了出色的参赛作品外,它还使用动态网格系统来适应波动性并管理仓位。它是使用多个外汇经纪商的样本统计数据进行开发和测试的,以进行验证。数据样本足够大,足以涵盖各种市场情绪。然后使用样本外数据测试该策略以验证样本内性能。 EA的胜率高达80%以上。如果仓位输入良好,但如果仓位下降,智能仓位管理系统将管理交易以最终仍能获利。建议低点差大约10点(1点),高杠杆率1:500。 使用Tickdata回测。
输 入 EnableHedging - 真假 Balance Stopp Loss for each pair in percent of balance- 如果同时交易多于一对 Initial Lotsize - 第一笔交易的手数(当余额增加时自动增加) Balance - 您的帐户余额(建议以2000货币为单位) Balance Step Lots - 在此处输入与余额相同的值 Lot addition - 每个头寸的手数增

This is a great utility tool to see valuable information on your chart. The panel is free-floating, grab with your mouse and move around on the chart with ease. Also the panel is collapsible so you can save space, and you can see only the information you wish. There is three section to the panel, when is closed you can see the top section only. Here the list of information you can see on the panel, from the top to bottom:
The first part of the panel: Price : The color is changing according to

This indicator displays a set of moving average lines across all higher timeframes. The indicator can be installed on any financial instrument and any timeframe. For the analysis of the lines, a panel with timeframe values is provided in the lower right corner. Using the panel, you can easily enable/disable the display of the MA line of any higher timeframe. This allows a more thorough analysis of the market situation. The color of the button matches the color of the moving average line.
Param

A classic indicator with advanced features for more accurate display of the market situation. All settings of all moving averages are available, such as the moving average type and the priced used in its calculation. It is also possible to change the appearance of the indicator - line or histogram. Additional parameters provide the ability of fine tuning.
Distinctive features Does not redraw. Additional parameters for fine tuning. Displayed as a line or as a histogram. Works on all timeframes
FREE

If you want to test the functionality of this tool, you can do it trough this DEMO version, that is restricted to work only on EURUSD and USDJPY currency pairs. Full version is available here: https://www.mql5.com/en/market/product/29243/ This EA was originally coded as a back up tool for my personal trades as all of us (Or at least the ones who have left an order open and went to sleep) have experienced the frustration that involves waking up, check the trades and see that in some of them the
FREE

DYJ TRENDWAVE高级算法,检测新的趋势和当前趋势的延续,作为策略的入场信号。DYJ TRENDWAVE指标基于衡量多空双方的力量百分比,当空头(-)多头(+)趋势大于100%时产生信号。如果当前K线是阳线为多头入场信号,如果当前K线是阴线为空头入场信号,它使用多种滤波器对虚假信号过滤。 特点: 同时监视所有交易品种。 如果Pairs是空,指标默认监控报价窗口全部货币对,但用户可以选择喜欢的货币对. 监控每个时间段,从M1到MN。 仅在一个货币的某个图表周期(推荐H4或D1)运行指标. 输入参数:
Pairs --指定多货币符号,例如 EURUSD,USDJPY,CADJPY";为空时代表MARKET WATCH窗口的全部货币对 MinTimeFrame = H1 --最小入场周期 MaxTimeFrame = MN --最大入场周期 InpBuyColor = clrLime --空头颜色. InpSellColor = clrWhite --多头颜色. Send_Email = true --发送邮件通知. Snow_Alert =

If you want to test the functionality of this tool, you can do it trough a DEMO version, that is restricted to work only on EURUSD and USDJPY currency pairs. To obtain it, please visit the following link: https://www.mql5.com/en/market/product/29594 This EA was originally coded as a back up tool for my personal trades as all of us (Or at least the ones who have left an order open and went to sleep) have experienced the frustration that involves waking up, check the trades and see that in some o

Utility is designed to monitor and analyze the market conditions for all symbols of the MetaTrader 4 terminal using real-time data from the RSI indicator. Automatically detects all the pairs in your terminal, and also can filter them into groups. Gets the RSI indicator data for all timeframes and all selected pairs. Tracks up to 4 programmable signal patterns and notifies when they appear. Automatically opens a new chart for a given template when you click the desired pair in the table.
Input

H4 candles on the lower timeframes indicator allows the user to display the four hour timeframe on the lower timeframe chart. The indicator shows the closed H4 candles on the chart. It does not show the last unclosed H4 candle. You can position and color the candles with or without price labels (High/Low/Open/Close of the four hour period) and High/Low lines. It can help to see the bigger picture if you are a day trader or scalper. The most efficient way to use on the M5 and M15 charts, but you

I would like to present you my grid Expert Advisor.
How it works
Amount of trades closed with profit minus the most loss-making trade should exceed or be equal to Profit Distance Cut. The EA can work in both directions simultaneously or follow certain Price Action signals. Flexibility and simplicity of the settings make the EA available for beginners as well. With the right approach and customization, the EA can be used both for long-term trading and for boosting the deposit in a short time.
学习如何在MetaTrader AppStore上购买EA交易,MetaTrader平台的应用程序商店。
MQL5.community支付系统支持通过PayPay、银行卡和热门付款系统进行交易。为更好的客户体验我们强烈建议您在购买前测试EA交易。
您错过了交易机会:
- 免费交易应用程序
- 8,000+信号可供复制
- 探索金融市场的经济新闻
注册
登录