适用于MetaTrader 4的新EA交易和指标 - 271

The indicator displays potential entry points on a trend, displaying buy level, sell level and golden point which will determine where to get out of the trade or trail your stops. If an entry is detected, the indicator shows and Arrow, either pointing down for Short and up for Long positions. When the golden point is passed during a trade, it will start drawing potential points for trailing, is then up to you how to manage your trade. This indicator has been built for best results on H1 Time fra

xCalper Triad works as a Target scanner tool. Its algorithm calculates price level areas with high precision and instantly. By default, they are automatically identified and the trader normally sets visual parameters only. Explore a new perspective in price action analysis by adding Triad to your setup and surprise yourself.
Main Features Automatic & exclusive Target levels Daily candle representation in all intraday timeframes. Side panel information essential to all traders: Remaining time to
A trend indicator based on the Ichimoku Kinko Hyo and Candlestick. The Scanner Trend Indy is an improved variant of the Ichimoku Kinko Hyo and Candlestick, which shows the moment of trend following quite accurately. It is often used as a signal filter. Combination of two indicators makes a better use of these advantages: Ichimoku Kinko Hyo identifies the trend, while Candlestick determines the short-term movements and signals in the trend direction.
Messages/sounds (notifications and sound sett

This Expert Advisor is designed for effective investment management and medium-term trading. Unlike the usual version of Butterfly , it starts working when the minimum required number of High/Low bars are within the specified price range. The strategy is based on the assumption that the market bounces in the opposite direction several times before the big bids are satisfied. Do not use martingale, grid and other high-risk trading strategies similar to overstaying drawdown by keeping unprofitable

Fibo Reversals is an indicator which has carefully been put together to attempt to indicate a time period in which an ongoing trend is most probably exhausted and a new trend (actually a reversal trend) inadvertently begins. At this, it should be okay for the manual trader to be on the look out for good trading opportunities.
Input Settings Father Fibo – This Input Determines The Highest Price For The Chosen Input Period. Son Fibo - This Input Determines The Lowest Price For The Chosen Input

"All in One" Expert Advisor. The EA collects information from different signals (listed below) on the selected timeframes. Each signal has its own weight. The weight of all signals is summed. If the total weight of signals for a timeframe is greater than the minimum weight, a deal is opened. Operation on each selected timeframe is performed independently. After that, the deal is managed according to the Money Management conditions.
It can work simultaneously on: up to 6 periods; up to 31 popula
FREE
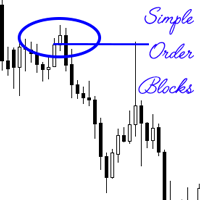
An order block also known as a block of order is a significant order placed for sale or purchase of a large number of securities. They are often used by institutional traders, and is a different way of looking at support and resistance. These levels are temporally used, before new levels and areas of interest are created. The simple order block indicator attempts to find the order blocks, which are more often than not optimal trade entries. The primary strategy when using the indicator when maki

If you need to quickly evaluate the results of trading on a current financial instrument by hypothetical price movement in the chosen direction and up to a certain level, set the indicator on any chart that contains open positions and move the line to the desired level after it appears together with the results tab. This is all you need to understand what happens to your deposit if the price is at this level without taking into account existing stop loss and take profit. Enable considering pendi
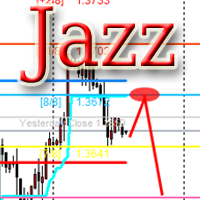
The algorithm of this Expert Advisor determines the significant price levels, where the trend often turns into a flat or reverses. Stochastic Oscillator serves as an additional filter of overbought/oversold zones. The EA sets stop loss and take profit after opening an order. The underlying trailing strategy applies a trailing stop. The EA is recommended for simultaneously use on three trading instruments: EURUSD M5, GBPUSD M5, EURCHF M5. Settings:
Comment to order - comment to orders. MaxRisk -

The Atlant Expert Advisor is based on combination of two basic indicators (moving average and momentum), available in the MetaTrader 4 terminal. When a buy (sell) signal appears, the EA opens a buy (sell) deal. When a repeated signal appears, the EA opens an additional deal, provided that the first base deal is at a loss. Thus, the EA forms a grid of orders. The volume of the first order and the volume of the newly orders can be customized in the input parameters. Also, the input parameters prov

Reversal Alert Pro 指标是一款功能强大的工具,旨在自动检测市场的反转区域。它提供直接发送到您的移动设备的方便通知,并显示带有声音的弹出式警报。通过将该指标纳入您的交易策略,您可以有效地过滤交易头寸。此外,该指标提供了利用 CCI、RSI 和随机指标进一步细化生成的信号的选项,从而增强了其通用性和适用性。 Reversal Alert Pro 指标的主要特点之一是它适用于所有时间范围和交易品种。无论您喜欢哪种交易方式或您交易的市场,该指标都能适应您的需求。参数设置设计为人性化,可以根据您的喜好轻松配置和定制。 当应用于您的图表时,该指标会快速绘制信号,使您能够迅速识别潜在的反转区域。这些信号可以通过您选择的周期、CCI、RSI 和随机指标进一步过滤,提供额外的精度层和对生成的警报的控制。 在指标的参数中,您可以灵活地调整各种设置。其中包括定义计算周期、指定从蜡烛高点/低点绘制箭头符号的距离,以及自定义具有不同颜色和字符的买卖符号的外观。 要进一步细化信号,您可以激活 CCI、RSI 和随机信号过滤器。这些过滤器允许您设置特定水平和平均周期,以根据各自的指标确定买入和卖出

Improved version of the free HMA Trend indicator (for MetaTrader 4) with statistical analysis. HMA Trend is a trend indicator based on the Hull Moving Average (HMA) with two periods. HMA with a slow period identifies the trend, while HMA with a fast period determines the short-term movements and signals in the trend direction.
The main differences from the free version: Ability to predict the probability of a trend reversal using analysis of history data. Plotting statistical charts for analyzi

The demo version is limited to the currency pair CADCHF. The product with complete description and video can be found here: https://www.mql5.com/en/market/product/23310 The Trading Assistant can apply automatic exits, set pending orders when trading is closed, scale trades and much more. The tool is easy to handle and clear, it works smoothly with one or more orders.
Features Scheduling of pending and market order - useful for time based strategies or for preparing an order when the market is
FREE

The Trading Assistant can apply automatic exits, set pending orders when trading is closed, scale trades and much more. The tool is easy to handle and clear, it works smoothly with one or more orders.
Features Scheduling of pending and market order - useful for time based strategies or for preparing an order when the market is closed Automatic stop to break-even point for position protection Independent profit taking by the crossing of two moving averages - ideal for trend strategies Finely adj
The strategy is based on RVI oscillation to check the prices trend and direction and check the moving avarages (Open Price and Low Price) to decide about the viability of opening any order. Market is very unpredictable due to economic news published every hour, but our EAs are really prepared for such hostility due to its protections. This Expert Advisor is provided with two kinds of indicators: an oscilator (RVI) in order to check the prices oscillation limit pattern and direction trend; two Mo

YPY Trading Aggregator is a universal multifunctional software package for aggregation of trading. This functionality can be useful for multicurrency trading and/or application of multiple experts on a single trading account, as well as for combining automatic and manual trading. Also, anyone can use this utility to estimate the risk of the current online trading on the account (the maximum possible losses in % of the account balance). The utility aggregates the data of the active trade and outp

This indicator is using the Central Limit Theorem in combination with historical volatility and Fibonacci ratios in order to create unique type of chart tool called Projected Volatility Distribution. This tool allows you to perform highly accurate intraday technical analysis where in a split second you can detect overbought and oversold conditions as well as strong trends. In addition you have at your disposal multi-functional panel which shows signals in real time and gives you the ability to o
This tool will allow you to export candles data (Open, High, Low, Close, Volume) for any financial instrument present in your MetaTrader 4. You can download the data of multiple Symbols and TimeFrames in the same csv file at once. You can schedule the frequency, simply choose the refresh interval (1 minute minimum, if 0 then the extraction will be done once) and the tool will do the work. No need to open a lot of charts in order to get the last sync, the tool will download the data directly. The
FREE

The support and resistance levels are among the main components of the entire technical analysis. They are used both by professional traders and by beginners. Prices usually move within the price channels. The upper boundary of such a channel is called resistance, and the lower one is support. This indicator plots fractal support and resistance lines at the highest and lowest local price values (fractals).
Distinctive features Does not redraw. Clear and understandable signals. It is possible to

A trend indicator based on the Ichimoku Kinko Hyo and MACD. The ICloud Scalper Trend Indy is an improved variant of the Ichimoku Kinko Hyo and MACD, which shows the moment of trend following quite accurately. It is often used as a signal filter. Combination of two indicators makes a better use of these advantages: Ichimoku Kinko Hyo identifies the trend, while MACD determines the short-term movements and signals in the trend direction.
Messages/Sounds (Notifications and sound settings) ON/OFF -

简介 Notify Telegram 是一个链接 MT4 和 Telegram 的 EA 。这个 EA 会监控您 MT4 的活动例如下单,修改盈利止损,关单等并透过 Telegram 机器人发送通知至您的 Telegram 户口/频道。这个 EA 不会在您的 MT4 户口上进行任何交易活动。这个 EA 适合用来监控其它 EA 在您的 MT4 上的交易活动又或者透过 MT4 上的交易在您的 Telegram 频道上进行喊单。
设置
Token =""; - 输入您的 Telegram 机器人 API token ChatID =0; - 输入您的 Telegram Chat ID 或者 Channel ID AlertOnTelegram =true; - 服务开/关 NotifyInitialSetup =true; - 启用初始化发送通知 NotifyOrderClosed =true; - 启用关单通知 NotifyPendingFilled =true; - 启用挂单开单通知 NotifyNewPending =true; - 启用新增挂单通知 NotifyNewOrder =

Algorithm of this system is based on Bill Williams' Alligator indicator . This represents the Jaw, the Teeth and the Lips of the Alligator. It was designed to help confirm that a trend is in effect and in what direction. As with all moving averages, the shortest one (green) moves first, followed by the middle (red) and then longer average (blue). Creator Bill Williams used 13, 8 and 5-period averages, brought forward 8, 5 and 3 periods, respectively. Colors are usually blue, red and green, respe

This trading system is based on criteria of various technical indicators . These include fractals , Alligator and ADX (measuring trend strength with average directional movement index) . This algorithm uses a hedging strategy in the zone of volatility. To explain it: if fractal to buy is above the Alligator's Teeth line, the pending Sell Stop order to open the position should be placed 1 point below the low bar, which formed a fractal. If the fractal to sell is below the Alligator's Teeth line,

This Expert Advisor is based on the Money Flow Index (MFI) and using a trend-based trading strategy. The Money Flow Index used to evaluate oversold and overbought market conditions. MFI values of 80 and over indicate overbought conditions, meanwhile, values of 20 and below indicate oversold conditions. In addition, if the MFI is below ( Buy_MFIBelow ) and not above the overbought level , it indicates the buy signal. On the other hand, if MFI is above ( Sell_MFIAbove ) and not below the oversold

The Expert Advisor is based on technical analysis of high-low candlesticks. This technique can be used to trade volatility in all trading periods and swing trading. The EA compares today's bar with yesterday's one. If today's high is higher than yesterday's high and today's low is higher than yesterday's low, that indicates a buy signal. But on the other hand, it is a sell signal. This system is used to add Average to range (ATR) , Standard deviation (STD) , and Average daily range (ADR) to filt

The EA automatically opens the orders when price crossing/touching lines, which were drawn by the user. Two scenarios are possible. When you expect the price to stay in the channel. When you expect that the price will not remain in the channel after the break off it. If you want use first scenario - you must set in settings Trade mode = “False_Breaking_Channel”. If you want use second scenario - you must set in settings Trade mode = “Breaking_Channel”. When you run EA, you must draw two trend li
FREE

This is an automated Expert Advisor that trades using the MACD and Envelopes indicators. The free version has the following limitations. No panel for opening orders. The trading is limited to the EURUSD currency pair and similar. Orders can only be opened with the minimum lot, no more than 5 orders can be opened in the same direction, to a total of 10 orders. Pause after closing of all orders is 6000 minutes. During the analysis, no more than 50 orders are added to the database and 15 bars are c
FREE

The EA works on the Envelopes indicator. When the price exits the channel and returns, orders are opened and then closed at the intersection of the maximum and minimum lines of the indicator. The EA uses two take profits, stop loss, auto lot and other settings that allow you to customize the robot to your needs. We recommend a deposit of 50 USD on a cent account, currency pair GBPUSD, leverage at least 1:500, timeframe H1 (or higher). The EA is able to work on any currency pairs, as well as on s
This indicator analyzes in parallel the moving average for multiple currencies and timeframes. It sends a notification when the trends are in alignment for all timeframes. To get better assessment of the trend strength, it shows as well a ratio between the number of pips reached from the current trend and the average of pips reached from the previous trends.
Features Loads automatically historical price data from broker server; Tracks all currency pairs for all timeframes in parallel; Configure

"LINKER" is an indicator that links any number of windows of the charts it is running on. A synchronized crosshair is also available, toggled by the (Ctrl) key or the (L) button. The visibility of the trade levels can be toggled on each chart separately using the (Shift) key or the (V) button. The buttons and the crosshair have customizable settings and colors. For instance, you need to analyze a trading instrument on different timeframes, for example, on H1, H4 and D1. Doing this in a single ch

This expert advisor can enter and exit trades at specific times and on specific weekdays, expressed in GMT Time. It offers weekday selection, trade management settings, a martingale function and money management features. [ Installation Guide | Update Guide | Troubleshooting | FAQ | All Products ] Easy to use and supervise Fully configurable entry and exit times (up to 5 trades)
Enable or disable trading weekdays in inputs
Customizable break-even, stop-loss, take-profit and trailing-stop setting
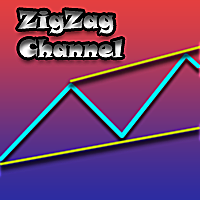
Exclusive Channel on Zig Zag is a channel indicator for the MetaTrader 4 terminal. This indicator plots a channel based on the peaks of the standard ZigZag indicator. If you trade using the ZigZag indicator or channels, then Exclusive Channel on Zig Zag will suit you perfectly.
Advantages of Exclusive Channel on Zig Zag The indicator is perfect for scalping and intraday trading. Suitable for beginners and experienced traders. Works on any financial instruments and markets. Works on all timefram

该技术指标使用图表上的各种 反转烛台模式 自动识别和分析价格行为。它可以方便地绘制箭头符号以及相应的形态名称,从而轻松发现最新的反转烛条形态。使用此指标,您可以快速识别图表分析并将其与之前识别的蜡烛形态进行比较。 该指标包括一系列实施的烛台模式,既简单又复杂,例如蜻蜓十字星、墓碑十字星、锤子、Pin Bar 等。这些模式根据当前趋势和历史数据进行过滤,确保信号可靠。该指标通过绘制箭头并在图表上显示模式名称来直观地表示已识别的模式。此外,您可以灵活地自定义所有对象的箭头类型和颜色,以获得更好的视觉体验。 除了其模式识别功能外,该指标还提供各种自定义参数。您可以设置买卖信号的颜色,为箭头符号选择特定字符,并调整箭头与蜡烛高/低点的距离。此外,“高-低保证金”参数允许您从当天的高点和低点定义保证金水平,以分析烛台形态。 凭借其全面的功能和用户友好的界面,该指标对于寻求在其技术分析中利用烛台模式的力量的交易者来说是一个有价值的工具。
参数 图形参数 - 自定义视觉外观和颜色。 其他参数 - 自定义常用指标条件。

发电机专业版 允许您基于平均值创建由多个虚拟策略(从一个到数十万个)组成的策略。每个虚拟策略都有自己的策略类型(趋势、反趋势)、虚拟存款、虚拟头寸、手数。 EA 控制所有虚拟策略的工作,汇总所有操作并对交易账户进行相应操作。 顾问操作模式
没有文件 - 不使用带有策略的文件的模式。所有虚拟策略将根据“ GENERATOR ”项中所选的参数范围生成。可以通过设置策略数量 ( Random_Strategies ) 或通过列出所有可能的参数来随机生成策略 ( Random_Create_Mode =true)。 从文件 - 使用策略文件的模式。您可以根据某些标准( Top_Mode、Top_Size )从创建阶段( Create_Mode )生成的策略中选择最成功的策略。所有生成的策略都将写入一个文件,您可以在 来自文件 。 创建模式 - 基于所选标准和虚拟策略参数范围创建策略的模式。在策略测试器中工作。要创建策略,您需要确定交易对、时间范围、时间段,选择虚拟策略的参数并运行测试。测试完成后,会生成一个txt文件(在文

The script creates a brief daily summary report of the weekly trade in a separate window.
Input parameters of the script number of weeks - set the time interval (the number of weeks) for the report. switch for symbols selection - three modes for selecting the instruments to generate the report: All_Symbols - report is generated for deals of all instruments. Current_Symbols_Only - report is generated only for deals of the instrument in the current window. Without_Current_Symbols - report is gene

"All in One" panel. You can simultaneously control: up to 3 symbols; up to 6 periods; up to 31 popular signals. You can see the sum for all signals taking into account the weight of the signal Version for MetaTrader 4: https://www.mql5.com/ru/market/product/27880 Version for MetaTrader 5: https://www.mql5.com/ru/market/product/27830
Parameters NUM_BAR - number of the bar to analyze (set a value greater than 0 to work on closed bars). timeframe_1....timeframe_6 - working timeframes (if set to "c
FREE
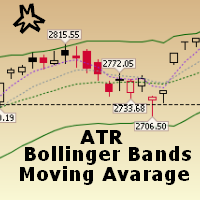
This EA strategy is result of professional experienced traders demand for trading technique and quality. It has three built-in indicators: ATR to measure oscillation, Bollinger Bands and Moving Avarage to measure Trends. It has some protections like Trailing Stop Loss to protect your profits an Spread limitator to protect your equity and finally an stopout level that you may define by an minimum equity percentage.
General Inputs Closes orders with any profit of value over in currency: this para

Introduction to EFW Analytics EFW Analytics was designed to accomplish the statement "We trade because there are regularities in the financial market". EFW Analytics is a set of tools designed to maximize your trading performance by capturing the repeating fractal geometry, known as the fifth regularity in the financial market. The functionality of EFW Analytics consists of three parts. Firstly, Equilibrium Fractal Wave Index is an exploratory tool to support your trading logic to choose which r
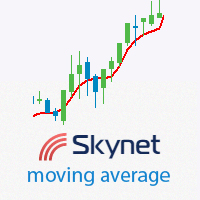
This indicator displays the trend direction, the averaged price value and flat areas. It is used to determine the averaged price value with little or no delay. During a flat, its line is often smooth, and it follows the trend during a descending or an ascending movement. The best charts for the indicator are the range\renko charts, which do not have rounded borders of price changes. Various types of moving averages and certain types of digital filters were used as a prototype. Compared to variou

This Expert Advisor is designed for effective investment management and medium-term trading. Unlike the Butterfly Platinum version, it uses the Martingale system. If the previous trade was closed at a loss, the next lot will be equal to the last lot multiplied by MultiplierLots. Every trade is protected by stop loss. Only one market order can be opened at a time. It works using pending (Stop, Limit) or market orders depending on the parameters specified. The trailing stop levels can be set in pi

Currencies Cleaner panel will give you an overview of all the most traded market's currencies in a single click. First of all the panel will refresh all your charts, opening them four times in all timeframes needed.
1 - CURRENCIES It uses a complex algorithm to study the movement of 17 different indicators. It means that the algorithm not only "reads" the actual value of an indicator, but also creates a probability of success using the position of this value on the indicator and the last moveme

This indicator scans for you up to 30 trading instruments and up to 8 timeframes for occurrences of the high probability reversal patterns: Double Tops/Bottoms with fake breakouts . Please read also the blog post " Professional Trading With Double Tops/Bottoms And Divergences! " which explains the concepts behind the ULTIMATE Double Top/Bottom indicator and how you can use a professional top-down approach. You can get alerts via MetaTrader 4, email and push notifications at the moment when a sig

DIFF-2Pairs detects divergences of correlated pairs considering lots balancing (+ built-in strategy tester ). The indicator has a system for measuring the divergence of correlated pairs by various methods to estimate the value of the differential curve: the system can measure performance. statistical analysis to determine the optimal SL and TP. exporting data to a CSV file. Currently, the indicator supports the following deviations of the correlated pairs: The standard deviation is the measur
DSProFx TrendLine Expert Advisor is a semi-automatic Forex robot that can be used for scalping and day trade as well. It works based on Trend Line.
Concept, Timeframe and Pairs DSProFx TrendLine works in all time frame. Trades will be opened if the market price touch the Trend Line that is set for Buy or Sell based on line name . "B" for Buy order and "S" for Sell order. To open more than 1 orders, for example Buy orders : use "B1", "B2", "B3", etc. The trades will be closed by some options:

The Expert Advisor trades using the Stochastic indicator with the specified parameters. A trade is opened at the crossover of the specified levels. The default levels are K = 11, D = 3, Sl = 3. The EA opens a trade when overbought and oversold levels specified by the trader are crossed. Trades are closed by Take Profit levels, which are hidden form the broker. If a wrong direction is chosen, the EA opens an averaging grid of orders. If there is no signal for opening a position by Stochastic indi
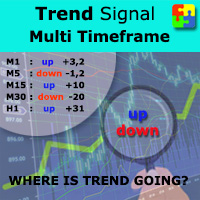
Do you want to always know in a quick glance where price is going? Are you tired of looking back and forth between different timeframes to understand that? This indicator might just be what you were looking for. Trend Signal Multitimeframe shows you if the current price is higher or lower than N. candles ago, on the various timeframes. It also displays how many pips higher or lower current price is compared to N. candles ago. Number N. is customizable The data is shown in a window that you can m
If you are using volume spread analysis, this system will give you a lot of help and features in your analytics. Please watch the video to see all the features.
Features Bars without opening price. Easy to read volume indicator. Bar reader (Bar type - Close type - Volume type - Spread type). Daily and weekly levels (Pivot - Camarilla - Fibo). And more
Indicator parameters Number_Of_Bars - Choose the number of bars you want to appear on the chart Bars_WIDTH - Choose the width of Bars, 1-2-3-4 .
Stoch–Cross Scalper is an Expert Advisor based on the Stochastic oscillator indicator using the 80 threshold as overbought and 20 as oversold while utilizing a 14 day rolling period to analyze High and Low closing prices in relation to the current close price. The Stochastic oscillator is a commonly used indicator and many trading philosophies are based upon it. This expert is the result of over ten years of my fine tuning and perfecting this trading system. Almost all of the indicators availabl

Deposit : from 100 deposit units Trading pairs: I recommend currency pairs: EURAUD, CHFJPY, EURCHF, EURGBP, AUDCHF, CADCHF, USDCHF. Trading period : Any Account:
You should use ECN-ECN.Pro accounts with five-digit quotes with a moderate size (spread). Parameters: USING - Choice, trading risk or fixed lot RISK/LOT - Lot Risk Value RESTORING_THE_BALANCE - Restoring balance* HOW_THE_RESET_WINDOW - Reset the Global Variable TAKE_PROFIT - Set profit STOP_LOSS - Set loss COUNT_BUY - The number of s

The Expert Advisor is based on the principles of Parabolic SAR indicator and uses the elements of the hedging strategies. This mechanism uses the momentum of trading volatility that works on all the timeframe, day trading and swing trading. If two Parabolic SAR dots are below the price they represent the buy signal, and if the two Parabolic SAR dots are above the price they indicate the sell signal. This algorithm uses a hedging strategy that works with the volatility zone system, which we apply

Power Index Fx is a new generation indicator that allows an intelligent multi Timeframe analysis. The indicator is flexible and completely customizable. Its positioning in separate window makes it unobtrusive and extremely functional. Its formula of calculation makes it a fundamental tool for identifying possible moments of continuation in favor of Trend. Power Index Fx is a professional tool able to increase your operational potential.
Input Values DASHBOARD SETTINGS How many symbols to show 2

Background It only needs a small initial deposit. Suitable for multi-currency trading. Immunity to the large delay and the size of the spread. Monitoring of my accounts : https://www.mql5.com/en/signals/author/mizrael
Operation Principle The EA trades within a modifiable channel. Depending on the market situation, the EA works using a long-term, short-term strategy or both. Closing is done by averaging a number of profitable and loss-making orders, regardless of the strategy currently in use

This is an automated Forex Expert Advisor. The strategy is based on the assumption that the market bounces in the opposite direction several times before the big bids are satisfied. It has a built-in algorithm for predicting the price movement, which allows the EA to make decisions on opening averaging orders or increasing positions. It works using pending (Stop, Limit) or market orders depending on the parameters specified. To diversify the risks, the EA works with short and long positions simu

This is an automated Forex Expert Advisor. The system is based on trading in possible flat emergence zones. The EA has a built-in price movement predicting algorithm, which enables the EA to make a decision to open averaging orders or to scale an open position. Depending on parameters, it works with pending (Stop, Limit) or market orders. To diversify risks, the Expert Advisor works simultaneously with short and long positions. Their closure can be either an oppositely directed or unidirectional

This EA trades mainly in the London and New York Sessions of the market. Forex Agent A is a day scalper with a bigger stop loss and a smaller take profit. Trades are opened at the first tick of the bar. In case of extended drawdown, take profits are adjusted to exit the market sooner and if at all possibly profitable. The built-in news filter prevents the opening of new trades when important news is upcoming. Entry points are determined exclusively by various indicators. Trade exits determined e

Openology is a very simple indicator that can show the historical information of the opening price levels. The histogram has in fact the task of showing the history of this value in order to study the conditions of permanence and duration of this very important market condition. The indicator, in separate window, is not intrusive and through its internal customization extremely simple in use. Very important is the possibility to enable or disable a timeframe to show the agreement of study on Ope

The indicator places Semaphore points on the maximum and minimum of a higher, medium and lower period. It includes A,B,C Triangles for easier spotting of reversal chart pattern which occurs very frequently and has a very high success ratio. Both Semaphore and A,B,C Triangles have Alerts and Push notifications to a mobile device when they occur on the chart. These indicators are very useful for breakout trading and spotting support/resistance levels which gives good opportunities for positions.

FutureTrade is one of the few indicators that predicts the price right on the price chart. The indicator calculation algorithm is based on the fast Fourier transform. Given the oscillatory behavior of the price, the Fourier function predicts its future behavior. The indicator should be attached in the usual way to a chart with the trading instrument specified symbol and with the M15 timeframe. This timeframe is the most optimal for working with any symbols. Once started, the indicator calculates

An original trading robot for Forex trading. It opens deals in two directions at the same time. When the first order is closed, the EA tries to bring the second one into profit and to close it. If the market price moves against the order, then the EA places a group of orders against the price movement and opens an additional order in proportion to the price movement with a certain coefficient. Orders are closed when the entire grid of orders reaches a total profit. It is recommended to trade cur

The indicator displays divergence and convergence on all instruments. It works on all timeframes. After finding divergence/convergence, the indicator draws a Buy or a Sell arrow according to the detected signal.
Settings Buy - show buy signals Sell - show sell signals Divergence - show divergence on the chart Convergence - show convergence on the chart KPeriod, DPeriod, Slowing - Stochastic settings drawPriceTrendLines - draw a line (of divergence/covergence) on a price chart drawIndicatorTren

Real-time trend, pricing, and volume details in the corner of the current chart. This indicator displays useful trend, pricing, and volume information in the corner of the current chart. With this indicator, you get real-time market trend, pricing (Ask, Bid, spread, Open, High, Low, change from previous bar Close), and volume (current, High, average). After the indicator is executed, you will see this real-time data in the upper right-hand corner of the chart or an alert indicating that an error

Easy Advisor is a fully automated Expert Advisor that uses martingale. Unprofitable orders are covered by new order with increased volumes. The lot size increases 100 times from the initial to the final value. If the initial lot is Lots_1 = 0.01, then the maximum lot size in a cycle will be equal to 1. The EA uses virtual take profit and stop loss. In case of unsuccessful work, in a single cycle with the initial volume of Lots_1 = 0.01, the loss will be equal to 2000 USD. Increasing the initial

Heiken Ashi Smoothed Strategy is a very simple but powerful system to get forex market trend direction. This indicator is actually 2 indicators in 1 pack, Heiken Ashi and Heiken Ashi Smoothed Moving Average both included. Because HA (Heiken Ashi) and HAS (Heiken Ashi Smoothed) are calculated in the same one system event with necessary buffers and loop only, so it is the FAST, OPTIMIZED and EFFICIENT HA having the combined indicator of MetaTrader 4. You can choose to display HA and HAS in the sam
The indicator finds price accumulation areas in a specified price range and time interval. By setting time to 10-18:00 and area width to 40 points, the indicator finds the area having the specified width that was most often touched by the candles in this time interval. Until 19:00, the area within the current day can move. With the first tick from 19:00, the main area is fixed and not re-painted. If Continue zone is enabled, the area having another color is set on this level after fixing the mai
Y oscillator 该指标是价格变动率的数学表达式。使用振荡器的基本概念是市场的超买和超卖条件。当指标线接近其上限时,市场被视为超买。超卖区域的特点是在其下边界存在指标线。越过线的时刻也被考虑在内。指示器通过显示对话框、向地址发送电子邮件或向移动终端发送通知来通知这一点。
设置说明 y_Period - 指标周期。 价格 - 使用的价格类型。 警报 - 显示包含用户数据的对话框。 Text_BUY - 购买信号的自定义文本。 Text_SELL - 卖出信号的自定义文本。 Send_Mail - 向在“邮件”选项卡上的设置窗口中指定的地址发送电子邮件。 主题 - 电子邮件的主题。 Send_Notification - 向移动终端发送通知,其 MetaQuotes ID 在“通知”选项卡的设置窗口中指定。

With this system you can spot high-probability trades in direction of strong trends. You can profit from stop hunt moves initiated by the smart money!
Important Information How you can maximize the potential of the scanner, please read here: www.mql5.com/en/blogs/post/718109 Please read also the blog about the usage of the indicator: Professional Trading With Strong Momentum.
With this system you have 3 reliable edges on your side: A strong trend (=high probability of continuation) A deep pull

The objective of the Crypto-Box Indicator is to determine the most efficient entry in trends. . It works for all purposes, standing out in the main cryptocurrencies: BitCoin, LiteCoin, Ethereum and Emercoin. And in Currencies: EURUSD, USDJPY и GBPUSD. The indicator is designed to find the best conditions for financial instruments. Detects acceleration patterns in prices in areas of supports and resistances. The development team is constantly improving the functionality of the Indicator and we th

New opportunities for analyzing cryptocurrency in the usual MetaTrader 4. For example : We select the symbol of the cryptocurrency and attach any indicators, Expert Advisors or scripts.
Startup Mode View Cryptocurrency; Data collection.
Capabilities Work as with a standard currency chart; Automatic update of open charts; Selection of individual cryptocurrency for updating; Selection of individual timeframes for updating (only H1 in the free version); Work on the desired timeframes (only H1 in
FREE

Manager Trade is a tool that will help you manage trades in an easy and simple way. It is a panel that on its first tab contains buttons and inputs, beautiful and intuitive, that allow you to place operations much faster. In its second tab, all the orders of the account are listed, leaving them available to close each one with a single click of a button.
Main features Place direct and pending orders with a single click, and in the same screen adjust SL, TP and Lots without having to reload the

StepUp Martingale EA is a fully automatic Expert Advisor developed for Forex trading. Expert Advisor is suitable for all types of accounts and irrespective of spread. The EA unsupervised during news release and other market condition. Even during interruption of trade due to VPS reset, network issue, etc., the EA will always detect open orders once these conditions are rectified. The EA always uses Take Profit hence it is less sensitive to the speed of a broker. Preferred currency pair is NZDUSD
MetaTrader市场是独有的自动交易和技术指标商店。
阅读MQL5.community用户备忘更多地了解我们提供给交易者的独特的服务:复制交易信号,自由职业者开发的自定义应用程序,通过支付系统完成的自动付款和MQL5云网络。
您错过了交易机会:
- 免费交易应用程序
- 8,000+信号可供复制
- 探索金融市场的经济新闻
注册
登录