适用于MetaTrader 4的新EA交易和指标 - 267

Demo is limited to the currency pair CADCHF. Full version: https://www.mql5.com/en/market/product/27237 Essentials for manual trading. The utility includes functions such as money management, automatic exits, hedging of positions, setting orders by date, OrderClose menu and others. Simple and clearly arranged, the tool works with one or more orders. Low tick rate compatible.
Features Display money management - right lot size is calculated from stoploss, account balance and risk appetite Schedu
FREE

Essentials for manual trading. The utility includes functions such as money management, automatic exits, hedging of positions, setting orders by date, OrderClose menu and others. Simple operation and clearly arranged, the tool works with one or more orders. Low tick rate compatible.
Features Display money management - right lot size is calculated from stoploss, account balance and risk appetite Scheduling of pending and market order - time based strategies or for preparing an order when the mar

Introduction to Harmonic Volatility Indicator Harmonic Volatility Indicator is the first technical analysis applying the Fibonacci analysis to the financial volatility. Harmonic volatility indicator is another level of price action trading tool, which combines robust Fibonacci ratios (0.618, 0.382, etc.) with volatility. Originally, Harmonic Volatility Indicator was developed to overcome the limitation and the weakness of Gann’s Angle, also known as Gann’s Fan. We have demonstrated that Harmonic

Signal Bands is a sensitive and convenient indicator, which performs deep statistical processing of information. It allows to see on one chart (1) the price trend, (2) the clear price channel and (3) latent signs of trend change. The indicator can be used on charts of any periods, but it is especially useful for scalping due to its high sensitivity to the current market state.
The functions of the indicator : First, the Signal Bands indicator draws channels into which all price fluctuations exa

Pattern Detector can detect the most common 1, 2 and 3 candlestick patterns and send notifications when detected. Demo version working on AUDNZD can be found https://www.mql5.com/en/market/product/29189
How does it work Add the indicator to the chart you want to analyze and select which patterns to detect, the indicator will draw the detected patterns. You can also be notified via alert, app and email when a new pattern is detected.
Parameters Indicator Name - Used to draw the graphical object
FREE

An indicator of round levels. A range of important price levels with sound and text alerts, which are generated when the current Bid price of a currency pair is equal to a round number. This indicator visually shows the trader true support and resistance levels, which are used by most of traders and trading robots. The advantage provided by this indicator is that the trader using this indicator on a chart does not need to draw any additional levels. Round price levels represent a certain barrier
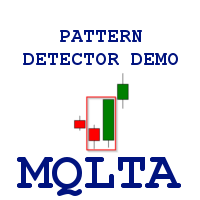
Pattern Detector can detect the most common 1, 2 and 3 candlestick patterns and send notifications when detected. The DEMO version only works on AUDNZD pair. Full product can be found https://www.mql5.com/en/market/product/29190
How does it work Add the indicator to the chart you want to analyze and select which patterns to detect, the indicator will draw the detected patterns. You can also be notified via alert, app and email when a new pattern is detected.
Parameters Indicator Name - Used to
FREE

This is an indicator of "round levels" with a trading system module based on market scenarios near psychologically significant "market prices". Visualizing the SL/TP levels and modeling deals when they interact with OHLC prices, the module collects statistics for the specified period and plots the "profitability curve" on its basis, which allows controlling the expected profitability of trading signals.
Trading system The algorithm is based on the trading system The Elementary, Watson! ( EW ) f

The Expert Advisor is able to trade on any financial instruments quoted in MetaTrader 4. To ensure this, it is necessary to monitor the correctness of settings. The trading logic is based on a series of pending orders. The full traded lot is composed of numerous small lots. Complex lot allows for a more precise control of the risk of the position volume, entering the market in parts. The advantage of the system of pending orders is that order trailing allows opening deals at more favorable price

MQLTA Candle Timer is an indicator that can show you the details about a symbol/pair and alert you before the close of a candle. Used in swing trading and not only, it can help your strategies knowing and be ready before the close of a candle.
How does it work Simply add the indicator to the chart and set the notifications options. You can load a minimalistic interface or a full interface. The alert will be sent once per candle.
Parameters All the parameters, that you can see in the picture, a
FREE

点差成本信息 点差产生的交易成本是制定交易盈亏比时的一个重要指标。点差成本信息对短线交易者尤其是超短线交易者尤为重要。本工具可以在不同的账户类型(美元账户、欧元账户等等)下,输出平台报价中所有外汇货币对(包括黄金XAU、白银XAG)的点差成本。
计算方法及原理 见文章: 外汇货币对的交易成本 Part1 外汇货币对的交易成本 Part2 外汇货币对的交易成本 Part3 外汇货币对的交易成本 Part4
参数 Lots - 设置计算点差成本的交易手数,默认为1.0。
如何使用 使用此工具前需将MT4的市场报价设置为“显示全部”,具体操作见下图; 输出的路径为“ MT4路径\MQL4\Files\SpreadCostData ”,文件名称是当前日期,输出成功后会在MT4 - 终端 - EA一栏显示成功输出信息,输出路径及文件名称见下图; 输出内容的第一列是货币对名称,第二列是点差(点数),第三列是交易 Lots 手的点差成本(点差成本以账户货币计价),具体内容见下图。
完全版 所有数据在面板上实时更新,下载地址: https://www.mql5.com/zh/market
FREE
This indicator is based on Ichimoku kynko Hyo but personalized with We-Trading rules.
Ichimoku Trend Arrows As you can see, the indicator shows two types of arrows (signals): Big arrows to follow the big trends Minor arrows to re-enter on trend adding more trades With Ichi-Trend indi, you can follow the trend of the market. You can use it on Forex and on all CFDs and with all the fimeframe you like.
Parameters Main parameters help trader to setup Ichimoku value as: tenkan_sen - default value

This software will give you the possibility to do different things (both in live markets and in strategy tester) . You'll have at your disposal 5 operative panels, each one of these have buttons that let you interact easily at market:
1. Opened Orders Manager (screenshot 1): 6 buttons: Close all buy orders. Close all sell orders. Close all orders. Close all profitable buy orders. Close all profitable sell orders. Hedge orders. 2. Stop Orders Manager (screenshot 1): 2 informative sections: Numer

A trend indicator based on the CCI indicator. ZI Trend PaintBar Indicator is an improved variant of the CCI indicator, which shows the moment of trend following quite accurately. Combination of CCI indicator makes a better use of these advantages: Colored candlesticks showing the trend direction based on CCI indicator. Messages/Sounds (Notifications and sound settings) Mail - enable/disable sending emails. Alerts - enable/disable messages in the terminal when signals occur. Push - enable/disable

This is an implementation of the well known SuperTrend Indicator. With this indicator you can see exactly the same values which will be alerted by the following SuperTrend Scanners:
SuperTrend Scanner SuperTrend Scanner FREE
Parameters SuperTrendATRPeriod: the period setting for the calculation of the SuperTrend SuperTrendMultiplier: the multiplier setting for the calculation of the SuperTrend
FREE
Merlin Grid is a fully automated EA that uses a clever combination of grid, price action, fast scalping, smart filtering and artificial intellect (artilect) to determine profitable entry and exit points into the FX market. Merlin Grid is optimized and backtested over a period of 8 years (2010–2018). Download the free demo version and give it a run yourself. Visit Merlin Grid's blog for set files, news, updates, wish list, etc.
Characteristics FIFO compliance option. Price averaging of same kind

This Expert Advisor is based on a scalping strategy that uses the Bollinger Bands indicator . The Bollinger Bands indicator reflects the price overbought or oversold conditions, which help to identify the entry or exit points as well as possible trend break-downs. The Bollinger Bands consist of an upper band placed above, and a lower band placed below. The distance between the Bollinger Bands or the width of the bands/channels based on the volatility measure. The mechanism of this system is simi
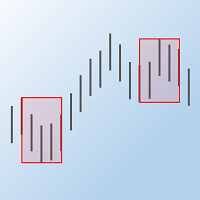
The "Max Min Prices" indicator determines the maximum and minimum prices between two candles within the trading day and shows them as rectangles on the price chart.
Indicator Parameters Start hour – hour of the start candle Start minute - minute of the start candle End hour – hour of the end candle End minute - minute of the end candle Rectangle lines type - style of the rectangle lines Rectangle lines width - width of the rectangle lines Rectangle filling - fill the rectangle with color Colour

This scanner shows the trend values of the well known indicator SuperTrend for up to 30 instruments and 8 time frames. You can get alerts via MT4, Email and Push-Notification as soon as the direction of the trend changes. This is the FREE version of the indicator: SuperTrend Scanner The free version works only on EURUSD and GBPUSD!
Important Information How you can maximize the potential of the scanner, please read here: www.mql5.com/en/blogs/post/718074
With the following FREE indicator you c
FREE

This scanner shows the trend values based on crossovers of two moving averages for up to 30 instruments and 8 time frames. You can get alerts via MT4, Email and Push-Notification as soon as the direction of the trend changes. This is the FREE version of the indicator: https://www.mql5.com/en/market/product/29159
Important Information How you can maximize the potential of the scanner, please read here: www.mql5.com/en/blogs/post/718074
You have many possibilities to use the scanner. Here are tw
FREE

This scanner shows the trend values of the well known indicator Parabolic SAR for up to 30 instruments and 8 time frames. You can get alerts via MT4, Email and Push-Notification as soon as the direction of the trend changes. This is the FREE version of the indicator: Advanced Parabolic SAR Scanner The free version works only on EURUSD and GBPUSD!
Important Information How you can maximize the potential of the scanner, please read here: www.mql5.com/en/blogs/post/718074
You have many possibilit
FREE

This scanner shows the trend values of the well known indicator SuperTrend for up to 30 instruments and 8 time frames. You can get alerts via MT4, Email and Push-Notification as soon as the direction of the trend changes.
Important Information How you can maximize the potential of the scanner, please read here: www.mql5.com/en/blogs/post/718074
You have many possibilities to use the scanner. Here are two examples: With this scanner you can trade a top-down approach easily. If two higher time f

This scanner shows the trend values based on crossovers of two moving averages for up to 30 instruments and 8 time frames. You can get alerts via MT4, Email and Push-Notification as soon as the direction of the trend changes.
Important Information How you can maximize the potential of the scanner, please read here: www.mql5.com/en/blogs/post/718074
You have many possibilities to use the scanner. Here are two examples: With this scanner you can trade a top-down approach easily. If two higher ti

This scanner shows the trend values of the well known indicator Parabolic SAR for up to 30 instruments and 8 time frames. You can get alerts via MT4, Email and Push-Notification as soon as the direction of the trend changes.
Important Information How you can maximize the potential of the scanner, please read here: www.mql5.com/en/blogs/post/718074
You have many possibilities to use the scanner. Here are two examples: With this scanner you can trade a top-down approach easily. If two higher tim

A simple information indicator showing the time left before the opening of the next candlestick or bar.
About the concept of a timeframe A timeframe is the time interval considered in the technical analysis of free financial markets (the same applies to the global currency market), during which the price and other market data change. The smallest timeframe is the so-called tick. A timeframe is the time interval used to group quotes when drawing elements of a price chart (bars, Japanese candlest
FREE

Auto Close is an expert advisor that can assist you with your money and risk management rules. The EA can monitor your Balance, Equity, Margin, Global Profit and Global Loss and alert you in case any of these reaches a specified threshold. Free version with limited features can be found https://www.mql5.com/en/market/product/29179
How does it work Load the Auto Close EA in the chart and set the parameters you want to keep monitored. If any of the risk management parameters is met you can be not
FREE

MQLTA Instrument Details shows you in an easy to read in chart table the details about the instrument/Symbol, including: Label Trade Mode Default Contract Size Minimum Size Maximum Size Size Step Digits Used Tick Size Tick Value Stop Level Bid Ask Spread
Parameters Indicator name to create the objects Default Window when opening the indicator Horizontal offset Vertical offset If you like this tool please take a minute to leave a review. If you have suggestions to improve it please send me a mes
FREE

Script for quickly determining the time offset of your broker's server relative to GMT. For correct operation in the strategy tester, many Expert Advisors require GMT time to be entered in the settings for the terminal where testing is being performed. Developers are forced to enter the GMT offset for testing separately, as such functions are not provided in the tester. This script can help quickly determine the time offset in your terminal relative to GMT.
Parameters Day light saving time for
FREE

Auto Close is an expert advisor that can assist you with your money and risk management rules. The EA can monitor your Balance, Equity, Margin, Global Profit and Global Loss and alert you in case any of these reaches a specified threshold. This Demo Version has Notification and Close features disabled, full version can be found https://www.mql5.com/en/market/product/29141
How does it work? Load the Auto Close EA in the chart and set the parameters you want to keep monitored. If any of the risk
FREE

This is a grid Expert Advisor. It has several trading strategies based on the MACD indicator. The virtual trailing stop, stop loss, take profit levels can be set pips, in the deposit currency or as a percentage of the balance. Depending on the settings, different orders may be opened for diversifying risks. Their closure can be either an oppositely directed or unidirectional basket of orders. The orders grid is adaptive, only market orders are used in it. If the price moves the distance of Order

This is a grid Expert Advisor. It has several trading strategies based on the Bollinger Bands and RSI indicators. The virtual trailing stop, stop loss, take profit levels can be set pips, in the deposit currency or as a percentage of the balance. Depending on the settings, different orders may be opened for diversifying risks. Their closure can be either an oppositely directed or unidirectional basket of orders.
The orders grid is adaptive, only market orders are used in it. If the price moves

This Expert Advisor is based on pivot points. Users can choose entry level and direct themselves. Expert use martingale strategy to recover unsuccessful trades. When going into drawdown it starts its slipping mode in which it always tries to keep the whole set of trades on a steady course level. In hedging mode, all take profits will be deleted and the basket will try to close at breakeven price. EA can also be used as normal with Stop loss. Please test before using with Stop loss. The EA can tr

This indicator visualizes the intersection of two moving averages in the MACD oscillator. It uses the histogram color to signal about the moving averages crossing the zero level of the indicator. The MACD (Moving Average Convergence/Divergence) indicator is a popular oscillator actively used by traders when working in the currency and stock markets to determine trends and to search for trading signals. This linear indicator allows obtaining a variety of trading signals: crossing the zero line; d

This indicator is based on a combination of 2 different SuperTrend, a trend following indicator developed by Oliver Seban. You can find some implementation in the following pages: https://www.mql5.com/en/code/8268 https://www.mql5.com/en/code/10851 and others. Double ST indicator combines 2 different SuperTrends to have the trend direction at a glance. Simply insert the values for the 2 SuperTrends and you will see a ribbon with 3 different colors: red means that price is under both the SuperTre

Trend Control is a trend-following Expert Advisor that determines the trend direction and closes positions only at trend reversals. The EA is equipped with a minimum of the most necessary functions to simplify working with it. The EA is most suitable for working on the EURUSD currency pair and the M5 timeframe. The EA is suitable for both five-digit quotes and four-digit quotes. The EA is equipped with a Stop Loss. The EA does not use any risky systems which increase the volume or increasing the

Uses an advanced grid algorithm with no martingale or limited Martingale (default) (version for MT5: GS grid5 ) . Defines and control the current trend; It switches himself its parameters in accordance with the current market conditions ;
Flexible customizable grid algorithm with or without martingale; Drawdown reduction algorithm (DD Reduction Algoritm); Hedge algorithm; Interactive trade control buttons; The ability to open / close orders manually; News filter to prevent trading during news

Automatic fibonacci with alerts is an indicator that automatically plots a fibonacci retracement based on the number of bars you select on the BarsToScan setting in the indicator. The fibonacci is automatically updated in real time as new highest and lowest values appear amongst the selected bars. You can select which level values to be displayed in the indicator settings. You can also select the color of the levels thus enabling the trader to be able to attach the indicator several times with d

The Expert Advisor has been developed specifically for the features of the CHFJPY currency pair. The EA's algorithm determines the direction of the current trend and starts operation. In case of a price reversal within the current trend, the EA adds additional orders. If trend changes, the EA starts to work in the direction contrary to the initial grid of orders. If there were no conditions for closing orders and the trend direction changed again, the EA continues to work with the "first" grid o

DotaScalping is a semi-automated trading system for scalping. The indicator shows recommended moments for opening Buy/Sell trades as dots on the chart. Signals are generated based on the algorithm for price amplitude smoothing. The indicator tries to accurately calculate the moments of the maximum peak price values and produces signals based on the smoothed correlation. The indicator determines the High and Low price values and generates signals based on the trend direction. The indicator is v
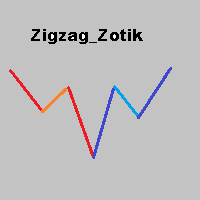
The Zigzag Zotik indicator displays the price movement in the form of a zigzag based on the AO_Zotik indicator values. The Zigzag Zotik indicator displays the trend movements and their corrections. The AO_Zotik indicator consists of three lines moving relative to "0": "main" line; "support and resistance" line; "balance" line. The "main" line crossing the "support and resistance" line indicates the end of one wave and the beginning of the other. The Zigzag Zotik indicator displays this on the ch

CCI 行动专家顾问 是一个强大的工具,旨在自动化 CCI(商品通道指数)策略 ,允许交易者利用 CCI 水平触及。凭借其用户友好的设置和强大的风险管理系统,该 EA 为希望将 CCI 指标纳入其交易方法的交易者提供了可靠且高效的解决方案。 该 Expert Advisor 的主要特点之一是其适当的风险管理系统,可帮助交易者保持对其交易资本的控制。通过指定手数和最大风险占总保证金的百分比,交易者可以有效地管理他们的市场敞口并保护他们的投资。 EA 完全自动运行,根据预定义的 CCI 级别参数执行交易。当达到指定的 CCI 水平时,EA 相应地打开订单,允许交易者利用 CCI 指标识别的潜在市场变动。这种自动化为交易者节省了时间和精力,因为他们不再需要手动监控市场的 CCI 信号。 为了保障利润,EA 交易会自动调整止损水平,随着交易的顺利进行将其移至盈利方。此功能有助于保护收益并确保利润得到保障,同时最大限度地减少潜在损失。此外,隐藏的止损水平通过防止其他市场参与者成为目标而增加了额外的安全层。 EA 结合了基于流行规则的信号过滤,使交易者能够通过将其与特定的 CCI 指标信号对齐来增

This Expert Advisor's main strategy is based on the usage of two kind of indicators: two built-in shifted RSI to measure the asset prices oscillations and a Parabolic SAR to check the prices trends. It combines these indicators signals in order to get stronger signals and ensure the EA will do good trading operations. The second strategy consists of sending a new opposite order against a losing order since it reaches the minimum negative profit defined by the "Minimum Loss Value to Reverse (in c
Stochastic Dashboard is an information panel which allows you to have a global market vision through a stochastic indicator. Stochastic Dashboard analyzes and tracks all the assets you want to invest in. Take advantage of this useful dashboard where you can open in a few seconds the chart and quickly invest in it.
Main features of Stochastic Dashboard Graphical panel that allows you to know the situation of many assets. 7 different stochastic situations to discover when an asset is overbought o

SDX is our latest and most advanced dashboard for manual trading. The app is based on our proven grid platform and offers unique trading opportunities for both experienced and new traders. This unique combination of innovative tools is designed to simplify the trading process and to give you real advantage. The system is ideal for short term trend following, counter-trend trading and scalping on the Forex market.
Main Features Ability to work simultaneously with 10 pairs from one screen. Abilit

This Expert Advisor is based on a scalping strategy that uses Moving Average Envelopes Indicator . The Moving Average Envelopes indicator reflects the price overbought or oversold conditions, which help to identify the entry or exit points as well as possible trend break-downs. The moving average envelopes consist of an upper envelope placed above, and a lower envelope placed below. The distance between the moving average envelopes or the width of the bands/channels based on the volatility measu
Simulator for Risk / Reward ratio calculator We-RiskReward is a MT4 indicator made by the We-Trading team to simulate an order with Risk / Reward calculator.
Horizontal Lines This indicator show you 3 horizontal lines that are: Open line Take Profit line Stop Loss line You can move the lines and you will see R/R and Lots calculation in real time. You can use it to simulate Long and Short positions.
Indicator parameters As input parameters you need to check only the Risk for trade. For e.g. you
FREE

ATR通道 根据海龟交易法则对MT4自带的ATR指标进行了修改,并根据当前K线的开盘价和ATR值生成一个通道。 ATR通道 指标可用来识别市场的超买和超卖条件。
计算方法 通道上轨 = Open + r1*ATR 通道下轨 = Open - r2*ATR
其中: Open为当前K线的开盘价 ATR为当前K线的ATR值 r1,r2为ATR值乘以的比例
设置参数 ATR Period - 设置指标的计算周期,默认周期为14。 ATR Up Ratio - 设置通道上轨r1的值,默认为1.0。 ATR Low Ratio - 设置通道下轨r2的值,默认为1.0。
如何交易 基本上 ATR通道 指标是用来识别市场的超买和超卖条件的,当市场价格突破通道上轨,市场处于超买条件( 卖跌 区 ),相反,当市场价格突破通道下轨,市场处于超卖条件( 买涨区 )。 注意 : 当持仓止损出局后,下一笔交易避免在同一个方向开仓。 例如: 当价格突破上轨后,你卖出一单,然后这单止损出局,之后市场价格再一次突破上轨,此时应避免开空仓,应耐心等待价格突破通道下轨后开多仓。
FREE

This panel is designed for quick visual search for the price action patterns on several instruments simultaneously. It is possible to add and remove instruments. Clicking the signal button allows you to quickly move to the chart with the identified pattern and timeframe. The panel searches for 8 candlestick patterns: PIN-BAR, EXTERNAL BAR, INSIDE BAR, DOJI, LEVEL, HIGH/LOW OF N BAR, FAKEY, ONE-WAY N BAR. Any of the patterns or the periods can be disabled by clicking its title. It can also search
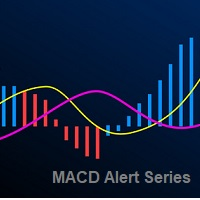
The Moving Average Convergence Divergence Indicator (MACD) is both a trend–seeking and momentum indicator which uses several exponential moving averages set to closing prices to generate trading signals. We added several types of alerts to aid in your search for better opportunities in the market.
Product Features Email Alert Sound alert Push Notification (Alerts can be sent to your mobile phone) Signs on chart Alert box Possibility to work with both histogram and visual line Alert on zero hist
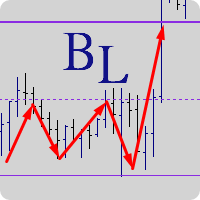
"Balance cost" analysis method Created by Trader AFI_man. The BalanceLines indicator plots balance levels for a given time interval. The balance line divides the market volume into sellers (above the balance level) and buyers (below the balance level). In any movement, if the price is fixes above the balance level, there comes a moment when sellers are unable to hold off buyers, which leads to a growth. Similarly, when the price is fixed below the balance level, there comes a moment when buyers

This is a short-term scalping Expert Advisor making a small number of trades. The EA follows the price using BuyStop and SellStop orders at a fixed distance and catching fast movements of currency pair quotes. It has a minimum number of adjustable parameters.
The robot is ideal for a trader as an addition to a manual strategy or in conjunction with another EA. The EA distinguishes its trades by a magic number. Pending orders, like market ones, are not left for weekends and are closed 10 minutes
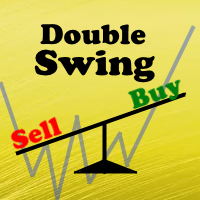
The Expert Advisor's operating algorithm is based on a priori known truth 'The price does not stand still'. We add math and logic to this truth and receive an Expert Advisor, which allows catching almost all the movements in the market. When an order is opened, a breakout Stop order of a larger volume is set instead of Stop Loss. If the price reaches this order, another pending Stop order of a larger volume is placed. This approach is called Swing or Pendulum Swing . Double Swing uses this appro

Schrodinger trading machine is an Expert Advisor (robot) for any financial instrument on MetaTrader 4 platform. Both main input parameters (N and M) are optimized for EURUSD H1 . Of course, you are able to optimize these parameters for any currency pair and timeframe. For example, the main input parameters for GBPUSD H1: N = 5.0 and M = 12 The main input parameters N and M can be any positive numbers. These are input parameters (weight coefficients) of the one layer neural network. N is a double

This indicator calculates and draws lines over the chart. There are two types of trends: Trend A: the line is drawn using local lows for uptrends and local highs for downtrends Trend B: the line is drawn using local highs for uptrends and local lows for downtrends There are a few conditions, which have to be fulfilled and can be changed by the parameters (see also picture 4): MinBarAge : the count of bars to the last base point of a line is called BarAge and has to be greater than the parameter
FREE

This Expert Advisor is designed for working with all major currency pairs on all timeframes (M1-D1). Micro Martingale is a flexible concept of Martingale, which can work as Full Martingale (Average closing) or Martingale combined with trailing, stop loss and take profit, depending on parameter settings. Orders are triggered based on mathematical algorithms of price correction/reversal. The Expert Advisor will work better during high fluctuations.
Warning Martingale System is at high risk. For t

SFO Trend Racer system is a trend indicator created by the CEO and Founder of " Simple Forex Options ", Tevin Marshall . It serves 6 different functions all in one. It shows the trader the entry signals as well as exit signals, whether it is a take profit or a stop loss. It also uses trend filters and signal confirmations so that the trader is able to make the most logically fit decision. Trend Racer uses various filters and specific settings from a plethora of indicators. The beauty in this ind

This specific indicator is designed to solve one specific problem : In case the connection to the broker's server is lost, remember when the connection was lost, and at what time the connection was resumed. Thus, the user sees the time when there was no connection to the broker's server . An Alert box is displayed on the screen, which records when the connection was lost and resumed. Of course, the indicator will not react to slight losses of packets. For better visualization of the indicator op

There are time periods in the market, when trading is highly likely to be unprofitable. This indicator warns you about such non-trading situations and helps you preserve your money and time.
Parameters Remind about non-trading periods: Expiration week - remind about the expiration week Consumer index day - remind a day before the release of Consumer index day NON FARM - remind a day before the release of NON FARM Christmas - remind a day before Christmas New Year Days 25.12 - 15.01 - remind abo
FREE
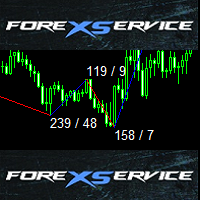
This is standard ZigZag indicator with some cool additional features - colored range, amount of pips between highs and lows and also amount of candles between indicator range.
Default ZigZag indicator variables depthZigZag deviationZigZag backstepZigZag
Bullish market variables lineUpColor - line color lineUpStyle - line style lineUpWidth - line thickness textUpColor - color of text with amount of pips and candles textUpFont - font of text with amount of pips and candles textUpSize - size of t

This Expert Advisor identifies trend reversals based on fractals and some other indicators. It is a free lite version of Three fractals Brief description of the trading strategy: when the fractals were formed after a prolonged fall, and the last fractal did not update the minimum of the previous bar's lower fractal, then a trend reversal is determined (at the same time, there must be a fractal in the middle, which is higher than the others). Similarly, opposite for growth. In case other indicato
FREE
This is a grid Expert Advisor. It features several trading strategies based on Moving Average. It works on minute bar Open prices. Virtual trailing stop, stop loss and take profit can be set in pips, in the deposit currency or as a percentage of the balance. Depending on the settings, different orders may be opened for diversifying risks. Their closure can be either an oppositely directed or unidirectional basket of orders. The order grid is adaptive and is made of market orders. If the price ha

TSO Bollinger Bandit Strategy is an indicator based on the Bollinger Bandit Trading Strategy as presented in the book Building Winning Trading Systems with TradeStation by G. Pruitt and J. R. Hill. SCANNER is included . Now with Scanner you can find trading opportunities and setups easily and faster.
Features A complete entry and exit strategy for trending markets. Get email / push notifications when an entry signal occurs. The indicator is not repainting. Can easily be used in an EA. (see For

The Momentum Channel indicator works according to the daily price index. The indicator is used to analyze the parity price. This analysis is done through channels. channels are used to find trend return points. The indicator has 3 channel lines. these are the lines at 30, 50, and 70 levels. The 70 level is the overbought territory. Price movements in 70 and above indicate that the chart will fall in the near future. Price movements at 30 and below indicate that the chart will rise in near future
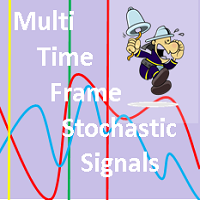
This indicator is based on the Stochastic on one or more timeframes and on any Currency Cross Pair. The indicator generates an alert message when it detects a buy or sell signal. It also draws a vertical bar on the price chart: green for buy or red for sell, yellow if flat. Alert messages and Vertical bars for BUY or SELL, are generated when the Stochastic is consistent for all chosen timeframes else a FLAT signal is generated.
Features Easy flexible settings: Detection of the Stochastic signal

InvestorPRO is a stable Expert Advisor for professional traders. The EA trades in a fully automated mode. The trading algorithm of the EA is based on analysis of numerous factors that affect the dynamics of an instrument. This EA has been created to provide the trader with a comfortable environment for investment in the financial instruments of the Forex market.
The EA is installed in the usual way and is suitable for trading any trading symbols. The EA is designed for trading on the D1 timefram
The Average Daily Range shows the dynamic levels of average pip range on a pair measured based on the daily Highs and Lows over a certain periods. You can use the ADR to visualize potential price action outside the average daily move. When ADR is above average, it means that the daily volatility is higher than usual. The ADR can be helpful in setting targets for positions. If the ADR shows you that a pair has an average daily range of 80 pips, then it might be wise to tighten up your target

Compas - is a fully automatic intraday trading robot, that trades mainly in the Pacific session. The EA Compas is safe and trades one order with a fixed Stop Loss. EA Compas is suitable for investment accounts that require reduced risks. The performance of EA Compas should be evaluated over long distances.
The default settings are for GBPCAD M1
Setting For the operation to be correct, follow the instructions: To download the news list, it is necessary to add http://ec.forexprostools.com to th
GUME Simple Entry indicates the buy and sell entry points of all instrument by analyzing the market movement. It is designed to indicate entry points for any currency pair and all trading periods. It is optimized for M5 for scalping and M15 and higher periods for long term trading. It is also optimized for EURUSD, GBPUSD, GBPJPY, EURJPY and XAUUSD. It is designed to display a colored arrow up or down for buy or sell signal respectively for convenience and ease of use.
Indicator Parameters time

该指标显示其他(和非标准)时间范围的最高价/最低价/开盘价/收盘价 - 年、6 个月、4 个月、3 个月、2 个月、月、周、日、H3-H6-H8-H12 小时 。 您还可以设置打开蜡烛的班次并构建虚拟蜡烛。 这些时间范围之一的“周期分隔符”以垂直线的形式提供。 可以针对当前或先前水平的突破(突破昨天/上周的高点/低点等)配置警报。 您还可以将所有级别向右移动一个周期。 也就是说,当前周期将显示前一周期的最高价/最低价。
参数 Number of levels to calculate (0-all) — 屏幕上将显示多少条。 Change the opening of bars (hours) — 将蜡烛的开盘移动 n 小时。 该指标将根据新的开盘时间绘制虚拟柱。 MN1 以上的周期不会改变。 Move the levels to the right — 将所有级别向右移动一格。 您将看到当前蜡烛的先前水平。 Period Separator (vertical lines) — 显示垂直线、周期分隔符。 Show High Lines (trigger for all hig
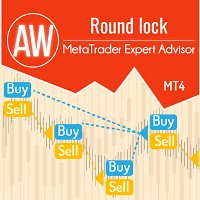
The EA opens two bidirectional orders. When one of them is closed in profit, two orders are reopened, the volume of orders increases depending on the volume of multiplication and the number of orders opened by the advisor. In each new open pair, orders are opened with equal volume, locking each other. The opening of pairs continues until the number of orders of the same type reaches the number of Limit_for_orders, then the EA will only increase the grid, excluding locking.
MT5 version -> HERE
MetaTrader 市场 - 在您的交易程序端可以直接使用为交易者提供的自动交易和技术指标。
MQL5.community 支付系统 提供给MQL5.com 网站所有已注册用户用于MetaTrade服务方面的事务。您可以使用WebMoney,PayPal 或银行卡进行存取款。
您错过了交易机会:
- 免费交易应用程序
- 8,000+信号可供复制
- 探索金融市场的经济新闻
注册
登录