适用于MetaTrader 4的新EA交易和指标 - 262
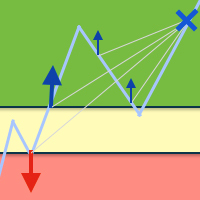
The Expert Advisor helps reduce the account drawdown. To do this, the losing deal is split into multiple small parts, each of these parts is closed separately. The EA can interact with other experts. For example, when a certain drawdown is reached, Open Lock can disable the other expert and start working with its orders. Open lock for MetaTrader 5 is available here
Methods used by the EA Locking to prevent a drawdown increase Averaging orders used to cover the loss Partial closure to reduce th

The balance of supply and demand is a simple and effective market analysis method. The supply and demand diagram can show you in advance, even before the trend reversal, where the supply ends and the demand is already emerging, where the demand ends and the supply is emerging, while substantially increasing the probability of making a deal in the right direction and with a high profit factor.
Indicator Signals The indicator uses the price/volume values to generate signals: ED – excess demand.

Mind Wave Trading Simulator is a training/trading utility for MetaTrader 4 that runs in both tester and real trade modes. It extends MetaTrader 4 functionality and makes trading easier in both tester and real trade modes. When used in the MetaTrader 4 tester, it offers traders an opportunity to practice and train their manual trading skills in accelerated speed. No need to wait for hours and days in real time demo trading to evaluate some manual trading strategy.
Features that extend MetaTrade

A robot is designed for trading on a real account. The robot trades inside a channel formed by Bollinger bands. Trades are only opened with trend, near the border line of the channel. Take Profit is set at the opposite side of the channel. Deals are always by stop losses.
Trading Strategy Characteristics The robot calculates the channel formed by Bollinger bands. Market entries will be made near the channel borders if there is a sufficient gradient. Profit is fixed on the opposite side of the

i-Orders is a simple indicator to monitor your own trade/analyze others' trades. I use it for a long time and do not imagine a chart without these arrows, lines and trade result numbers. The features allow you to:
disable display of opened and closed positions ( Show OPENED , Show CLOSED , Show PENDING ), change colors of arrows and lines for profitable and loss-making buy and sell positions separately ( Color for profitable/ losing BUYs/SELLs ), change style and width of the lines connec

Link several charts to each other to create a chartgroup. Used for rapid analysis of markets/symbols on multiple timeframes. ChartGroup is implemented as a MetaTrader indicator. When the indicator is applied to several charts they share either the same Symbol or Timeframe, depending on the setting of the single Input-Parameter "mode". You can create one group sharing the same symbol and one group sharing the same timeframe/period at one point in time. The number of charts for a group is not limi

Parabolic Oscillator is based on Parabolic SAR and Stochastic Oscillator indicators. The Parabolic SAR determines the main direction of the trades (opens and leads one position at a time between reversal points) and next positions are added on the basis of the Stochastic Oscillator (used in a non-typical for this indicator method).
Additional modules LOT_PROGRESSION - increases the STOCHASTIC_LOT value for each subsequent position by the smallest possible step starting from the base value. Thi
The Funicular is a functional indicator knowing all the rules of the market and performing constructions more accurate and faster than any professional analyst. The Funicular helps you see the exact points of the "entrance", and it draws trends with great accuracy determinig their strength and fluctuation time. The main difference from the others is that it builds lines that are independent of timeframe allowing you to perceive the chart as a whole. Simply put, you need The Funicular, because i

注意 :商品的点差和经纪商滑点以及VPS的速度,对EA交易的结果都有一定的影响。建议黄金点差3.0,美日点差1.7,欧美点差1.5,如果低于以上数值效果更好。所租用的VPS到经纪商的服务器ping值最好在10ms以下。另外要求经纪商的最小止损位置越小越好,0是最佳。 此EA是一款箱体突破型的交易系统,对进场的每单都有仓位控制,在单子入场后的处理方式有两种:可选追踪止损或保护止损,以下图片中都包括了测试过程的时间段、经纪商点差、商品名称、EA所使用的参数;更重要的是包括起始资金、最终盈利、胜率、盈亏比等重要值得参考的信息,所以请仔细查看以下图片。另外最后三张收益小点图片的参数比较适合经纪商滑点比较大的平台,可供参考。 参数: MaxSpread -所允许商品的最大点差,如果超过这个值挂单会删除,并暂停 stoptime分钟时间, 建议XAUUSD-100,USDJPY-50,EURUSD-50 stoptime -如上说明:点差拉大时休息的时间,10表示休息10分钟。 Inp -技术指标参数,一般为整数值,可以为12、18、24等 TimeFrame -加载所在图表周期,建议
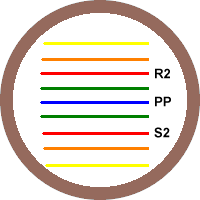
This indicator was created to determine the overall trend of the market. Pivot points are support/resistance level areas, at which the direction of price can change. Many people are looking at those Pivot Point levels, which causes the levels to become almost self-fulfilling. Use this indicator to identify reversal points, so you can place your orders or combine it to recognize key price levels that needs to be broken to take a good breakout trade. With this indicator, its easy to find important

The script displays info about the share's corporate reports and dividends. The data is downloaded from investing.com : Report date Profit per share (EPS) Revenue Market capitalization Amount of dividends Date of payment of dividends Dividend income The product cannot be tested in the tester (since it is not possible to receive data from the Internet).
Before launching: Add 2 URL https://ru.investing.com/earnings-calendar/Service/getCalendarFilteredData and https://ru.investing.com/

Vino EA is a grid expert advisor using mainly customized oscillators to analyze the market prices and volatility in order to identify trend reversals. It uses a grid of orders which increases the lot size only after the stop loss is reached. Grid size can be limited for more safety.
Requirements Default parameters has been optimized for EURUSD with timeframe M15 Minimum recommended deposit is $1000 for initial lot set to 0.1 ECN broker with low spread is recommended to get better results. Comp

Your problem Are you tired of navigating your way through menus and hunting for tool bars to change currency pairs or time frames? Do you hate having to open and close several charts to get a 'feel' of what a currency is doing? Don't you wish you could just click your mouse and quickly navigate through the currency pairs and time frames that you use the most?
My solution The Jimdandy Navigator will allow you to quickly customize your own navigator panel. You can select only the currencies, cfd

Cybernetics EA is a fully automated Expert Advisor. That is a medium-term trend follower.
Our EA has been created to work confidentially. So, it can close orders with actual account currency value at profit or loss. Also works with stop loss. The EA's strategy has been improved to make reasonable and low-medium risk profit. But, you can also increase your risk, although we do not recommend doing that.
The EA's logic is little bit complicated. However, easy to use. Most of settings are set by

This Expert Advisor focuses on trading breakouts of fix defined structures during the opening in Europe. Similar patterns lead to similar results. TakeProfit and StopLoss are calculated and set by the robot for each position based on the current volatility. For risk minimization the Stop gets trailed once before reaching the target. therefore there are three different ways a trade can result: TakeProfit, StopLoss & TrailingStop. This fact makes it easy to analyze and calculate all positions of t

Secret Scalper EA is a fully automated Expert Advisor. The EA is a medium-term scalper. Our EA has been created to work confidentially. So, it can close orders with actual account currency value at profit or loss. Also works with stop loss. The EA's strategy has been improved to make reasonable and low-medium risk profit. But, you can also increase your risk, although we do not recommend doing that. The EA's logic is little bit complicated. However, easy to use. Most of settings are set by the E

The Smart Averager Expert Advisor is the cost averaging system. The EA algorithm is based on the following principle: the Expert Advisor finds the trend section based on the specified parameters. Then it finds the moment when the price starts to gradually turn against the trend. The EA makes the first entry. Further, if the price continues to move in the trend direction, the EA opens additional positions based on the same algorithm. Profit of all positions is fixed after reaching the specified r

The YFX Symbol Selector indicator is used to easily change the chart symbol and period with a click of a button. This is done by using a selector GUI object that can be placed on any corner of the chart. The GUI selector contains the following information: Descriptive header for GUI selector panel Symbol information and controls for changing the chart symbol Period information and controls for changing the chart period Footer containing the current bid/ask quote for the currently selected symbol

Exclusive Bollinger is a professional indicator based on the popular Bollinger Bands indicator and provided with an advanced algorithm. Unlike the standard Bollinger , my Exclusive Bollinger provides better signals and is equipped with flexible settings allowing traders to adjust this indicator to their trading style. In the indicator, you can set up alerts (alert, email, push), so that you won't miss a single trading signal. Exclusive Bollinger for the MetaTrader 5 terminal : https://www.mql5

MA Crossover Arrows is a simple indicator that draws arrows and alerts when two moving averages crossover.
Supported types of moving averages Simple Exponential Smoothed Linear Weighted
Supported Price types Close Open High Low Median Price (HL/2) Typical (HLC/3) Weighted Close (HLCC/4) When the fast moving average crosses above the slow moving average, a green up arrow will appear on the chart. When the fast moving average crosses below the slow moving average, a red down arrow will appear
FREE

The Moving Average Slope (MAS) subtracts the moving average level n-periods ago from the current moving average level. This way, the trend of the moving average can be drawn on the moving average line.
Features Observe uptrends and downtrends at a glance. The indicator is non-repainting. Returns buffer values for the trend of the moving average to be used as part of an EA. (see below)
Inputs Moving Average Period : The period of the moving average (MA). Slope Period : Number of periods betwe
FREE

Stochastic RSI makes a stochastic calculation on the RSI indicator. The Relative Strength Index (RSI) is a well known momentum oscillator that measures the speed and change of price movements, developed by J. Welles Wilder.
Features Find overbought and oversold situations. Sound alert when overbought/oversold level is reached. Get email and/or push notification alerts when a signal is detected. The indicator is non-repainting. Returns buffer values for %K and %D to be used as part of an EA . (
FREE

The Choppy Market Index (CMI) is an indicator of market volatility. The smaller the value of the indicator, the more unstable the market. It calculates the difference between the closing of the last bar and a bar n periods ago and then divides that value by the difference between the highest high and lowest low of these bars.
Features Easily separate trends from the market noise The indicator is non-repainting. Returns CMI values through buffer. (see below)
Inputs Period: The number of perio
FREE
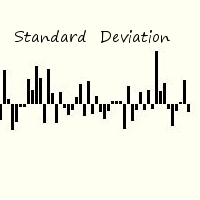
Standard deviation of returns is a popular way to view how the return of one bar relates to history. By knowing that you can better understand the magnitude of any return. The signal is calculated by taking the prior periods returns, adjusting for volatility of the returns of the last twenty periods, and dividing by the standard deviation. It is displayed in a separate panel as a histogram.
FREE
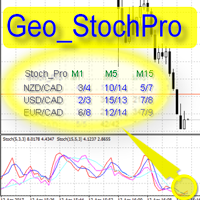
Geo_StochPro is a profile, or professional Stochastic. Geo_StochPro is one of the well-known currency profile indicators. It displays two Stochastic indicators on all timeframes and multiple currency pairs forming the currency profile in the matrix form simultaneously . Thus, you can see the current state of the selected instrument as well as other pairs containing that instrument (overbought/oversold) without switching timeframes. The indicator is perfect for scalpers, intraday and medium-term
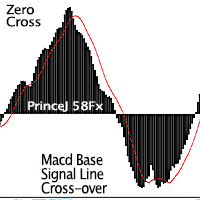
Purpose : Used as a tool for Traders and Investors This product is a Macd alert Indicator, which gives two (2) sets of Alerts: Main line and Macd Signal line cross over for early indications of retracements or trend change above or below. While the zero cross is the flipping over effect of the histogram to the opposite side of the zero line, which can be seen on the standard Macd Oscillator. Regular Arrows: Up and down arrows shows the cross over Of the Signal Line and Main Line from above for
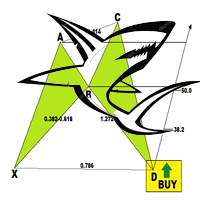
The Shark Pattern is dependent upon the powerful 88.6% retracement and the 113% Reciprocal Ratio, works extremely well retesting prior support/resistance points (0.886/1.13) as a strong counter-trend reaction. Represents a temporary extreme structure that seeks to capitalize on the extended nature of the Extreme Harmonic Impulse Wave. The indicator demands immediate change in price action character following pattern completion. Extreme Harmonic Impulse Wave utilized depends upon location of 88.6
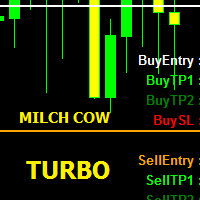
MILCH COW Turbo EA is primarily a multi-currency strategy. It supports 9 or 10 pairs as collection of currencies (GBPJPY, GBPUSD, EURCHF,EURGBP, EURJPY, EURUSD, USDCAD, USDCHF, USDJPY). If you choose Trade_Calc = false, only one pair is turned on. The EA depends on a special indicator to set Buy stop, Buy limit, Sell stop and Sell limit orders Note: If enabled Pendingorders = false, the EA will use the prices shown on the chart in live orders (buy and sell). In this case, the EA uses stop loss a

The Expert Advisor determines the moments of strong movements and opens a position in the direction of the most probable price movement. The strategy always uses stop loss and take profit. Several independent orders can be in the market (the maximum number is set in parameters). The goal of the EA's underlying trading system is the quantitative excess of the number of profitable deals over the number of losing ones. Recommended: EURUSD 5m; GBPUSD 5m; USDJPY 5m. The Expert Advisor is able to work
This indicator was created to detect possible changes in direction of the market. Inside bars points to a certain level of indecision coming into the market. Neither side, buyers and sellers, have been able to push the price further up or down resulting in indecision. We can use this indicator to monitor for inside bar setups and having the indicator signaling the setup to the trader by alert, notification, it provides the trader with a starting point for his/her trading plan. The validation for

Bollinger Bands Color is different from the conventional indicator by an additional set of parameters. Such parameters as color and applied price can be selected in the properties window for each line separately. Also, you can select the averaging method for the middle line.
Parameters
Period – period of averaging for the indicator calculation; Deviations – number of standard deviations from the main line; Shift – shift of the indicator in relation to the price chart; Method Middle Line – mid

This indicator combines double bottom and double top reversal chart patterns together with RSI divergence detection.
Features Easily detect strong reversal signals Allows to use double top/bottom and RSI divergence signals combined or independently. Get email and/or push notification alerts when a signal is detected. Custom colors can be used The indicator is not repainting Can easily be used in an EA (see below)
Inputs ENABLE Double Top - Bottom: Enable the double top - bottom indicator ENA

A visually-simplified version of the RSI. The Relative Strength Index (RSI) is a well known momentum oscillator that measures the speed and change of price movements, developed by J. Welles Wilder. Color-coded bars are used to quickly read the RSI value and history.
Features Find overbought and oversold situations at a glance. The indicator is non-repainting. The indicator can be easily used as part of an EA. (see below)
Basic Strategy Look for shorts when the indicator is overbought. Look f
This Is An Oscillatory Indicator Which Has OnlyTwo Lines: Main Line - The calculation for this value is based upon the open, high, low and close prices of chosen input parameters (within the set periods.) Signal Line - The Calculation for the signal line is based on the addition (& multiplication) of several moving averages of the Father, Son & Holy Spirit Periods (all applied to the main line's value).
Input Parameters Please Note that by way of combination, each input parameter plays several

Background The Expert Advisor has been designed and tested using precise mathematical calculations and has a good potential for multi-currency trading. The Expert Advisor defines the most probable price chart movement areas and opens a grid of Buy or Sell orders. Orders are closed by averaging. My account monitoring: https://www.mql5.com/en/signals/author/mizrael
Advantages Low drawdown and deposit load. Not affected by slippage and server delays. Not affected by spread. Suitable for a rapid

This is a simple risk/reward setter. You enter your TP and SL in the currency amount and it sets it for you, you set your targets in money (not in pips), it helps beginners who are still learning about risk/reward ratios to set their risk/reward based on their capital or amount of money. For example, if you want to risk $3 to make $10, you just fill it in and it sets your order targets accordingly. You can set the TP and SL per chart or all opened charts only. Please make sure your targets are r
FREE
Spread Monitoring is a unique product for analyzing a spread. Unlike most similar indicators, Spread Monitoring uses ticks rather than bars allowing you to detect abnormal spread expansions. Features
Works on ticks rather than bars. Simple and easy indicator configuration. Works on all timeframes. Works on any financial instrument. No repainting.
Parameters
Total - number of displayed ticks. clrSpread - indicator line color.
FREE
MACD Swing Low Multi Time Frame Indicator is one of the most advanced indicators based on both Swing Low and MACD trading strategies. It supports multiple timeframes, i.e. by attaching the indicator on a single chart, one can see the MACD Swing Low values for all the other timeframes on a single chart. One would just have to select the timeframes, for which he wants to see the calculated values.
Features On the chart, one can set the option to view the MACD Swing Low calculated values and the
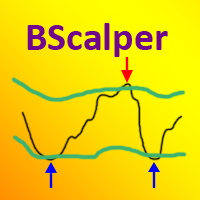
The BScalper Expert Advisor is a flexible tool for searching and exploiting the regularities of the flat market conditions.
Advantages and features The EA has a high speed of optimization and testing. Each trade involves a stop loss. The EA does no use hedging, martingale, grid and other risky strategies. Suitable for various financial instruments. Entries and exits are performed at market. The Expert Advisor is based on the Bollinger Bands indicator. The EA gains advantage of the time periods

This trading system searches for prospective levels of large limit buyers and sellers. No indicators are used. VSP is required for flawless operation, the recommended minimum deposit is 1000 units of the base currency. The EA is to be used on highly liquid currency pairs with a small spread/commission (for example, EURUSD, GBPUSD, AUDUSD, USDJPY, USDCHF, USDCAD, NZDUSD, EURJPY, EURGBP and EURCHF). Features Customizable pyramiding, hedging and order grid functions; Position tracking can be one of

The entry signals are based on steady price movement for a certain distance within a specified time interval. VSP is required for flawless operation, the recommended minimum deposit is 1000 units of the base currency. The EA is to be used on highly liquid currency pairs with a small spread/commission (for example, EURUSD, GBPUSD, AUDUSD, USDJPY, USDCHF, USDCAD, NZDUSD, EURJPY, EURGBP and EURCHF). Features Customizable pyramiding, hedging and order grid functions; Position tracking can be one of
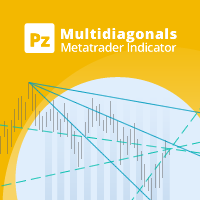
This indicator connects past price points drawing diagonals and trend lines, which converge in the future creating hidden reversal points. [ Installation Guide | Update Guide | Troubleshooting | FAQ | All Products ] Find hidden reversal points Spot convergence zones easily Dense criss-cross zones are reversal points Configurable amount of lines and price points Configurable colors
How to use the indicator The indicator draws several lines on the chart, and where many of these lines converge a
FREE
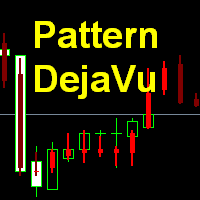
This indicator predicts the nearest candles of the chart based on the search of up to three best coincided patterns (a sequence of candles of a given length) in the history of the current instrument of the current timeframe. The found patterns are aligned with the current pattern at the opening price of the current (last) candle . The predicted candles are candles following immediately for patterns found in history. Pattern search is performed once every time a new candle of the current tim

Entry Arrow Alerts: Finds market entry opportunities then notifies you via mobile or desktop alerts The key features include: Conservative mode . One entry signal per direction. Ideal for the patient trader looking to capture longer term moves. Aggressive mode . Multiple possible entry signals per direction. Ideal for the active trader looking to capture multiple moves within the same trend. Trigger Line . Price entry line helps cut down on false signals. Display Window . Allows you to instantly
This indicator works on the binary options It uses stochastic strategy to indicate the upcoming trend of the market This indicator helps traders to place a trade with the prediction involved on the stochastic strategy. This indicator makes use of the symbols to indicate the prediction regarding the order.
Symbols The upward symbol predicts the trend going up, so that traders can place trades accordingly. The downward symbol predicts the trend going down, so that the trader can place trades ac
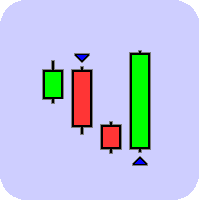
This indicator was created to spot potential reversals in the market. It will help you find the edge while trading which is required to be profitable. The indicator does what its good at, processing data objectively and presents you with the results once a new setup has been formed. It can send you a notification or email and such, so you are not required to follow the market every move. This, coupled with the edge it gives, give you the time and rest to take the appropriate action. The Engulf
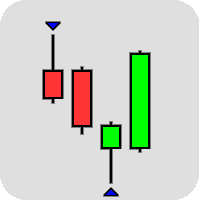
This indicator was created to spot potential reversals in the market. The Pinbar, or Pinnochio Bar, pattern is a a great candlestick pattern which can yield good trading results if traded properly. The idea behind this pattern is that price tries to trick us into thinking the wrong direction. When a Bullish Pinbar for example has formed, it tries to convince us price is going higher but in reality price is going down at the end of the bar. These patterns can be powerful reversal signals when use
Fractalicious shows Fractals of any length, higher or lower highs and lower of higher lows, the fractal channel and the breakout of the channel. Fractals are an important trend and price action pattern. Fractalicious can be used on any timeframe and symbol.
Settings Fractalicious default settings are good enough most of the time. Feel free to fine tune them to your needs. Show last fractal - Set to true to show fractals from the last completed bar. (This could move the fractal if the current b
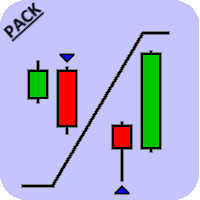
This is a pack which contains both the Engulfing Scanner as well as the Pinbar Scanner . The indicator comes with several sorts of alerts which makes it easy for a trader to wait for a pattern to be formed, have it signaled and then check the chart to see what the bigger story tells you.
Pinbar Scanner The Pinbar, or Pinnochio bar, pattern is a a great candlestick pattern which can yield good trading results if traded properly. The idea behind this pattern is that the price tries to trick us i

或者 ( BD% ) 这是一个波动率指数,以百分比而不是点来衡量波动率。 BD% 的想法是根据在 0% 和 100% 之间移动的经典标准偏差 (CSD) 创建一个索引。
您可以使用 BD% 来比较同一证券在不同时间段或不同时间范围内的波动率。此外,您可以使用 BD% 以百分比而非点数来比较不同市场中不同证券之间的波动率。
如何使用“BD%”
如果 BD% 低于 90%,然后向上越过该水平,则表明价格可能在区间内波动。 如果 BD% 高于 90%,然后向下穿过该水平,并且价格已经高于其简单移动平均线,则这是新的上升趋势开始的迹象。随着 BD% 进一步下行,波动性和趋势强度正在增加。当 BD% 为 0% 时,这意味着波动率处于最高值。 如果 BD% 高于 90%,然后向下穿过该水平,并且价格已经低于其简单移动平均线,则这是新的下降趋势开始的迹象。随着 BD% 进一步下行,波动性和趋势强度正在增加。当 BD% 为 0% 时,这意味着波动率处于最高值。
要了解有关 BD% 的更多信息,请从此处阅读用户手册: https://www.mql5.com/en/blogs/

Metatrader 4 的这个指标识别价格和振荡器/指标之间何时出现背离。它识别看涨和看跌背离。它有一个 RSI 过滤器选项,可以只过滤掉最强的设置。该指标还提供了等待 Donchian 通道突破或价格穿过移动平均线(见屏幕截图 3)以在发出交易机会之前确认背离的选项。结合您自己的规则和技术,该指标将允许您创建(或增强)您自己的强大系统。 特征
在结束时 产品的博客 您将能够下载使用 iCustom() 函数从指标中检索交易信号的示例智能交易系统 (EA) 的源代码。尽管 EA 功能齐全,但主要目的是使用代码并将其粘贴到您自己开发的 EA 中。 摹 伊芬我有限的时间 不过,我将无法提供任何编程支持。 我很抱歉 。
可以检测以下振荡器/指标的背离:MACD、OsMA、随机指标、RSI、CCI、RVI、Awesome、ADX、综合指数、ATR、OBV、MFI 和动量。只能选择一个振荡器/指示器。 为常规/经典(潜在逆转)背离绘制实线,为隐藏(趋势延续)背离绘制虚线。线条绘制在图表和指标窗口中。 当检测到背离或突破/交叉时发送警报。支持所有 Metatrade

Background The Expert applies the martingale principle. The main task was to reduce drawdown and obtain a balanced chart by trading on 4-6 charts simultaneously. Monitoring of my accounts: https://www.mql5.com/en/signals/author/mizrael
Recommendations The EA is recommended for use on 4-6 currency pairs. It is recommended to trade pairs with 4 or 5 decimal places. Using pairs containing the JPY currency is not advisable. The Step parameter is determined experimentally. In general, when trading
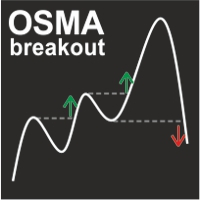
OSMA Breakout indicator displays signals formed at the time of overcoming the previous extremum of OSMA while simultaneously forming the extremum point on the price chart. If the extremum of the previous wave is punched, but the price remains in flat (in a narrow range), the signal is not displayed. This approach allows you to reduce the number of false signals in a long trend and the divergence of the indicator. The indicator works on any trading instrument and timeframe.
Parameters Fast EMA

Fully automated and safe medium-term multicurrency trading robot based on a strategy consisting of several standard indicators. The LockerStop parameter activates the virtual protective stop logic. If LockerStop is not zero, and the loss of an open positions is greater than LockerStop , the EA opens an opposite protective position. The closure of two positions is based on interval virtual stop logic. It is recommended to use the H1 timeframe and the following currency pairs: EURUSD and GBPUSD. C
FREE

This utility was designed for those traders who usually have several charts open at the same time. Rather than having to individually change the timeframe on each chart you can drop the "timechanger" on one chart and then with the simple press of a button, change the timeframe on all charts simultaneously. This will enable the trader to go through his charts much more quickly as he studies the markets. Of course you must be careful if you have experts or indicators that are timeframe dependent r

The indciator helps you find a broker with the best spread. This is a tool for monitoring a spread continuously on the chart. The tool records the spread value on each bar and re-draws the chart line in the bottom window. The best feature of the tool is that it recalculates the percentage and re-draws the bar chart of each spread value to identify the spread values that appear most during the monitoring period. In addition, the tool saves the diary into the csv file. Please watch the instruction

The indicator plays sound alerts when the price reaches certain levels, specified by trader. You only need to draw a trendline and then press the alert button in the panel. The texts of the notification you determine. Notification via a smartphone or email address is possible. Note for "Free Demo" : MetaTrader 4 does not support displaying an alert window or playing sounds in the strategy tester, only in live or demo accounts.
How it works Draw a trendline Click the "Alert" button (Trendline

This indicator will show Buy (color Aqua) or Sell (color Magenta) arrow at the moment when a Long or a Short local trend (local to the current TimeFrame) is expected. The huge advantage is that the indicator does not have any input parameters. So, you will not waste your time and will not struggle to change them for different TimeFrames and currency pairs. This indicator is universal, but it will work better on H1 and lower TFs.

The 'OHLC Breakz ' indicator was developed to show breakouts of reversals with custom price action patterns. The arrows show price action of reversal conditions with trendlines which indicate long term trend formations.
Key Features Custom price action pattern indicating a reversal/breakout from the prior bar. There are visual options available as well as modes which are all non-repaint. Non-repainting signals presented at the beginning of a new bar and at bar 0. Showcasing support & resistanc

This panel is a one stop solution to all your trading problems Trading made easy. This panel allows trader to place orders (instant or pending) and close the respective orders (ALL, PROFIT, LOSS) just from one panel Traders can use it to make any type of trade on the chart itself
Description Close Order All - close all open orders. Profit - close profitable ones. Loss - close loss-making ones. Select Order Amount type (Lots, Money, Risk%) Select Stop Loss Price SL Pips - distance in pips to s

Fractals ST Patterns is a modification of Bill Williams' Fractals indicator. Unlike a standard Fractals indicator, Fractals ST Patterns allows setting any number of bars to find a fractal. This simple indicator corresponds to the parameters specified in the ST Patterns Strategy ( https://stpatterns.com/ ) . Structural Target patterns are the market itself, which is consistently divided into components. For the formation of ST Patterns , no trend lines, geometric proportions of the model itself,
FREE
This simple but useful script calculates the lot in % of the deposit. It is indispensable for risk management. There is only one customizable parameter: MaxRisk - risk in % for lot calculation. The product works as a standard script. Launch it once on an appropriate chart and start trading using the calculated lot value. Genious is simplicity! Happy trading!
FREE
ADR ST patterns is a modification of the classical ADR indicator. This simple indicator corresponds to the parameters specified in the ST patterns Strategy ( https://stpatterns.com/ ). Structural Target patterns are the market itself, which is consistently divided into components. For the formation of ST patterns , no trend lines, geometric proportions of the model itself, trading volume, or open market interest are needed. They are easily recognized and built only on the basis of breaking thr
FREE

The EVO Exclusive EA Lite EA is based on support/resistance level breakthroughs. It works autonomously on a VPS server. The EA passed testing on real ticks. Pro or ECN accounts with Market Execution are required for correct operation. The Expert Advisor controls the spread and slippage, thereby protecting your capital from risks. No martingale, no grid, no hedging. The EA applies stop loss, take profit and trailing stop. This is a free version. Not all functions operable! The free version has a
FREE

Features It is a demo version of All inOne indicator It works only on EURUSD, but the full version works on all currency pairs. All in One indicator is a simple indicator, it makes you know about 8 indicators in all timeframes simultaneously at a single glance. Stochastic RSI Moving Average (MA) Parabolic SAR ADX MACD CCI Last Candle (Candle) In all timeframes (M1, M5, M15, M30, H1, H4, D1, MN) at the same time.
Parameters Stochastic: PercentK : Period of the %K line. PercentD : Period of the
FREE

This indicator displays the ZigZag Pointer Fibonacci Expansion Triangle movements timeframes only M1-W1.
Parameters InDepth: Displays the Depth movements. InDeviation: Displays the Deviation movements. InBackstep: Displays the Backstep movements. Fibonacci Expansion: Displays the Fibonacci Expansion movements. Fibonacci Expansion true.(false) Triangle: Displays the Triangle movements. Triangle true.(false) How to understand the status: If the Triangle is green, trend is up. If the Triangle is

Every indicator has its advantages and disadvantages. Trending ones show good signals during a trend, but lag during a flat. Flat ones thrive in the flat, but die off as soon as a trend comes. All this would not be a problem, if it was easy to predict when a flat changes to a trend and when a trend changes to a flat, but in practice it is an extremely serious task. What if you develop such an algorithm, which could eliminate an indicator's flaws and enhance its strengths? What if such an algori

The ' MTF MA Cross ' indicator comes from the time tested 'Moving Average Cross' strategy with several options available. The strategy in itself is one that was derived from rigorous testing on what was profitable in a moving average cross.
Key Features This indicator contains a fast and slow Moving Average cross with MTF & filtering settings. There are additional settings to filter signals out with how many bars and how many points. Indicator can be no-repaint when set with open prices & NewB

MACD BBands is a trading system based on MACD and Bollinger Bands placed in a single window. The indicator shows moving average slope angle (trend) change, compares their ratio (convergence/divergence) and allows sorting out signals using Bollinger Bands. The indicators are calibrated in such a way that the middle Bollinger Bands line is the zero level of the MACD indicator.
Parameters
Period - Bollinger Bands period; Deviations - number of standard deviations; Shift - shift relative to price

The indicator shows the levels of the past week and day. In addition, it draws a level in percentage. This level is specified relative to the difference between the High and Low of the past month and week. For the daily levels of the past day, the Close levels are additionally displayed. All you need to do is configure the display parameters of the levels to your liking.
Parameters Over the past months installations - settings for the last months;
PasteMonthsLines - the level display mode is
MetaTrader市场是 出售自动交易和技术指标的最好地方。
您只需要以一个有吸引力的设计和良好的描述为MetaTrader平台开发应用程序。我们将为您解释如何在市场发布您的产品将它提供给数以百万计的MetaTrader用户。
您错过了交易机会:
- 免费交易应用程序
- 8,000+信号可供复制
- 探索金融市场的经济新闻
注册
登录