
Price Action Analysis Toolkit Development (Part 16): Introducing Quarters Theory (II) — Intrusion Detector EA
Introduction
In our previous article, we introduced the Quarters Drawer Script, a tool designed to plot quarter levels visually on the chart, making market analysis more intuitive. This concept is derived from Quarters Theory, originally introduced by Ilian Yotov. Successfully drawing these quarters has proven to be a powerful method for simplifying price action analysis. However, manually monitoring these levels as price interacts with them requires significant time and attention.
To address this challenge, I am excited to introduce the Intrusion Detector EA, a solution designed to automate the monitoring process. This EA continuously tracks the charts, detecting when the price reaches any quartile level, whether small, large, major, overshoot, or undershoot levels. Additionally, it provides instant commentary and insights based on Ilian Yotov’s Quarters Theory, helping every trader to anticipate potential market reactions. In this article, we will start by reviewing the Quarters Drawer Tool, then delve into the strategy concept and MQL5 implementation, analyze the test results, and conclude with key takeaways. See the table of contents below for a structured overview.
Contents
- Introduction
- Contents
- Previous Article Review
- Strategy Concept and MQL5 Implementation
- Outcomes
- Conclusion
Previous Article Review
I won’t dwell too much on this section, as the Quarters Drawer Script was thoroughly discussed in our previous article. However, if you haven't read it yet, I highly recommend following the links provided to gain a full understanding of the foundational concepts. That article primarily focused on automating the drawing of quarter levels, making market analysis more structured and efficient.
As previously mentioned, Quarters Theory was discovered by Ilian Yotov and later introduced to the trading community. One crucial point, perhaps not emphasized enough in the last article, is that this theory is highly applicable to currency pairs, making it an essential tool for forex traders. To get a clearer understanding of how these quarter levels function, take a look at the diagram below, which visually represents the structure of the theory.
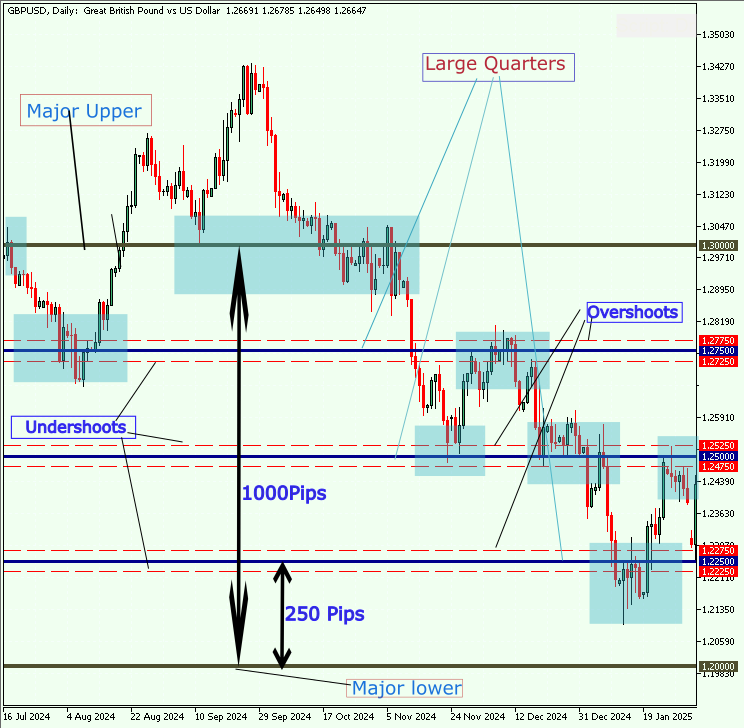
Fig 1. Quarters Levels
Our Quarters Drawer Tool delivered remarkable results, successfully plotting large quarters, overshoots, undershoots, and smaller quarters. More importantly, we observed that price consistently interacted with and responded to these levels, reinforcing the legitimacy and effectiveness of Yotov’s theory. This was not just a theoretical exercise, the tool validated the power of quarter levels in real market conditions. Now, let’s analyze the diagram below to revisit some of our key findings and insights.
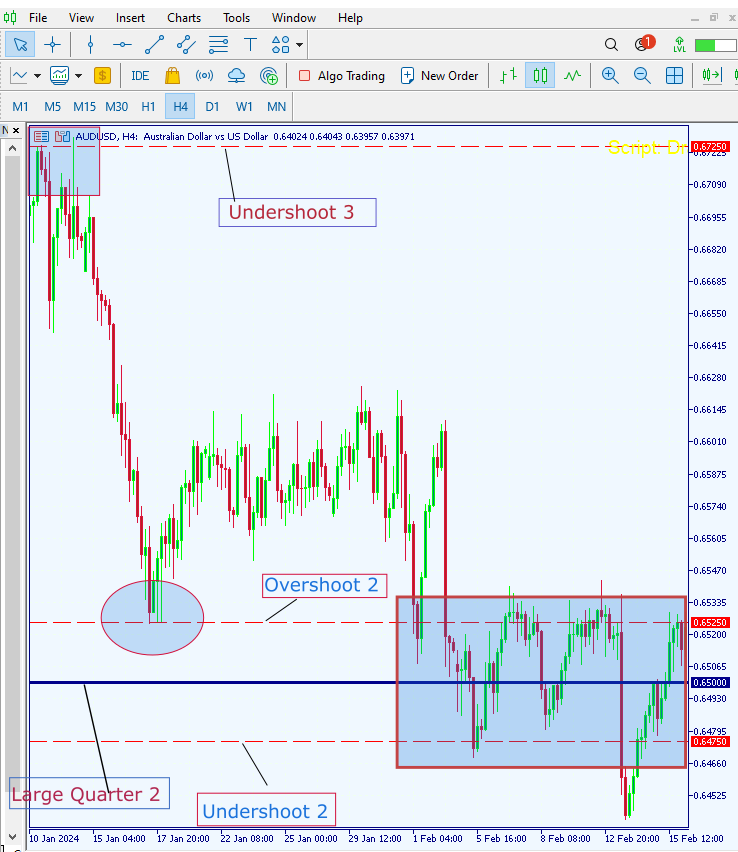
Fig 2. Outcomes
Strategy Concept and MQL5 Implementation
Core Logic
The Intrusion Detector EA is all about mapping out key psychological price levels using quarter theory. It divides the market into 1000-pip ranges, with Major Whole Numbers acting as the backbone. Within these, it marks Large Quarters (250-pip zones) and, if enabled, Small Quarters for even finer granularity. The EA also plots overshoot and undershoot areas, catching price extensions that might fake traders out. On every tick, it scans the current price, checks if it’s brushing up against these key levels within a set tolerance (aka, margin for error), and fires off alerts if something’s happening.
The core goal here is to spot potential turning points, breakouts, or fake breakouts before they become obvious to everyone else. If price is chilling near a Major Whole Number, the EA flags it as a key support or resistance zone. If it’s hovering around a Large Quarter level, it signals that a 250-pip move could be on deck. Overshoot and undershoot zones? They help call out traps where price might reverse hard. The EA makes sure it doesn’t spam alerts by tracking intrusions, and it updates an immediate commentary panel so you always have a read on what’s going down. The whole thing is built to keep you ahead of the herd by making quarter theory practical and actionable.
Implementation
In this EA, we begin with a header that includes metadata about the EA, such as its name ("Intrusion Detector"), copyright details, and a link to the developer’s profile. The #property directives specify these details and enforce strict compilation rules, ensuring that the code adheres to modern MQL5 standards.
//+------------------------------------------------------------------+
//|                                             Intrusion Detector   |
//|                             Copyright 2025, Christian Benjamin   |
//|                        https://www.mql5.com/en/users/lynnchris   |
//+------------------------------------------------------------------+
#property copyright "Christian Benjamin"
#property link      "https://www.mql5.com/en/users/lynnchris"
#property version   "1.0"
#property strict
Next, we define a set of input parameters that allow you to customize the EA’s behavior without modifying the code. The parameters include numerical values like MajorStep, which determines the interval between major levels (effectively defining a 1000-PIP range), and AlertTolerance, which sets the proximity threshold for detecting when the price “touches” a specific level. Boolean inputs control whether the EA draws additional lines, such as large and small quarter lines, as well as overshoot areas around those major levels.
Furthermore, the color settings are defined using hexadecimal values (or predefined colors) to ensure that each type of line, be it major, large quarter, small quarter, and overshoot, appears with its intended visual style on the chart. Line styles and thickness settings follow, allowing you to further customize the appearance of these drawn lines.
Configuration Settings
input double MajorStep          = 0.1000;   // Difference between Major Whole Numbers (defines the 1000-PIP Range)
input bool   DrawLargeQuarters  = true;     // Draw intermediate Large Quarter lines.
input bool   DrawSmallQuarters  = false;    // Draw Small Quarter lines.
input bool   DrawOvershootAreas = true;     // Mark overshoot/undershoot areas for Large Quarter lines.
input double AlertTolerance     = 0.0025;   // Tolerance for detecting a "touch"
- MajorStep: Defines the interval between major levels (e.g., a 1000-PIP range).
- DrawLargeQuarters & DrawSmallQuarters: Booleans controlling whether the EA should draw additional lines within the range.
- DrawOvershootAreas: Determines if extra “overshoot” and “undershoot” lines should be drawn near the large quarter levels.
- AlertTolerance: Specifies how close the price must get to a level (within 0.0025) to consider it a “touch.”
Color Settings
input color  MajorColor         = 0x2F4F4F; // Dark Slate Gray for Major lines.
input color  LargeQuarterColor  = 0x8B0000; // Dark Red for Large Quarter lines.
input color  SmallQuarterColor  = 0x00008B; // Dark Blue for Small Quarter lines.
input color  OvershootColor     = clrRed;   // Red for overshoot/undershoot lines.
Colors are defined for each type of line so that when drawn on the chart they visually match the description.
Line Style and Thickness Settings
input ENUM_LINE_STYLE MajorLineStyle       = STYLE_SOLID;
input int    MajorLineWidth                 = 4;
input ENUM_LINE_STYLE LargeQuarterLineStyle  = STYLE_DOT;
input int    LargeQuarterLineWidth          = 3;
input ENUM_LINE_STYLE OvershootLineStyle     = STYLE_DASH;
input int    OvershootLineWidth             = 1;
input ENUM_LINE_STYLE SmallQuarterLineStyle  = STYLE_SOLID;
input int    SmallQuarterLineWidth          = 1;
Each line type (major, large quarter, overshoot, small quarter) has its style (solid, dot, dash) and width settings.
Customizable Commentary Messages
These messages describe the significance of each level when the price “touches” it. They are used later to build a commentary table.
- MajorSupportReason: This indicates that there is a significant support level in the market. If the price falls below this level, it suggests that a shift in the trading range may occur, potentially leading to further price declines.
- MajorResistanceReason: This signifies a critical resistance level. If the price breaks above this resistance, it could signal the beginning of a new trading range, potentially resulting in an upward price movement.
- LargeQuarterReason: This statement points out that a decisive break in the price at this level could lead to a substantial price movement, potentially as large as 250 pips. This implies that traders should be attentive to this level for potential trading opportunities.
- OvershootReason: This implies that the price is testing a breakout level, and if it fails to maintain momentum, a reversal in price direction is likely. This means traders should be cautious if the price spikes above a key level without strong buying support.
- UndershootReason: This indicates that there has not been enough bullish interest in the market, suggesting that a reversal to a bearish trend could be possible. Traders should observe this signal closely for potential short-selling opportunities.
- SmallQuarterReason: This refers to a minor price fluctuation within the market. It suggests that the price is moving in small increments and may not indicate any significant trading opportunities or trend changes.
input string MajorSupportReason    = "Key support level. Break below signals range shift.";
input string MajorResistanceReason = "Pivotal resistance. Breakout above may start new range.";
input string LargeQuarterReason    = "Decisive break could trigger next 250-PIP move.";
input string OvershootReason       = "Test of breakout; reversal likely if momentum fails.";
input string UndershootReason      = "Insufficient bullish force; possible bearish reversal.";
input string SmallQuarterReason    = "Minor fluctuation.";
A global Boolean variable, intrusionAlerted, is used to ensure that alerts are only triggered once per intrusion event, avoiding repeated notifications when the price lingers around a level.
// Global flag to avoid repeated alerts while price lingers at a level
bool intrusionAlerted = false;
The function DrawHorizontalLine is at the core of the EA’s visual output. This function takes parameters like the line’s name, price, color, width, and style, and it first checks whether a line with that name already exists—if it does, the line is deleted. Then it creates a new horizontal line at the specified price and sets its properties accordingly, ensuring that the line extends to the right side of the chart. This modular approach makes it simple to reuse the function whenever a new level needs to be drawn.
void DrawHorizontalLine(string name, double price, color lineColor, int width, ENUM_LINE_STYLE style)
{
   if(ObjectFind(0, name) != -1)
      ObjectDelete(0, name);

   if(!ObjectCreate(0, name, OBJ_HLINE, 0, 0, price))
   {
      Print("Failed to create line: ", name);
      return;
   }
   ObjectSetInteger(0, name, OBJPROP_COLOR, lineColor);
   ObjectSetInteger(0, name, OBJPROP_STYLE, style);
   ObjectSetInteger(0, name, OBJPROP_WIDTH, width);
   ObjectSetInteger(0, name, OBJPROP_RAY_RIGHT, true);
}
The DrawQuarters function leverages DrawHorizontalLine to draw the major boundaries of the 1000-PIP range (calculated based on the current price) as well as additional lines within that range. If enabled, the EA draws “Large Quarter” lines by dividing the range into four segments. For each of these lines, if overshoot areas are enabled, the function also draws lines slightly above and below the main level to indicate potential overshoots or undershoots. When the option is turned on, the EA even subdivides the range into even finer “Small Quarter” lines, giving you more detailed visual cues about the price structure.
void DrawQuarters(double currentPrice)
{
   // Calculate the boundaries of the current 1000-PIP Range
   double lowerMajor = MathFloor(currentPrice / MajorStep) * MajorStep;
   double upperMajor = lowerMajor + MajorStep;

   // Draw Major Whole Number lines (defining the 1000-PIP Range)
   DrawHorizontalLine("MajorLower", lowerMajor, MajorColor, MajorLineWidth, MajorLineStyle);
   DrawHorizontalLine("MajorUpper", upperMajor, MajorColor, MajorLineWidth, MajorLineStyle);

   // Draw Large Quarter lines and their overshoot/undershoot areas if enabled
   if(DrawLargeQuarters)
   {
      double LQIncrement = MajorStep / 4.0;
      for(int i = 1; i < 4; i++)
      {
         double level = lowerMajor + i * LQIncrement;
         string objName = "LargeQuarter_" + IntegerToString(i);
         DrawHorizontalLine(objName, level, LargeQuarterColor, LargeQuarterLineWidth, LargeQuarterLineStyle);

         if(DrawOvershootAreas)
         {
            double offset = MajorStep / 40.0; // approximately 25 pips if MajorStep=0.1000
            DrawHorizontalLine("Overshoot_" + IntegerToString(i) + "_up", level + offset, OvershootColor, OvershootLineWidth, OvershootLineStyle);
            DrawHorizontalLine("Undershoot_" + IntegerToString(i) + "_down", level - offset, OvershootColor, OvershootLineWidth, OvershootLineStyle);
         }
      }
   }

   // Draw Small Quarter lines if enabled (optional, finer divisions)
   if(DrawSmallQuarters)
   {
      double segStep = MajorStep / 10.0;
      double smallQuarter = segStep / 4.0;
      for(int seg = 0; seg < 10; seg++)
      {
         double segStart = lowerMajor + seg * segStep;
         for(int j = 1; j < 4; j++)
         {
            double level = segStart + j * smallQuarter;
            string objName = "SmallQuarter_" + IntegerToString(seg) + "_" + IntegerToString(j);
            DrawHorizontalLine(objName, level, SmallQuarterColor, SmallQuarterLineWidth, SmallQuarterLineStyle);
         }
      }
   }
}
Another essential function is CreateOrUpdateLabel, which handles the display of text on the chart. This function checks if a label already exists and creates it if not. It then updates the label’s text, color, font size, and other properties, using a monospaced font (Courier New) to ensure that any tabular data remains neatly aligned. This function is particularly important for updating the commentary that explains the market conditions.
void CreateOrUpdateLabel(string name, string text, int corner, int xdist, int ydist, color txtColor, int fontSize)
{
   if(ObjectFind(0, name) == -1)
   {
      ObjectCreate(0, name, OBJ_LABEL, 0, 0, 0);
      ObjectSetInteger(0, name, OBJPROP_CORNER, corner);
      ObjectSetInteger(0, name, OBJPROP_XDISTANCE, xdist);
      ObjectSetInteger(0, name, OBJPROP_YDISTANCE, ydist);
      // Set a monospaced font for tabular display (Courier New)
      ObjectSetString(0, name, OBJPROP_FONT, "Courier New");
   }
   ObjectSetString(0, name, OBJPROP_TEXT, text);
   ObjectSetInteger(0, name, OBJPROP_COLOR, txtColor);
   ObjectSetInteger(0, name, OBJPROP_FONTSIZE, fontSize);
}
When the EA initializes (in the OnInit function), it creates a persistent label in the top-left corner of the chart with the message “Intrusion Detector Initialized.” Conversely, when the EA is removed (via the OnDeinit function), it cleans up by deleting this label to keep the chart tidy.
int OnInit()
{
   // Create a persistent commentary label in the top-left corner
   CreateOrUpdateLabel("IntrusionCommentary", "Intrusion Detector Initialized", CORNER_LEFT_UPPER, 10, 10, clrWhite, 14);
   return(INIT_SUCCEEDED);
}
The heart of the EA lies in the OnTick function, which is executed with every new market tick. When the EA receives a new tick, the OnTick function is triggered. The first step in this function is to initialize a flag named intrusionDetected to false and retrieve the current market bid using SymbolInfoDouble(_Symbol, SYMBOL_BID). If the returned price is 0 (indicating an invalid or unavailable value), the function exits immediately.
void OnTick()
{
   bool intrusionDetected = false;
   double currentPrice = SymbolInfoDouble(_Symbol, SYMBOL_BID);
   if(currentPrice == 0)
      return;
Next, the EA calls the DrawQuarters function with the current price. This call is responsible for drawing all the key levels on the chart, including major levels, large quarter lines, and, if enabled, the smaller quarter lines, providing the visual structure that defines our range. Immediately following this, the EA recalculates the boundaries of the current 1000-PIP range by determining the lowerMajor level using MathFloor(currentPrice / MajorStep) * MajorStep and then adding the MajorStep to find the upperMajor level.
   // Draw the quarter lines first
   DrawQuarters(currentPrice);
To provide a clear commentary on what the EA is detecting, a tabular string is constructed. This table starts with a header that defines three columns: Zone, Price, and Reason. These columns are used to list the significance of each level when the price comes close to them.
   double lowerMajor = MathFloor(currentPrice / MajorStep) * MajorStep;
   double upperMajor = lowerMajor + MajorStep;
The next step involves checking whether the price is near key levels. The EA first tests if the price is within the specified tolerance of the lower boundary (Major Support) or the upper boundary (Major Resistance). If either condition is met, the function appends a row to the commentary table with the appropriate message (using predefined messages like "Key support level. Break below signals range shift." for support, and a similar message for resistance) and sets intrusionDetected to true.
// Check for Major Support
if(MathAbs(currentPrice - lowerMajor) <= AlertTolerance)
{
   table += StringFormat("%-18s | %-8s | %s\n", "Major Support", DoubleToString(lowerMajor,4), MajorSupportReason);
   intrusionDetected = true;
}
// Check for Major Resistance
if(MathAbs(currentPrice - upperMajor) <= AlertTolerance)
{
   table += StringFormat("%-18s | %-8s | %s\n", "Major Resistance", DoubleToString(upperMajor,4), MajorResistanceReason);
   intrusionDetected = true;
}
If drawing of large quarter lines is enabled, the EA then divides the range into quarters and iterates through these intermediate levels. For each large quarter, it checks if the price is within the tolerance; if it is, it appends a corresponding row (with a message such as "Decisive break could trigger next 250-PIP move.") to the table. Furthermore, if overshoot areas are enabled, the function calculates a small offset above and below each large quarter level and checks if the price touches these overshoot or undershoot zones, again appending a row to the table if the condition is met.
if(DrawLargeQuarters)
{
   double LQIncrement = MajorStep / 4.0;
   for(int i = 1; i < 4; i++)
   {
      double level = lowerMajor + i * LQIncrement;
      if(MathAbs(currentPrice - level) <= AlertTolerance)
      {
         table += StringFormat("%-18s | %-8s | %s\n", "Large Quarter", DoubleToString(level,4), LargeQuarterReason);
         intrusionDetected = true;
      }
      if(DrawOvershootAreas)
      {
         double offset = MajorStep / 40.0; // ~25 pips
         double overshootUp = level + offset;
         double undershootDown = level - offset;
         if(MathAbs(currentPrice - overshootUp) <= AlertTolerance)
         {
            table += StringFormat("%-18s | %-8s | %s\n", "Overshoot", DoubleToString(overshootUp,4), OvershootReason);
            intrusionDetected = true;
         }
         if(MathAbs(currentPrice - undershootDown) <= AlertTolerance)
         {
            table += StringFormat("%-18s | %-8s | %s\n", "Undershoot", DoubleToString(undershootDown,4), UndershootReason);
            intrusionDetected = true;
         }
      }
   }
}
Optionally, if the EA is configured to draw small quarter lines, the range is subdivided even further. The function iterates over these finer divisions and performs similar proximity checks, appending rows with a "Minor fluctuation" message whenever the price comes close to one of these small quarter levels.
if(DrawSmallQuarters)
{
   double segStep = MajorStep / 10.0;
   double smallQuarter = segStep / 4.0;
   for(int seg = 0; seg < 10; seg++)
   {
      double segStart = lowerMajor + seg * segStep;
      for(int j = 1; j < 4; j++)
      {
         double level = segStart + j * smallQuarter;
         if(MathAbs(currentPrice - level) <= AlertTolerance)
         {
            table += StringFormat("%-18s | %-8s | %s\n", "Small Quarter", DoubleToString(level,4), SmallQuarterReason);
            intrusionDetected = true;
         }
      }
   }
}
If none of the levels trigger an intrusion (i.e., intrusionDetected remains false), the EA constructs a default message. This message informs the user that no significant intrusion was detected and that the market appears to be consolidating, while also displaying the current price.
   // If no zones were triggered, still provide full information
   if(!intrusionDetected)
   {
      table = StringFormat("No significant intrusion detected.\nCurrent Price: %s\nMarket consolidating within established quarters.\n", DoubleToString(currentPrice,4));
   }
After building the commentary table, the EA updates a chart label using the CreateOrUpdateLabel function, ensuring that the latest analysis is clearly displayed on the chart. Finally, if an intrusion is detected and no alert has been previously sent (tracked by the intrusionAlerted flag), the EA triggers an alert with the table's contents and sets the flag to true to prevent repeated notifications. To ensure all new objects and updates are immediately visible, the function ends by calling ChartRedraw.
   // Update the label with the commentary table.
   CreateOrUpdateLabel("IntrusionCommentary", table, CORNER_LEFT_UPPER, 10, 10, clrWhite, 14);

   // Trigger an alert only once per intrusion event.
   if(intrusionDetected && !intrusionAlerted)
   {
      Alert(table);
      intrusionAlerted = true;
   }
   if(!intrusionDetected)
      intrusionAlerted = false;

   ChartRedraw();
}
Full MQL5 Code
//+------------------------------------------------------------------+
//|                                               Intrusion Detector |
//|                               Copyright 2025, Christian Benjamin |
//|                          https://www.mql5.com/en/users/lynnchris |
//+------------------------------------------------------------------+
#property copyright "Christian Benjamin"
#property link      "https://www.mql5.com/en/users/lynnchris"
#property version   "1.0"
#property strict

//---- Input parameters -------------------------------------------------
input double MajorStep          = 0.1000;   // Difference between Major Whole Numbers (defines the 1000-PIP Range)
input bool   DrawLargeQuarters  = true;     // Draw intermediate Large Quarter lines.
input bool   DrawSmallQuarters  = false;    // Draw Small Quarter lines.
input bool   DrawOvershootAreas = true;     // Mark overshoot/undershoot areas for Large Quarter lines.
input double AlertTolerance     = 0.0025;   // Tolerance for detecting a "touch" (e.g., ~25 pips for a pair where 1 pip=0.0001)

//---- Color settings ---------------------------------------------------
input color  MajorColor         = 0x2F4F4F; // Dark Slate Gray for Major lines.
input color  LargeQuarterColor  = 0x8B0000; // Dark Red for Large Quarter lines.
input color  SmallQuarterColor  = 0x00008B; // Dark Blue for Small Quarter lines.
input color  OvershootColor     = clrRed;   // Red for overshoot/undershoot lines.

//---- Line style and thickness settings -------------------------------
input ENUM_LINE_STYLE MajorLineStyle       = STYLE_SOLID;
input int    MajorLineWidth                 = 4;
input ENUM_LINE_STYLE LargeQuarterLineStyle  = STYLE_DOT;
input int    LargeQuarterLineWidth          = 3;
input ENUM_LINE_STYLE OvershootLineStyle     = STYLE_DASH;
input int    OvershootLineWidth             = 1;
input ENUM_LINE_STYLE SmallQuarterLineStyle  = STYLE_SOLID;
input int    SmallQuarterLineWidth          = 1;

//---- Commentary Messages (customizable) -----------------------------
input string MajorSupportReason    = "Key support level. Break below signals range shift.";
input string MajorResistanceReason = "Pivotal resistance. Breakout above may start new range.";
input string LargeQuarterReason    = "Decisive break could trigger next 250-PIP move.";
input string OvershootReason       = "Test of breakout; reversal likely if momentum fails.";
input string UndershootReason      = "Insufficient bullish force; possible bearish reversal.";
input string SmallQuarterReason    = "Minor fluctuation.";

// Global flag to avoid repeated alerts while price lingers at a level
bool intrusionAlerted = false;

//+------------------------------------------------------------------+
//| DrawHorizontalLine: Creates or replaces a horizontal line        |
//+------------------------------------------------------------------+
void DrawHorizontalLine(string name, double price, color lineColor, int width, ENUM_LINE_STYLE style)
  {
   if(ObjectFind(0, name) != -1)
      ObjectDelete(0, name);

   if(!ObjectCreate(0, name, OBJ_HLINE, 0, 0, price))
     {
      Print("Failed to create line: ", name);
      return;
     }
   ObjectSetInteger(0, name, OBJPROP_COLOR, lineColor);
   ObjectSetInteger(0, name, OBJPROP_STYLE, style);
   ObjectSetInteger(0, name, OBJPROP_WIDTH, width);
   ObjectSetInteger(0, name, OBJPROP_RAY_RIGHT, true);
  }

//+------------------------------------------------------------------+
//| DrawQuarters: Draws all quarter lines based on the current price |
//+------------------------------------------------------------------+
void DrawQuarters(double currentPrice)
  {
// Calculate the boundaries of the current 1000-PIP Range
   double lowerMajor = MathFloor(currentPrice / MajorStep) * MajorStep;
   double upperMajor = lowerMajor + MajorStep;

// Draw Major Whole Number lines (defining the 1000-PIP Range)
   DrawHorizontalLine("MajorLower", lowerMajor, MajorColor, MajorLineWidth, MajorLineStyle);
   DrawHorizontalLine("MajorUpper", upperMajor, MajorColor, MajorLineWidth, MajorLineStyle);

// Draw Large Quarter lines and their overshoot/undershoot areas if enabled
   if(DrawLargeQuarters)
     {
      double LQIncrement = MajorStep / 4.0;
      for(int i = 1; i < 4; i++)
        {
         double level = lowerMajor + i * LQIncrement;
         string objName = "LargeQuarter_" + IntegerToString(i);
         DrawHorizontalLine(objName, level, LargeQuarterColor, LargeQuarterLineWidth, LargeQuarterLineStyle);

         if(DrawOvershootAreas)
           {
            double offset = MajorStep / 40.0; // approximately 25 pips if MajorStep=0.1000
            DrawHorizontalLine("Overshoot_" + IntegerToString(i) + "_up", level + offset, OvershootColor, OvershootLineWidth, OvershootLineStyle);
            DrawHorizontalLine("Undershoot_" + IntegerToString(i) + "_down", level - offset, OvershootColor, OvershootLineWidth, OvershootLineStyle);
           }
        }
     }

// Draw Small Quarter lines if enabled (optional, finer divisions)
   if(DrawSmallQuarters)
     {
      double segStep = MajorStep / 10.0;
      double smallQuarter = segStep / 4.0;
      for(int seg = 0; seg < 10; seg++)
        {
         double segStart = lowerMajor + seg * segStep;
         for(int j = 1; j < 4; j++)
           {
            double level = segStart + j * smallQuarter;
            string objName = "SmallQuarter_" + IntegerToString(seg) + "_" + IntegerToString(j);
            DrawHorizontalLine(objName, level, SmallQuarterColor, SmallQuarterLineWidth, SmallQuarterLineStyle);
           }
        }
     }
  }

//+------------------------------------------------------------------+
//| CreateOrUpdateLabel: Creates or updates a label with given text  |
//+------------------------------------------------------------------+
void CreateOrUpdateLabel(string name, string text, int corner, int xdist, int ydist, color txtColor, int fontSize)
  {
   if(ObjectFind(0, name) == -1)
     {
      ObjectCreate(0, name, OBJ_LABEL, 0, 0, 0);
      ObjectSetInteger(0, name, OBJPROP_CORNER, corner);
      ObjectSetInteger(0, name, OBJPROP_XDISTANCE, xdist);
      ObjectSetInteger(0, name, OBJPROP_YDISTANCE, ydist);
      // Set a monospaced font for tabular display (Courier New)
      ObjectSetString(0, name, OBJPROP_FONT, "Courier New");
     }
   ObjectSetString(0, name, OBJPROP_TEXT, text);
   ObjectSetInteger(0, name, OBJPROP_COLOR, txtColor);
   ObjectSetInteger(0, name, OBJPROP_FONTSIZE, fontSize);
  }

//+------------------------------------------------------------------+
//| OnInit: Initialization function for the EA                       |
//+------------------------------------------------------------------+
int OnInit()
  {
// Create a persistent commentary label in the top-left corner
   CreateOrUpdateLabel("IntrusionCommentary", "Intrusion Detector Initialized", CORNER_LEFT_UPPER, 10, 10, clrWhite, 14);
   return(INIT_SUCCEEDED);
  }

//+------------------------------------------------------------------+
//| OnDeinit: Deinitialization function for the EA                   |
//+------------------------------------------------------------------+
void OnDeinit(const int reason)
  {
// Remove the commentary label on exit
   ObjectDelete(0, "IntrusionCommentary");
  }

//+------------------------------------------------------------------+
//| OnTick: Main function called on every tick                       |
//+------------------------------------------------------------------+
void OnTick()
  {
   bool intrusionDetected = true;
   double currentPrice = SymbolInfoDouble(_Symbol, SYMBOL_BID);
   if(currentPrice == 0)
      return;

// Draw the quarter lines first
   DrawQuarters(currentPrice);

// Calculate boundaries of the current 1000-PIP Range
   double lowerMajor = MathFloor(currentPrice / MajorStep) * MajorStep;
   double upperMajor = lowerMajor + MajorStep;

// Build a tabular commentary string with a header.
   string header = StringFormat("%-18s | %-8s | %s\n", "Zone", "Price", "Reason");
   string separator = "----------------------------------------------\n";
   string table = header + separator;

// Check for Major Support
   if(MathAbs(currentPrice - lowerMajor) <= AlertTolerance)
     {
      table += StringFormat("%-18s | %-8s | %s\n", "Major Support", DoubleToString(lowerMajor,4), MajorSupportReason);
      intrusionDetected = true;
     }
// Check for Major Resistance
   if(MathAbs(currentPrice - upperMajor) <= AlertTolerance)
     {
      table += StringFormat("%-18s | %-8s | %s\n", "Major Resistance", DoubleToString(upperMajor,4), MajorResistanceReason);
      intrusionDetected = true;
     }

// Check Large Quarter Levels and Overshoot/Undershoot Zones
   if(DrawLargeQuarters)
     {
      double LQIncrement = MajorStep / 4.0;
      for(int i = 1; i < 4; i++)
        {
         double level = lowerMajor + i * LQIncrement;
         if(MathAbs(currentPrice - level) <= AlertTolerance)
           {
            table += StringFormat("%-18s | %-8s | %s\n", "Large Quarter", DoubleToString(level,4), LargeQuarterReason);
            intrusionDetected = true;
           }
         if(DrawOvershootAreas)
           {
            double offset = MajorStep / 40.0; // ~25 pips
            double overshootUp = level + offset;
            double undershootDown = level - offset;
            if(MathAbs(currentPrice - overshootUp) <= AlertTolerance)
              {
               table += StringFormat("%-18s | %-8s | %s\n", "Overshoot", DoubleToString(overshootUp,4), OvershootReason);
               intrusionDetected = true;
              }
            if(MathAbs(currentPrice - undershootDown) <= AlertTolerance)
              {
               table += StringFormat("%-18s | %-8s | %s\n", "Undershoot", DoubleToString(undershootDown,4), UndershootReason);
               intrusionDetected = true;
              }
           }
        }
     }

// Check Small Quarter Levels (if enabled)
   if(DrawSmallQuarters)
     {
      double segStep = MajorStep / 10.0;
      double smallQuarter = segStep / 4.0;
      for(int seg = 0; seg < 10; seg++)
        {
         double segStart = lowerMajor + seg * segStep;
         for(int j = 1; j < 4; j++)
           {
            double level = segStart + j * smallQuarter;
            if(MathAbs(currentPrice - level) <= AlertTolerance)
              {
               table += StringFormat("%-18s | %-8s | %s\n", "Small Quarter", DoubleToString(level,4), SmallQuarterReason);
               intrusionDetected = true;
              }
           }
        }
     }

// If no zones were triggered, still provide full information
   if(!intrusionDetected)
     {
      table = StringFormat("No significant intrusion detected.\nCurrent Price: %s\nMarket consolidating within established quarters.\n", DoubleToString(currentPrice,4));
     }

// Update the label with the commentary table.
   CreateOrUpdateLabel("IntrusionCommentary", table, CORNER_LEFT_UPPER, 10, 10, clrWhite, 14);

// Trigger an alert only once per intrusion event.
   if(intrusionDetected && !intrusionAlerted)
     {
      Alert(table);
      // Alternatively, you could use: PlaySound("alert.wav");
      intrusionAlerted = true;
     }
   if(!intrusionDetected)
      intrusionAlerted = false;

   ChartRedraw();
  }
//+------------------------------------------------------------------+
Outcomes
Here, I will present the outcomes I obtained after testing the tool in a real market environment, although I used a demo account for this purpose. Below is a diagram depicting the New Zealand Dollar (NZD) against the United States Dollar (USD). The price approached the undershoot level, triggering an alert.
The alert provided critical information, including the identified zone, which in this case was the undershoot zone. The specific price level at which this zone was detected is 0.5725. Furthermore, the alert included an analysis of the market conditions at that level, indicating insufficient bullish momentum and the potential for a bearish reversal.
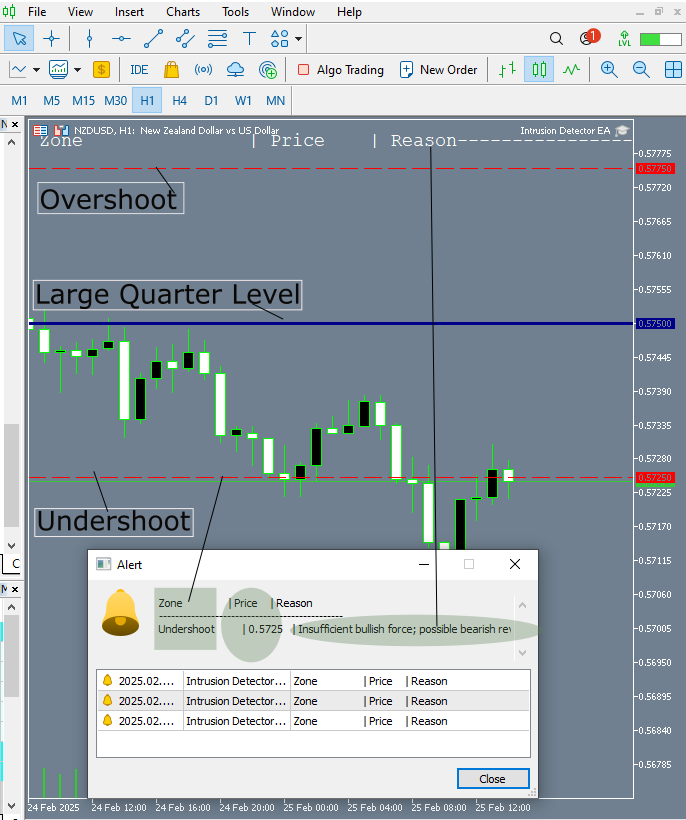
Fig 3. NZD vs USD
Below is the information logged in the Experts tab on MetaTrader 5.
2025.02.25 16:55:37.188 Intrusion Detector EA (NZDUSD,H1)       Alert: Zone               | Price    | Reason
2025.02.25 16:55:37.188 Intrusion Detector EA (NZDUSD,H1)       ----------------------------------------------
2025.02.25 16:55:37.188 Intrusion Detector EA (NZDUSD,H1)       Undershoot         | 0.5725   | Insufficient bullish force; possible bearish reversal.
2025.02.25 16:55:37.188 Intrusion Detector EA (NZDUSD,H1)
Let's take a look at the trade I executed following this detection and further analysis.
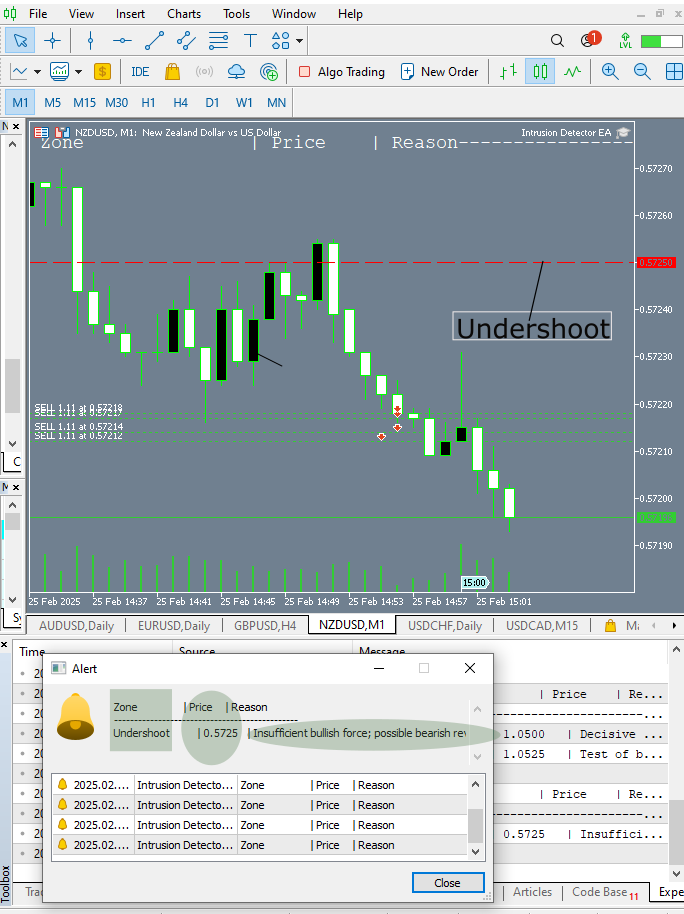
Fig 3. Trading Test
Below is the market's final position, even though I closed my trades quickly.
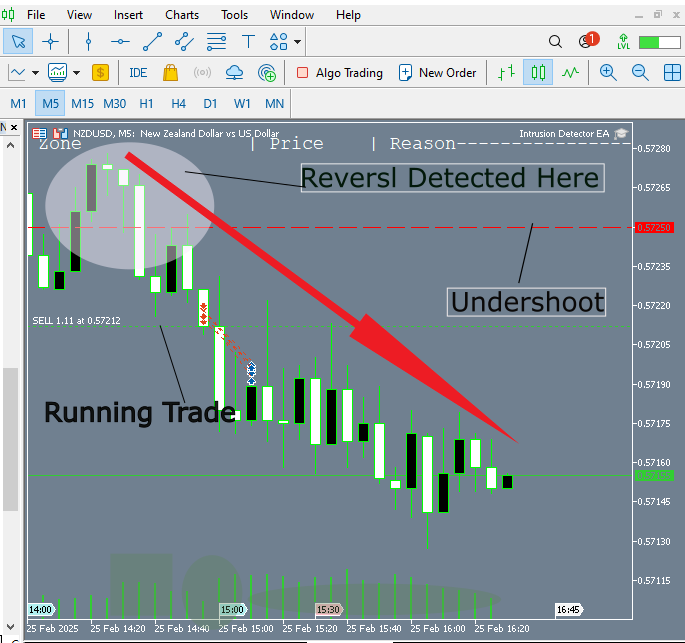
Fig 5. Market Movement
Figure 6 below is a GIF showcasing a test I conducted on the USD/CAD currency pair, in which two zones were identified where the price reacted to the overshoot and the large quarter level.
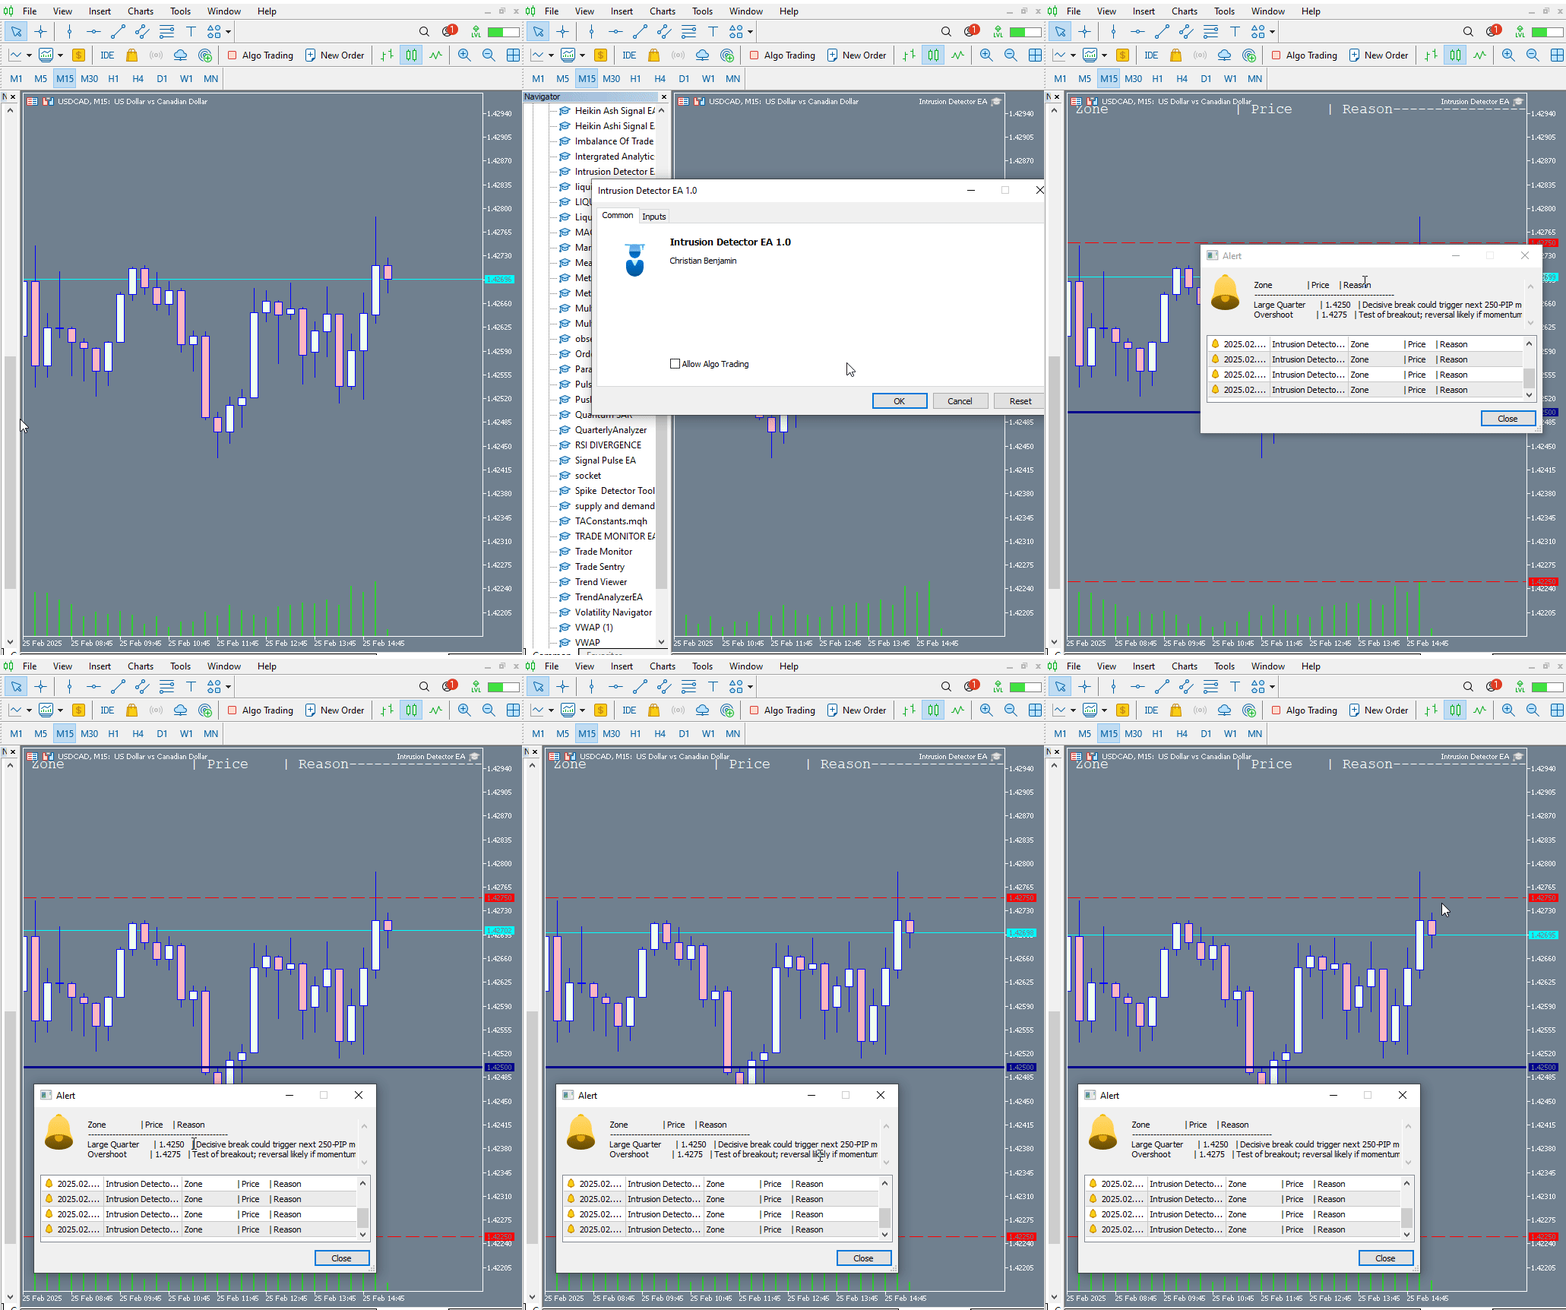
Fig 6. USDCAD
Conclusion
Our expert advisor serves as a powerful analysis assistant, specifically designed to monitor price zones in alignment with Quarters Theory. This tool is particularly valuable for traders who incorporate Quarters Theory into their market analysis. Based on our extensive testing, the EA excels at detecting key price zones, issuing timely alerts, and providing effective background market monitoring. This development represents a significant step forward in automating market analysis using Quarters Theory. Previously, we focused on automating the drawing of quarters, and now we've advanced to real-time quarters monitoring. This enhancement ensures traders are promptly informed whenever the price interacts with these critical levels, accompanied by a concise explanation of potential market shifts.
However, this is not the final stage of our journey. Expect further innovations in the application of Quarters Theory in market automation. That said, I encourage all traders utilizing this tool to integrate their own strategies rather than relying solely on the signals provided. A well-rounded approach, combining automation with personal expertise, leads to informed trading decisions.
| Date | Tool Name | Description | Version | Updates | Notes |
|---|---|---|---|---|---|
| 01/10/24 | Chart Projector | Script to overlay the previous day's price action with ghost effect. | 1.0 | Initial Release | Tool number 1 |
| 18/11/24 | Analytical Comment | It provides previous day's information in a tabular format, as well as anticipates the future direction of the market. | 1.0 | Initial Release | Tool number 2 |
| 27/11/24 | Analytics Master | Regular Update of market metrics after every two hours | 1.01 | Second Release | Tool number 3 |
| 02/12/24 | Analytics Forecaster | Regular Update of market metrics after every two hours with telegram integration | 1.1 | Third Edition | Tool number 4 |
| 09/12/24 | Volatility Navigator | The EA analyzes market conditions using the Bollinger Bands, RSI and ATR indicators | 1.0 | Initial Release | Tool Number 5 |
| 19/12/24 | Mean Reversion Signal Reaper | Analyzes market using mean reversion strategy and provides signal | 1.0 | Initial Release | Tool number 6 |
| 9/01/25 | Signal Pulse | Multiple timeframe analyzer | 1.0 | Initial Release | Tool number 7 |
| 17/01/25 | Metrics Board | Panel with button for analysis | 1.0 | Initial Release | Tool number 8 |
| 21/01/25 | External Flow | Analytics through external libraries | 1.0 | Initial Release | Tool number 9 |
| 27/01/25 | VWAP | Volume Weighted Average Price | 1.3 | Initial Release | Tool number 10 |
| 02/02/25 | Heikin Ashi | Trend Smoothening and reversal signal identification | 1.0 | Initial Release | Tool number 11 |
| 04/02/25 | FibVWAP | Signal generation through python analysis | 1.0 | Initial Release | Tool number 12 |
| 14/02/25 | RSI DIVERGENCE | Price action versus RSI divergences | 1.0 | Initial Release | Tool number 13 |
| 17/02/25 | Parabolic Stop and Reverse (PSAR) | Automating PSAR strategy | 1.0 | Initial Release | Tool number 14 |
| 20/02/25 | Quarters Drawer Script | Drawing quarters levels on chart | 1.0 | Initial Release | Tool number 15 |
| 27/02/25 | Intrusion Detector | Detect and alert when price reaches quarters levels | 1.0 | Initial Release | Tool number 16 |
 Neural Networks in Trading: State Space Models
 MQL5 Trading Toolkit (Part 8): How to Implement and Use the History Manager EX5 Library in Your Codebase
 Developing a Replay System (Part 60): Playing the Service (I)
 William Gann methods (Part III): Does Astrology Work?
- Free trading apps
- Over 8,000 signals for copying
- Economic news for exploring financial markets
You agree to website policy and terms of use