
Price Action Analysis Toolkit Development (Part 7): Signal Pulse EA
Contents
Introduction
In this article, we'll explore how to develop an Expert Advisor (EA) in MQL5 called Signal Pulse EA. The EA will use a combination of Bollinger Bands and Stochastic Oscillator indicators across three different timeframes to detect buy and sell signals. The purpose of this EA is to help traders make informed decisions by confirming signals from multiple timeframes before entering a trade. We have incorporated multiple timeframes, Bollinger Bands (BB), and the Stochastic Oscillator for signal generation. Our goal is to minimize false signals, which can be frustrating for traders. By combining these elements, we aim to enhance the accuracy of our trading signals. Below, I have tabulated the importance of each component in our signal generation tool.
- Multiple Timeframes
| Advantage | Description |
|---|---|
| Risk Management | Using multiple timeframes allows the EA to analyze the market from different perspectives, reducing the impact of false signals and improving risk management. |
| Confidence in Signals | By confirming signals across multiple timeframes, the EA gains confidence in the trade direction, reducing the likelihood of entering a trade with a weak or false signal. |
| Diversification | Analyzing multiple timeframes provides a more diversified view of the market, allowing the EA to adapt to changing market conditions and make more informed trading decisions. |
- Stochastic
| Advantage | Description |
|---|---|
| Overbought/Oversold Conditions | Stochastic helps identify overbought and oversold conditions, indicating potential reversal points in the market. |
| Confirmation Tool | Stochastic serves as a confirmation tool for the Bollinger Bands, ensuring that the EA does not enter a trade based solely on BB signals. |
| Filtering False Signals | By using Stochastic, the EA can filter out false signals generated by the Bollinger Bands, especially during periods of high volatility. |
- Bollinger Bands
| Advantage | Description |
|---|---|
| Volatility Indication | Bollinger Bands indicate the level of volatility in the market, helping the EA understand the market's mood and potential trading opportunities. |
| Support/Resistance Levels | Bollinger Bands act as dynamic support and resistance levels, providing the EA with potential entry and exit points. |
| Trend Confirmation | The width of Bollinger Bands can confirm or deny the presence of a trend, helping the EA make informed trading decisions |
The interaction between multiple timeframes, Stochastic, and Bollinger Bands (BB) significantly enhances the EA's effectiveness in generating reliable trading signals and managing risk. By analyzing signals across various timeframes, the EA ensures that trading opportunities are confirmed by a strong confluence of indicators from both Stochastic and BB. This multidimensional approach reduces the likelihood of false signals, as the EA identifies potential trades only when there is robust evidence supporting the decision. As a result, the combination of these elements increases the reliability of the generated signals and improves overall risk management, allowing traders to make more informed decisions based on a higher degree of confidence and precision.
Understanding the Strategy
The Signal Pulse script generates trading signals based on the alignment of Bollinger Bands and the Stochastic Oscillator across three timeframes (M15, M30, and H1). The conditions for each signal are as follows:
Buy Signal
- Bollinger Bands Condition: The price touches the lower band of the Bollinger Bands on all three timeframes.
- Stochastic Oscillator Condition: The Stochastic Oscillator indicates an oversold condition on all three timeframes, typically below 20.
- Confirmation Requirement: Both conditions must be met simultaneously across M15, M30, and H1 timeframes to generate a buy signal.
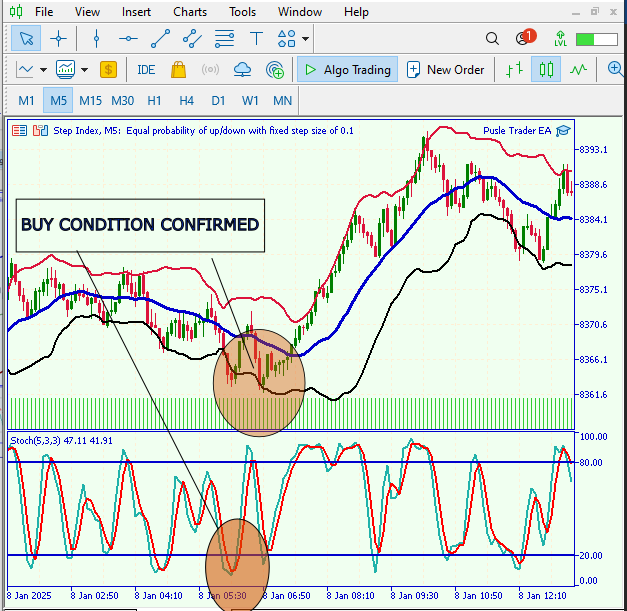
Fig 1. Buy Conditions
Sell Signal
- Bollinger Bands Condition: The price touches the upper band of the Bollinger Bands on all three timeframes.
- Stochastic Oscillator Condition: The Stochastic Oscillator indicates an overbought condition on all three timeframes, typically above 80.
- Confirmation Requirement: Both conditions must be met simultaneously across M15, M30, and H1 timeframes to generate a sell signal.
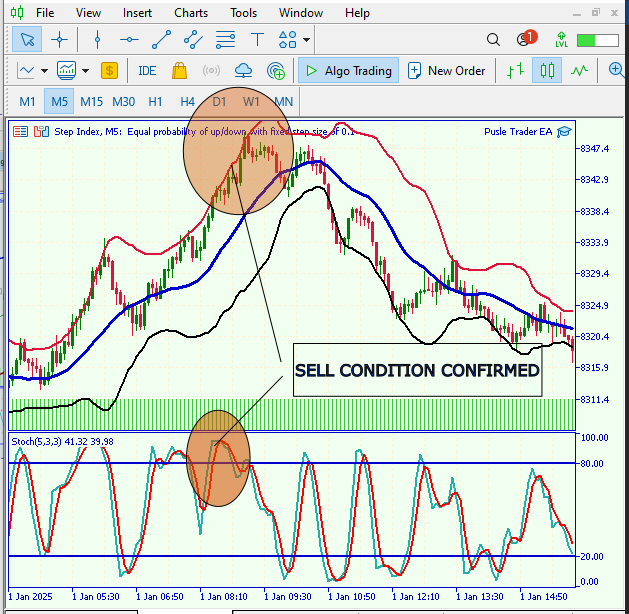
Fig 2. Sell Conditions
Let’s visualize this process through the diagram below.
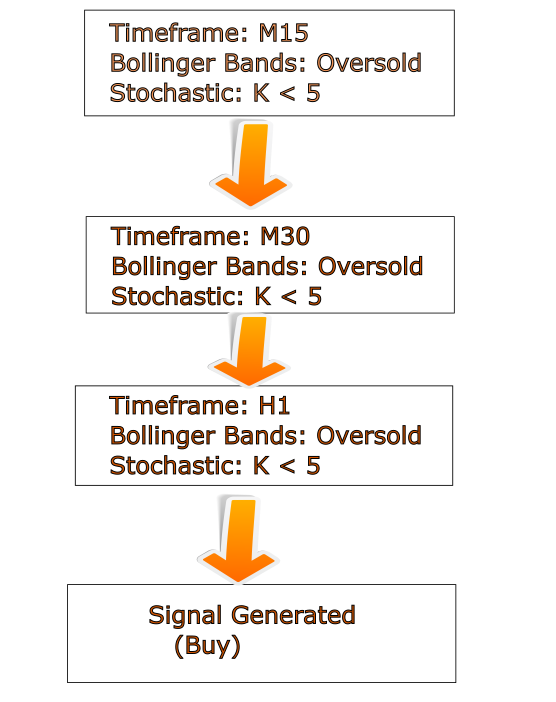
Fig 3. Signal Generation Process
MQL5 Code
//+------------------------------------------------------------------+
//|                                              Signal Pulse EA.mq5 |
//|                                  Copyright 2025, MetaQuotes Ltd. |
//|                                             https://www.mql5.com |
//+------------------------------------------------------------------+
#property copyright "Copyright 2025, MetaQuotes Ltd."
#property link      "https://www.mql5.com"
#property version   "1.00"

// Input parameters
input ENUM_TIMEFRAMES Timeframe1 = PERIOD_M15; // M15 timeframe
input ENUM_TIMEFRAMES Timeframe2 = PERIOD_M30; // M30 timeframe
input ENUM_TIMEFRAMES Timeframe3 = PERIOD_H1;  // H1 timeframe
input int BB_Period = 20;                      // Bollinger Bands period
input double BB_Deviation = 2.0;               // Bollinger Bands deviation
input int K_Period = 14;                       // Stochastic %K period
input int D_Period = 3;                        // Stochastic %D period
input int Slowing = 3;                         // Stochastic slowing
input double SignalOffset = 10.0;              // Offset in points for signal arrow
input int TestBars = 10;                       // Number of bars after signal to test win condition
input double MinArrowDistance = 5.0;          // Minimum distance in points between arrows to avoid overlapping

// Signal tracking structure
struct SignalInfo
  {
   datetime          time;
   double            price;
   bool              isBuySignal;
  };

// Arrays to store signal information
datetime signalTimes[];
double signalPrices[];
bool signalBuySignals[];

//+------------------------------------------------------------------+
//| Retrieve Bollinger Band Levels                                   |
//+------------------------------------------------------------------+
bool GetBollingerBands(ENUM_TIMEFRAMES timeframe, double &upper, double &lower, double &middle)
  {
   int handle = iBands(Symbol(), timeframe, BB_Period, 0, BB_Deviation, PRICE_CLOSE);

   if(handle == INVALID_HANDLE)
     {
      Print("Error creating iBands for timeframe: ", timeframe);
      return false;
     }

   double upperBand[], middleBand[], lowerBand[];

   if(!CopyBuffer(handle, 1, 0, 1, upperBand) ||
      !CopyBuffer(handle, 0, 0, 1, middleBand) ||
      !CopyBuffer(handle, 2, 0, 1, lowerBand))
     {
      Print("Error copying iBands buffer for timeframe: ", timeframe);
      IndicatorRelease(handle);
      return false;
     }

   upper = upperBand[0];
   middle = middleBand[0];
   lower = lowerBand[0];

   IndicatorRelease(handle);
   return true;
  }

//+------------------------------------------------------------------+
//| Retrieve Stochastic Levels                                       |
//+------------------------------------------------------------------+
bool GetStochastic(ENUM_TIMEFRAMES timeframe, double &k_value, double &d_value)
  {
   int handle = iStochastic(Symbol(), timeframe, K_Period, D_Period, Slowing, MODE_SMA, STO_CLOSECLOSE);

   if(handle == INVALID_HANDLE)
     {
      Print("Error creating iStochastic for timeframe: ", timeframe);
      return false;
     }

   double kBuffer[], dBuffer[];

   if(!CopyBuffer(handle, 0, 0, 1, kBuffer) ||  // %K line
      !CopyBuffer(handle, 1, 0, 1, dBuffer))   // %D line
     {
      Print("Error copying iStochastic buffer for timeframe: ", timeframe);
      IndicatorRelease(handle);
      return false;
     }

   k_value = kBuffer[0];
   d_value = dBuffer[0];

   IndicatorRelease(handle);
   return true;
  }

//+------------------------------------------------------------------+
//| Check and Generate Signal                                        |
//+------------------------------------------------------------------+
void CheckAndGenerateSignal()
  {
   double upper1, lower1, middle1, close1;
   double upper2, lower2, middle2, close2;
   double upper3, lower3, middle3, close3;
   double k1, d1, k2, d2, k3, d3;

   if(!GetBollingerBands(Timeframe1, upper1, lower1, middle1) ||
      !GetBollingerBands(Timeframe2, upper2, lower2, middle2) ||
      !GetBollingerBands(Timeframe3, upper3, lower3, middle3))
     {
      Print("Error retrieving Bollinger Bands data.");
      return;
     }

   if(!GetStochastic(Timeframe1, k1, d1) ||
      !GetStochastic(Timeframe2, k2, d2) ||
      !GetStochastic(Timeframe3, k3, d3))
     {
      Print("Error retrieving Stochastic data.");
      return;
     }

// Retrieve the close prices
   close1 = iClose(Symbol(), Timeframe1, 0);
   close2 = iClose(Symbol(), Timeframe2, 0);
   close3 = iClose(Symbol(), Timeframe3, 0);

   bool buySignal = (close1 <= lower1 && close2 <= lower2 && close3 <= lower3) &&
                    (k1 < 5 && k2 < 5 && k3 < 5); // Oversold condition
   bool sellSignal = (close1 >= upper1 && close2 >= upper2 && close3 >= upper3) &&
                     (k1 > 95 && k2 > 95 && k3 > 95); // Overbought condition

// Check if an arrow already exists in the same region before placing a new one
   if(buySignal && !ArrowExists(close1))
     {
      Print("Buy signal detected on all timeframes with Stochastic confirmation!");

      string arrowName = "BuySignal" + IntegerToString(TimeCurrent());
      ObjectCreate(0, arrowName, OBJ_ARROW, 0, TimeCurrent(), close1);
      ObjectSetInteger(0, arrowName, OBJPROP_ARROWCODE, 241);
      ObjectSetInteger(0, arrowName, OBJPROP_COLOR, clrGreen);
      ObjectSetInteger(0, arrowName, OBJPROP_WIDTH, 2);

      // Store signal data
      ArrayResize(signalTimes, ArraySize(signalTimes) + 1);
      ArrayResize(signalPrices, ArraySize(signalPrices) + 1);
      ArrayResize(signalBuySignals, ArraySize(signalBuySignals) + 1);

      signalTimes[ArraySize(signalTimes) - 1] = TimeCurrent();
      signalPrices[ArraySize(signalPrices) - 1] = close1;
      signalBuySignals[ArraySize(signalBuySignals) - 1] = true;
     }

   if(sellSignal && !ArrowExists(close1))
     {
      Print("Sell signal detected on all timeframes with Stochastic confirmation!");

      string arrowName = "SellSignal" + IntegerToString(TimeCurrent());
      ObjectCreate(0, arrowName, OBJ_ARROW, 0, TimeCurrent(), close1);
      ObjectSetInteger(0, arrowName, OBJPROP_ARROWCODE, 242);
      ObjectSetInteger(0, arrowName, OBJPROP_COLOR, clrRed);
      ObjectSetInteger(0, arrowName, OBJPROP_WIDTH, 2);

      // Store signal data
      ArrayResize(signalTimes, ArraySize(signalTimes) + 1);
      ArrayResize(signalPrices, ArraySize(signalPrices) + 1);
      ArrayResize(signalBuySignals, ArraySize(signalBuySignals) + 1);

      signalTimes[ArraySize(signalTimes) - 1] = TimeCurrent();
      signalPrices[ArraySize(signalPrices) - 1] = close1;
      signalBuySignals[ArraySize(signalBuySignals) - 1] = false;
     }
  }

//+------------------------------------------------------------------+
//| Check if an arrow already exists within the MinArrowDistance     |
//+------------------------------------------------------------------+
bool ArrowExists(double price)
  {
   for(int i = 0; i < ArraySize(signalPrices); i++)
     {
      if(MathAbs(signalPrices[i] - price) <= MinArrowDistance)
        {
         return true; // Arrow exists in the same price region
        }
     }
   return false; // No arrow exists in the same region
  }

//+------------------------------------------------------------------+
//| OnTick Event                                                     |
//+------------------------------------------------------------------+
void OnTick()
  {
   CheckAndGenerateSignal();
  }

//+------------------------------------------------------------------+
//| OnDeinit Function                                                |
//+------------------------------------------------------------------+
void OnDeinit(const int reason)
  {
// Clean up the objects
   long chart_id = 0;
   for(int i = ObjectsTotal(chart_id) - 1; i >= 0; i--)
     {
      string name = ObjectName(chart_id, i);
      if(StringFind(name, "Signal") != -1)
        {
         ObjectDelete(chart_id, name);
        }
     }

   Print("Multitimeframe Bollinger-Stochastic Analyzer deinitialized.");
  }
//+------------------------------------------------------------------+
Code Breakdown
This breakdown of the Signal Pulse EA will explore the various components of the Expert Advisor, its operational mechanisms, and the underlying logic of its functionalities, step by step. This breakdown of the Signal Pulse EA will explore the various components of the Expert Advisor, its operational mechanisms, and the underlying logic of its functionalities, step by step. - Header, Properties, and Input Parameters
At the very start of our EA, we include a header that provides essential metadata. This consists of the name of the EA, copyright details, and a link to where you can learn more about our work. But what really helps you as a trader are the input parameters. These customizable settings allow you to tailor the EA's behavior to fit your trading style.
//+------------------------------------------------------------------+
//|                                              Signal Pulse EA.mq5 |
//|                                  Copyright 2024, MetaQuotes Ltd. |
//|                                             https://www.mql5.com |
//+------------------------------------------------------------------+
#property copyright "Christian Benjamin"
#property link      "https://www.mql5.com/en/users/lynnchris"
#property version   "1.00"

// Input parameters
input ENUM_TIMEFRAMES Timeframe1 = PERIOD_M15; // M15 timeframe
input ENUM_TIMEFRAMES Timeframe2 = PERIOD_M30; // M30 timeframe
input ENUM_TIMEFRAMES Timeframe3 = PERIOD_H1;  // H1 timeframe
input int BB_Period = 20;                      // Bollinger Bands period
input double BB_Deviation = 2.0;               // Bollinger Bands deviation
input int K_Period = 14;                       // Stochastic %K period
input int D_Period = 3;                        // Stochastic %D period
input int Slowing = 3;                         // Stochastic slowing
input double SignalOffset = 10.0;              // Offset in points for signal arrow
input int TestBars = 10;                       // Number of bars after signal to test win condition
input double MinArrowDistance = 5.0;          // Minimum distance in points between arrows to avoid overlapping
Here, we specify different timeframes (M15, M30 and H1), allowing you to analyze price movements across several periods. We also define parameters for the Bollinger Bands, such as its period and deviation, along with settings for the Stochastic oscillator, including its %K and %D periods. We even include visual settings for the arrows that will mark buy and sell signals on your chart, along with parameters designed to minimize visual clutter by preventing overlapping arrows.
- Signal Tracking and Structures
Next, we define the SignalInfo structure, which plays a vital role in organizing our trading signals. This structure collects information about when a signal occurred, the price at that moment, and whether it was a buy or sell signal. Additionally, we set up arrays to store this information dynamically.
// Signal tracking structure
struct SignalInfo {
   datetime time;
   double price;
   bool isBuySignal;
};

// Arrays to store signal information
datetime signalTimes[];
double signalPrices[];
bool signalBuySignals[];
With the signalTimes, signalPrices, and signalBuySignals arrays, we maintain a clear record of the trading signals that the EA generates over time, making it much easier to handle multiple signals without getting confused.
- Indicator Retrieval Functions
Now let's elaborate on the functions we use to retrieve indicator values—specifically, the Bollinger Bands and Stochastic indicators.
//+------------------------------------------------------------------+
//| Retrieve Bollinger Band Levels                                   |
//+------------------------------------------------------------------+
bool GetBollingerBands(ENUM_TIMEFRAMES timeframe, double &upper, double &lower, double &middle) {
   int handle = iBands(Symbol(), timeframe, BB_Period, 0, BB_Deviation, PRICE_CLOSE);

   if(handle == INVALID_HANDLE) {
      Print("Error creating iBands for timeframe: ", timeframe);
      return false;
   }

   double upperBand[], middleBand[], lowerBand[];

   if(!CopyBuffer(handle, 1, 0, 1, upperBand) ||
      !CopyBuffer(handle, 0, 0, 1, middleBand) ||
      !CopyBuffer(handle, 2, 0, 1, lowerBand)) {
      Print("Error copying iBands buffer for timeframe: ", timeframe);
      IndicatorRelease(handle);
      return false;
   }

   upper = upperBand[0];
   middle = middleBand[0];
   lower = lowerBand[0];

   IndicatorRelease(handle);
   return true;
}

//+------------------------------------------------------------------+
//| Retrieve Stochastic Levels                                       |
//+------------------------------------------------------------------+
bool GetStochastic(ENUM_TIMEFRAMES timeframe, double &k_value, double &d_value) {
   int handle = iStochastic(Symbol(), timeframe, K_Period, D_Period, Slowing, MODE_SMA, STO_CLOSECLOSE);

   if(handle == INVALID_HANDLE) {
      Print("Error creating iStochastic for timeframe: ", timeframe);
      return false;
   }

   double kBuffer[], dBuffer[];

   if(!CopyBuffer(handle, 0, 0, 1, kBuffer) ||  // %K line
      !CopyBuffer(handle, 1, 0, 1, dBuffer)) { // %D line
      Print("Error copying iStochastic buffer for timeframe: ", timeframe);
      IndicatorRelease(handle);
      return false;
   }

   k_value = kBuffer[0];
   d_value = dBuffer[0];

   IndicatorRelease(handle);
   return true;
}
The first function, GetBollingerBands(), fetches the upper, middle, and lower levels of the Bollinger Bands for a given timeframe. It creates a handle for the indicator and checks if it was created successfully. If everything checks out, it copies the band values into arrays, which we can later use for our trading logic. Similarly, the GetStochastic() function retrieves the %K and %D values of the Stochastic oscillator. It uses the same error-checking and data-copying procedures, ensuring that we always get accurate data for our decision-making.
- Signal Checking and Generating
With the indicators handled, we now move on to the CheckAndGenerateSignal() function, which contains the core logic of our EA. This function calls our earlier defined indicator functions to gather data from the Bollinger Bands and Stochastic indicators across all specified timeframes. Additionally, it fetches the latest closing prices for these timeframes.
The function checks for buy and sell signals based on the current market conditions. A buy signal is triggered when the closing prices are below the lower Bollinger Band, and the Stochastic values indicate oversold conditions (less than 5). Conversely, sell signals arise when prices exceed the upper Bollinger Band, with Stochastic readings over 95, suggesting overbought conditions.
//+------------------------------------------------------------------+
//| Check and Generate Signal                                        |
//+------------------------------------------------------------------+
void CheckAndGenerateSignal() {
   double upper1, lower1, middle1, close1;
   double upper2, lower2, middle2, close2;
   double upper3, lower3, middle3, close3;
   double k1, d1, k2, d2, k3, d3;

   if(!GetBollingerBands(Timeframe1, upper1, lower1, middle1) ||
      !GetBollingerBands(Timeframe2, upper2, lower2, middle2) ||
      !GetBollingerBands(Timeframe3, upper3, lower3, middle3)) {
      Print("Error retrieving Bollinger Bands data.");
      return;
   }

   if(!GetStochastic(Timeframe1, k1, d1) ||
      !GetStochastic(Timeframe2, k2, d2) ||
      !GetStochastic(Timeframe3, k3, d3)) {
      Print("Error retrieving Stochastic data.");
      return;
   }

   // Retrieve the close prices
   close1 = iClose(Symbol(), Timeframe1, 0);
   close2 = iClose(Symbol(), Timeframe2, 0);
   close3 = iClose(Symbol(), Timeframe3, 0);

   bool buySignal = (close1 <= lower1 && close2 <= lower2 && close3 <= lower3) &&
                    (k1 < 5 && k2 < 5 && k3 < 5); // Oversold condition
   bool sellSignal = (close1 >= upper1 && close2 >= upper2 && close3 >= upper3) &&
                     (k1 > 95 && k2 > 95 && k3 > 95); // Overbought condition

   // Check if an arrow already exists in the same region before placing a new one
   if(buySignal && !ArrowExists(close1)) {
      Print("Buy signal detected on all timeframes with Stochastic confirmation!");
      string arrowName = "BuySignal" + IntegerToString(TimeCurrent());
      ObjectCreate(0, arrowName, OBJ_ARROW, 0, TimeCurrent(), close1);
      ObjectSetInteger(0, arrowName, OBJPROP_ARROWCODE, 241);
      ObjectSetInteger(0, arrowName, OBJPROP_COLOR, clrGreen);
      ObjectSetInteger(0, arrowName, OBJPROP_WIDTH, 2);

      // Store signal data
      ArrayResize(signalTimes, ArraySize(signalTimes) + 1);
      ArrayResize(signalPrices, ArraySize(signalPrices) + 1);
      ArrayResize(signalBuySignals, ArraySize(signalBuySignals) + 1);

      signalTimes[ArraySize(signalTimes) - 1] = TimeCurrent();
      signalPrices[ArraySize(signalPrices) - 1] = close1;
      signalBuySignals[ArraySize(signalBuySignals) - 1] = true;
   }

   if(sellSignal && !ArrowExists(close1)) {
      Print("Sell signal detected on all timeframes with Stochastic confirmation!");
      string arrowName = "SellSignal" + IntegerToString(TimeCurrent());
      ObjectCreate(0, arrowName, OBJ_ARROW, 0, TimeCurrent(), close1);
      ObjectSetInteger(0, arrowName, OBJPROP_ARROWCODE, 242);
      ObjectSetInteger(0, arrowName, OBJPROP_COLOR, clrRed);
      ObjectSetInteger(0, arrowName, OBJPROP_WIDTH, 2);

      // Store signal data
      ArrayResize(signalTimes, ArraySize(signalTimes) + 1);
      ArrayResize(signalPrices, ArraySize(signalPrices) + 1);
      ArrayResize(signalBuySignals, ArraySize(signalBuySignals) + 1);

      signalTimes[ArraySize(signalTimes) - 1] = TimeCurrent();
      signalPrices[ArraySize(signalPrices) - 1] = close1;
      signalBuySignals[ArraySize(signalBuySignals) - 1] = false;
   }
}
Moreover, before placing an arrow to indicate a signal on the chart, the function ensures that no existing arrow overlaps by invoking the ArrowExists() function. If everything checks out, it creates the appropriate arrow and stores information about the signal in our previously defined arrays.
- Arrow Existence Check
In our pursuit of a tidy chart, the ArrowExists() function plays an important role by checking whether any existing arrow is near the price of the current signal. This prevents multiple arrows from overlapping, which could lead to confusion. By comparing the new signal price with the prices stored in the signalPrices array, we determine if an existing arrow is close enough to warrant skipping the creation of a new one.
//+------------------------------------------------------------------+
//| Check if an arrow already exists within the MinArrowDistance     |
//+------------------------------------------------------------------+
bool ArrowExists(double price) {
   for(int i = 0; i < ArraySize(signalPrices); i++) {
      if(MathAbs(signalPrices[i] - price) <= MinArrowDistance) {
         return true; // Arrow exists in the same price region
      }
   }
   return false; // No arrow exists in the same region
}
- OnTick and OnDeinit Functions
Finally, we have the OnTick() and OnDeinit() functions. The OnTick() function is called every time there’s a new market tick, ensuring that our EA remains responsive and up-to-date. It invokes the CheckAndGenerateSignal() function to re-evaluate potential trading signals based on the latest data.
In contrast, the OnDeinit() function is called when the EA is removed or the terminal is closed. Its responsibility is to clean up any graphical objects created by the EA—specifically the arrows marking buy and sell signals, thereby maintaining a clutter-free chart.
//+------------------------------------------------------------------+
//| OnTick Event                                                     |
//+------------------------------------------------------------------+
void OnTick() {
   CheckAndGenerateSignal();
}

//+------------------------------------------------------------------+
//| OnDeinit Function                                                |
//+------------------------------------------------------------------+
void OnDeinit(const int reason) {
   // Clean up the objects
   long chart_id = 0;
   for(int i = ObjectsTotal(chart_id) - 1; i >= 0; i--) {
      string name = ObjectName(chart_id, i);
      if(StringFind(name, "Signal") != -1) {
         ObjectDelete(chart_id, name);
      }
   }

   Print("Multitimeframe Bollinger-Stochastic Analyzer deinitialized.");
}
Additionally, in the Signal Pulse EA, we adjusted the threshold levels for the Stochastic Oscillator to ensure that only the most reliable signals are generated. These adjustments focus on confirming that the market is in extreme conditions—either oversold for buy signals or overbought for sell signals—before taking action.
- Oversold Condition: Buy Signal
bool buySignal = (close1 <= lower1 && close2 <= lower2 && close3 <= lower3) &&
                 (k1 < 5 && k2 < 5 && k3 < 5); // Oversold condition
For a buy signal, the price must be at or below the lower Bollinger Band across all three timeframes (M15, M30, H1), indicating strong downside pressure. Additionally, the Stochastic Oscillator's %K value must be less than 5 across all three timeframes. This value indicates an extreme oversold condition where the market is highly likely to reverse upwards. The stricter threshold of < 5 ensures that the EA only considers signals where the probability of a reversal is significantly high.
- Overbought Condition: Sell Signal
bool sellSignal = (close1 >= upper1 && close2 >= upper2 && close3 >= upper3) &&
                  (k1 > 95 && k2 > 95 && k3 > 95); // Overbought condition
For a sell signal, the price must be at or above the upper Bollinger Band across all three timeframes, indicating strong upward momentum that may soon reverse. The Stochastic Oscillator's %K value must exceed 95 on all timeframes, signaling an extreme overbought condition where the market is likely to turn bearish. This tight condition ensures that the EA avoids false sell signals during moderate price movements or consolidations.
Testing and Results
- Backtesting with Historical Data
1. Load Historical Data
To begin backtesting, it is essential to load high-quality, tick-level historical data for the chosen instrument and timeframes. This data will serve as the foundation for evaluating the EA's performance. It is crucial to ensure that the data is accurate and reliable, as any discrepancies can lead to incorrect conclusions about the EA's performance.
Once the data is loaded, it's time to configure the strategy tester in MetaTrader with the necessary parameters. This includes:2. Set Testing Parameters
- Symbol: Select the currency pair or asset to be traded.
- Period: Use the same timeframes as the EA's settings (e.g., M15, M30, H1).
- Spread: Set a realistic or fixed spread to simulate trading costs and ensure that the results are representative of real-world trading conditions.
- Optimization: Test the input parameters (e.g., Bollinger Bands period, Stochastic thresholds) for optimal performance.
3. Evaluate ResultsAfter setting the testing parameters, it's time to analyze the output metrics:
- Profitability: Evaluate the EA's net profit and profit factor to determine its overall profitability.
- Risk: Assess the maximal drawdown to gauge the EA's risk tolerance.
- Win Rate and Trade Frequency: Analyze the number of winning trades and trade frequency to understand the EA's performance in different market conditions.
Let's review the test results provided below.
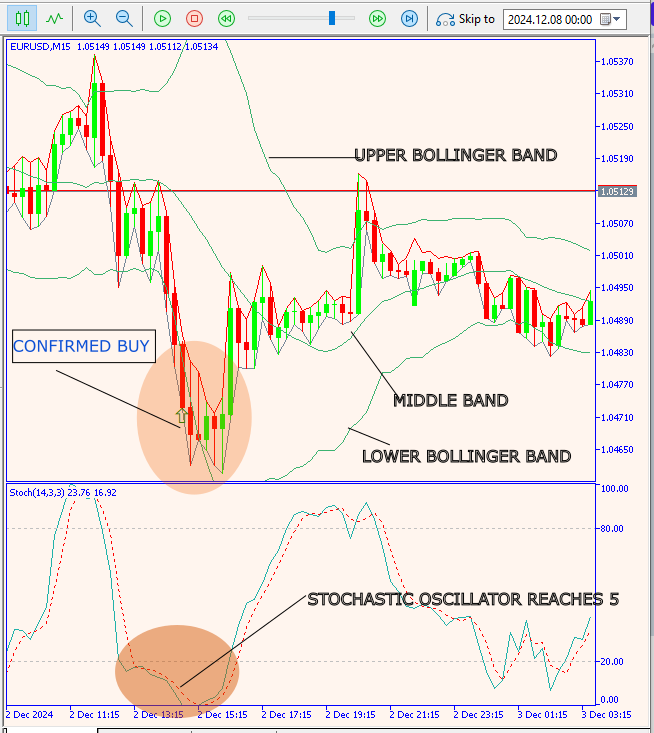
Fig 4. Test Result 1
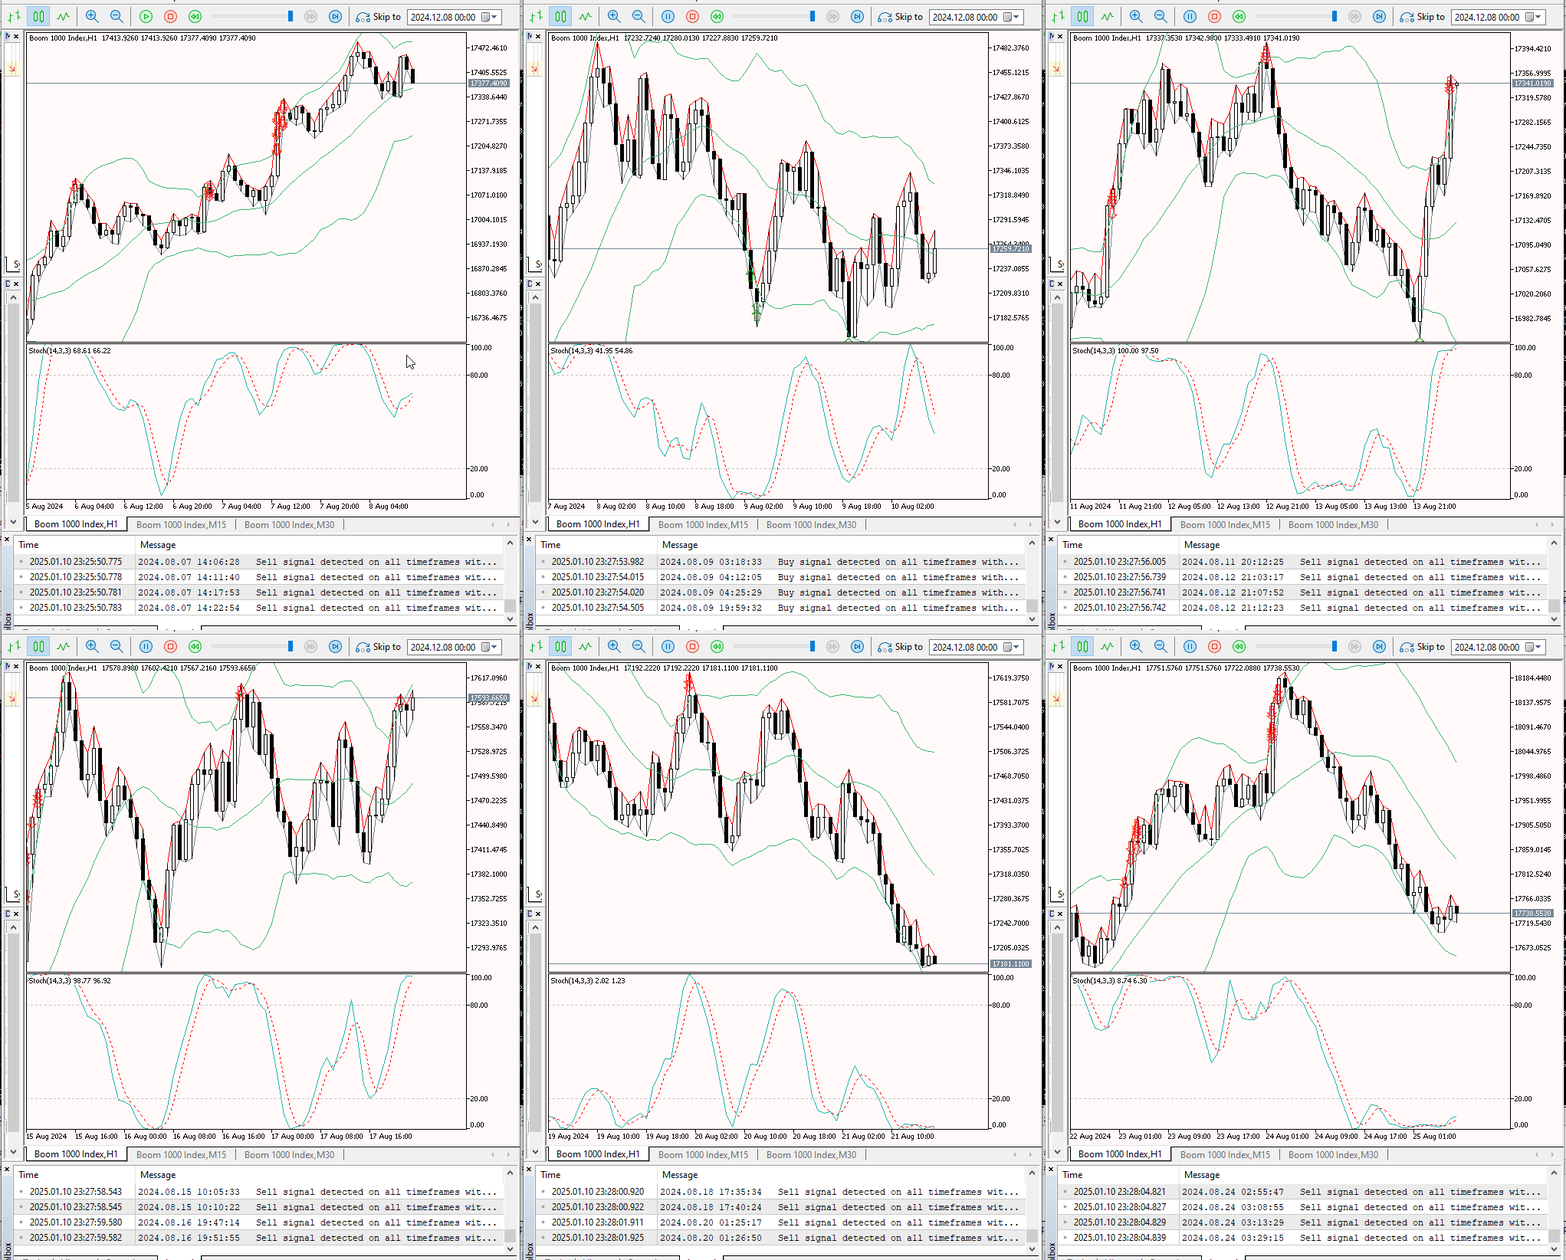
Fig 5. Test Result 2
The diagrams above illustrate the performance test of the EA. In the GIF, we can observe the logging of every detected signal. You can further test by altering input parameters, time frames, and stochastic levels until you achieve results that satisfy your requirements.
Conclusion
In this article, we've developed the 'Pulse Trader' Expert Advisor, combining Bollinger Bands and Stochastic Oscillator indicators to generate trading signals across M15, M30, and H1 timeframes. The system identifies overbought/oversold conditions only when multiple timeframes align, increasing the probability of success. Thorough backtesting in various market conditions is essential. Future improvements could include adding trend direction filters, advanced risk management, and refining signal logic for different market types. We encourage traders to use 'Signal Pulse' together with their own strategies and techniques for a comprehensive approach to trading.
| Date | Tool Name | Description | Version | Updates | Notes |
|---|---|---|---|---|---|
| 01/10/24 | Chart Projector | Script to overlay the previous day's price action with ghost effect. | 1.0 | Initial Release | First tool in Lynnchris Tool Chest |
| 18/11/24 | Analytical Comment | It provides previous day's information in a tabular format, as well as anticipates the future direction of the market. | 1.0 | Initial Release | Second tool in the Lynnchris Tool Chest |
| 27/11/24 | Analytics Master | Regular Update of market metrics after every two hours | 1.01 | Second Release | Third tool in the Lynnchris Tool Chest |
| 02/12/24 | Analytics Forecaster | Regular Update of market metrics after every two hours with telegram integration | 1.1 | Third Edition | Tool number 4 |
| 09/12/24 | Volatility Navigator | The EA analyzes market conditions using the Bollinger Bands, RSI and ATR indicators | 1.0 | Initial Release | Tool Number 5 |
| 19/12/24 | Mean Reversion Signal Reaper | Analyzes market using mean reversion strategy and provides signal | 1.0 | Initial Release | Tool number 6 |
| 9/01/2025 | Signal Pulse | Multiple timeframe analyzer | 1.0 | Initial Release | Tool number 7 |
 Hidden Markov Models for Trend-Following Volatility Prediction
 Mastering Log Records (Part 2): Formatting Logs
 Developing a multi-currency Expert Advisor (Part 15): Preparing EA for real trading
 Developing a Replay System (Part 56): Adapting the Modules
- Free trading apps
- Over 8,000 signals for copying
- Economic news for exploring financial markets
You agree to website policy and terms of use