Price Action Analysis Toolkit Development (Part 11): Heikin Ashi Signal EA
Introduction
Mathematical formulas serve as a cornerstone in price action analysis, providing an objective method to decode market data and guide trading decisions. In the South African forex market, for instance, a trader evaluating the ZAR/USD pair might use a 50-day Simple Moving Average to detect trend reversals while applying standard deviation to gauge market volatility, thereby confirming potential breakouts. Incorporating formulas for position sizing and risk management, such as calculating trade size based on a set risk percentage and stop-loss distance, enables the trader to effectively manage risk and establish clear profit targets through tools like Fibonacci retracements.
In this article, we are excited to introduce the Heikin Ashi technique for trend reversal calculations, adding another layer to our integrated strategy that combines quantitative analysis with classic price action methods. One significant advantage of Heikin Ashi is its ability to filter out market noise, allowing traders to focus on the underlying trend without being distracted by minor price fluctuations. This approach smooths out market fluctuations and ensures that decisions are data-driven, providing a disciplined framework applicable to diverse financial markets worldwide.
We will start by defining Heikin Ashi and exploring its origins. Then, without unnecessary detours, we’ll dive straight into the strategy so you can understand exactly how it works. We’ll also examine other key functions, provide the complete code, and finally review the outcomes before wrapping up the article. Now, let’s take a look at the table of contents.
Heikin Ashi
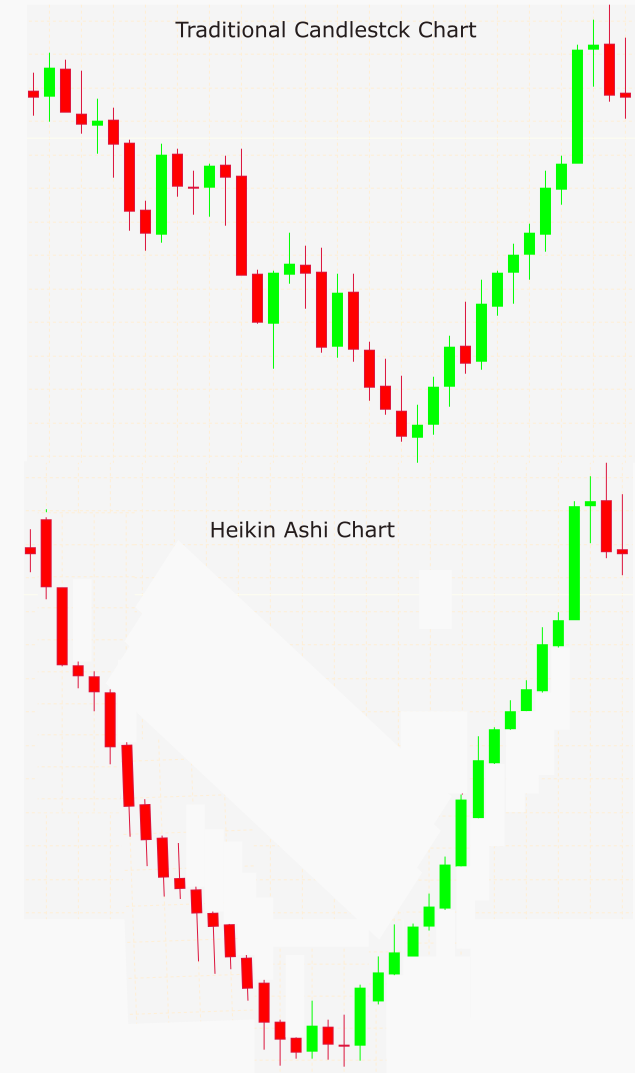
The Heikin Ashi technique was developed by Munehisa Homma, an 18th-century Japanese rice trader who is also credited with pioneering candlestick charting, a fundamental tool in technical analysis. Originating in Japan, Heikin Ashi was designed to help traders achieve a clearer perspective on market trends by focusing on average price movement rather than individual candlestick formations. In Japanese, Heikin means “average” or “balance,” while Ashi translates to “bar” or “candlestick.” This naming reflects the core principle of Heikin Ashi charts—smoothing price data to provide a more balanced and less volatile view of market movements. Let's take a look at the diagram below, which illustrates how a traditional candlestick chart is transformed into a smoother Heikin Ashi chart.

Fig 1. Smoothened Chart
The table below compares Traditional Candlesticks and Heikin Ashi Candlesticks, highlighting their key differences.
| Feature | Traditional Candlesticks | Heikin Ashi Candlesticks |
|---|---|---|
| Calculation Basis | Uses actual open, high, low, and close prices. | Uses a modified formula averaging price data. |
| Volatility Display | Shows real price fluctuations and gaps. | Smooths out price action, reducing noise. |
| Trend Clarity | Can be choppy, with alternating red and green candles even in trends. | Provides smoother trends with fewer color changes. |
| Gap Visibility | Shows price gaps between candlesticks. | Rarely shows gaps due to the averaging formula. |
| Reversal Signals | Reversal SignalsShows quick reversals and wicks. | Reversals are slower but stronger when confirmed. |
| Price Representation | Reflects actual market prices. | Averages prices, meaning the last price does not match the real market price. |
Strategy
This strategy is built around four main functions in the MQL5 EA: Heikin Ashi calculation, trend confirmation, reversal signal identification, and signal confirmation using RSI. Let’s break each of them down in detail below.
Heikin Ashi calculation
Heikin Ashi charts are constructed using four key data points: open, high, low, and close prices for each period. These values are processed to generate Heikin Ashi candlesticks, which differ from traditional candlesticks. Instead of reflecting raw price action, Heikin Ashi candlesticks use averaged price calculations—blending the open and close prices, as well as the high and low prices—to create a more fluid representation of market trends.
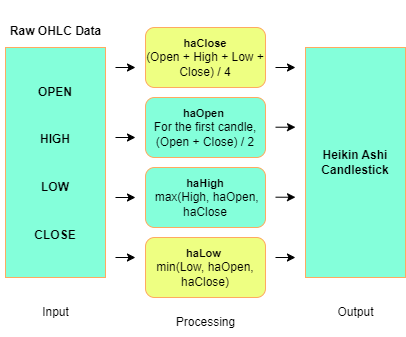
This smoothing effect minimizes the impact of sudden price fluctuations, reducing market noise and making trends easier to identify. As a result, Heikin Ashi candlesticks often feature smaller bodies and longer wicks, highlighting market momentum while filtering out short-term volatility. To implement the Heikin Ashi strategy, the following flowchart demonstrates how traditional candlestick data is transformed into a smooth, trend focused Heikin Ashi chart. This process filters out market noise and provides a clearer perspective of the prevailing trend. Below is a step-by-step breakdown of how it works:

Fig 2. Flowchart
The flowchart illustrates how traditional OHLC data is transformed into Heikin Ashi candlesticks. The process begins with raw market data, which is then smoothed by calculating an average for the closing price (haClose). The open price (haOpen) is determined using the previous candle’s values to create continuity, while haHigh and haLow ensure the candle reflects the full range of price movements. The result is a candlestick that reduces short-term volatility, making overall trends more visible. Below is the MQL5 code snippet for the function that calculates Heikin Ashi candles.
void CalculateHeikinAshi()
{
   MqlRates rates[];
   int copied = CopyRates(_Symbol, _Period, 0, Bars(_Symbol, _Period), rates);

   if(copied < TrendCandles + 2)
   {
      Print("Failed to copy rates. Copied: ", copied);
      return;
   }

   ArraySetAsSeries(rates, true);

   // Resize arrays to match the number of copied bars
   ArrayResize(haClose, copied);
   ArrayResize(haOpen, copied);
   ArrayResize(haHigh, copied);
   ArrayResize(haLow, copied);

   // Calculate Heikin-Ashi values for each bar
   for(int i = copied - 1; i >= 0; i--)
   {
      haClose[i] = (rates[i].open + rates[i].high + rates[i].low + rates[i].close) / 4.0;
      haOpen[i] = (i == copied - 1) ? (rates[i].open + rates[i].close) / 2.0
                                   : (haOpen[i + 1] + haClose[i + 1]) / 2.0;
      haHigh[i] = MathMax(rates[i].high, MathMax(haOpen[i], haClose[i]));
      haLow[i] = MathMin(rates[i].low, MathMin(haOpen[i], haClose[i]));
   }

   Print("Heikin-Ashi Calculation Complete");
}
The result is a series of Heikin Ashi candlesticks that filter out much of the market noise, allowing the underlying trend to become more apparent.
Trend Confirmation
Before attempting to identify any reversal signals, the EA performs trend confirmation to ensure that a strong directional movement is in place. This involves analyzing a specified number of consecutive Heikin Ashi candles. For a bullish trend, the EA checks that each candle’s haClose is higher than that of the subsequent candle, whereas for a bearish trend, it verifies that the haClose values are consecutively lower. The number of candles required to confirm the trend is controlled by input parameters, ensuring that only well-established trends are considered. This stringent check minimizes the risk of false signals by confirming that the market is decisively trending before moving on to reversal detection.
int consecutive = 0;
for(int i = 2; i <= TrendCandles + 1; i++)
{
   if((haClose[i] > haClose[i + 1] && isBullish) || (haClose[i] < haClose[i + 1] && !isBullish))
      consecutive++;
   else
      break;
}
if(consecutive < ConsecutiveCandles)
   return false;
This step ensures that a signal is only considered when there is strong evidence of an ongoing trend, reducing the chances of false signals from random market fluctuations.
Reversal Signal Identification
After confirming an established trend, the EA proceeds to identify potential reversal signals by closely examining the structure of the next Heikin Ashi candle. At this stage, the EA calculates the candle’s body as the absolute difference between haClose and haOpen, and it measures the shadow based on the direction of interest—focusing on the lower shadow for a bullish reversal and the upper shadow for a bearish reversal. A key condition is that the ratio of the shadow to the body must exceed a predefined threshold. This high shadow-to-body ratio indicates that the market has strongly rejected the prevailing trend, as evidenced by a long wick in relation to a small body. Such a pattern serves as a robust indicator that a reversal might be underway.
// Check for a strong reversal candlestick
double body = MathAbs(haClose[1] - haOpen[1]);
double shadow = (direction > 0) ? MathAbs(haLow[1] - haOpen[1])
                                : MathAbs(haHigh[1] - haOpen[1]);

// Avoid division by zero and confirm shadow-to-body ratio
if(body == 0.0 || (shadow / body) < ShadowToBodyRatio)
   return false;
This step filters out weak or ambiguous signals by requiring a strong reversal characteristic in the candle's structure before proceeding.
Signal Confirmation with RSI
The final step in the strategy involves confirming the reversal signal using the Relative Strength Index (RSI), which adds an extra layer of validation. Once a potential reversal is identified through the Heikin Ashi criteria, the EA retrieves the latest RSI value to evaluate market momentum. For a bullish reversal signal, the RSI must be below a designated buy threshold, indicating that the asset is oversold; conversely, for a bearish reversal, the RSI must exceed a specified sell threshold, suggesting that the asset is overbought. Only when both the Heikin Ashi pattern and the RSI condition are satisfied does the EA generate a trading signal—such as drawing a buy or sell arrow on the chart. This dual confirmation approach helps to reduce false signals, ensuring that trades are executed only when multiple indicators corroborate a market reversal.
// Get RSI Value
double rsiValue;
if(!GetRSIValue(rsiValue))
{
   Print("Failed to retrieve RSI value.");
   return;
}

// Detect potential reversals with RSI confirmation
if(DetectReversal(true) && rsiValue < RSI_Buy_Threshold)  // Bullish reversal with RSI confirmation
{
   DrawArrow("BuyArrow", iTime(NULL, 0, 0), SymbolInfoDouble(_Symbol, SYMBOL_BID), 233, BuyArrowColor);
   Print("Bullish Reversal Detected - RSI:", rsiValue);
}
else if(DetectReversal(false) && rsiValue > RSI_Sell_Threshold)  // Bearish reversal with RSI confirmation
{
   DrawArrow("SellArrow", iTime(NULL, 0, 0), SymbolInfoDouble(_Symbol, SYMBOL_ASK), 234, SellArrowColor);
   Print("Bearish Reversal Detected - RSI:", rsiValue);
}
The RSI confirmation adds a layer of momentum analysis. By combining price action via (Heikin Ashi) with momentum via (RSI), the EA improves the reliability of the signals, ensuring that trades are entered only when multiple indicators align.
Other Functions
Input Parameters
Before diving into the core logic, we need to define a set of input parameters that will allow us to fine-tune the EA’s behavior. These parameters let us control trend confirmation rules, reversal conditions, volume thresholds, RSI settings, and signal visualization, all without modifying the code.
input int TrendCandles = 3;                 // Number of candles for trend detection
input double ShadowToBodyRatio = 1.5;       // Shadow-to-body ratio for reversal detection
input int ConsecutiveCandles = 2;           // Consecutive candles to confirm trend
input int RSI_Period = 14;                  // RSI Period
input double RSI_Buy_Threshold = 34.0;      // RSI level for buy confirmation
input double RSI_Sell_Threshold = 65.0;     // RSI level for sell confirmation
input color BuyArrowColor = clrGreen;       // Buy signal color
input color SellArrowColor = clrRed;        // Sell signal color
These parameters give us control over key aspects of the strategy. The TrendCandles setting defines how many Heikin Ashicandles we consider when identifying trends. The ShadowToBodyRatio ensures that we only consider strong reversal candles. ConsecutiveCandles filters out weak trends by requiring at least two candles to confirm a direction. RSI_Buy_Threshold and RSI_Sell_Threshold add another layer of confirmation using RSI. BuyArrowColor and SellArrowColor allow us to customize how the signals appear on the chart.
Global Variables
To make sure our calculations run efficiently, we declare global arrays for storing Heikin Ashi values, as well as a handle for the RSI indicator.
double haClose[], haOpen[], haHigh[], haLow[];
int rsiHandle;
We use these variables to store the computed Heikin Ashi values and fetch RSI readings dynamically in our EA.
Initialization (OnInit)
When we attach the EA to the chart, the OnInit() function runs first. It sets up our Heikin Ashi arrays and initializes the RSI indicator.
int OnInit()
{
   ArraySetAsSeries(haClose, true);
   ArraySetAsSeries(haOpen, true);
   ArraySetAsSeries(haHigh, true);
   ArraySetAsSeries(haLow, true);

   if(Bars(_Symbol, _Period) < TrendCandles + 2)
   {
      Print("Not enough bars for initialization.");
      return INIT_FAILED;
   }

   rsiHandle = iRSI(_Symbol, _Period, RSI_Period, PRICE_CLOSE);
   if(rsiHandle == INVALID_HANDLE)
   {
      Print("Failed to create RSI indicator.");
      return INIT_FAILED;
   }

   Print("EA Initialized Successfully");
   return INIT_SUCCEEDED;
}
Here, we set our arrays in reverse order, so the latest candle is always at index 0. We check if there are enough bars available before running calculations. We initialize the RSI indicator and handle any errors if it fails. If everything is set up correctly, the EA prints a confirmation message and starts running.
Tick Processing (OnTick)
This function executes on every new price tick, ensuring that we continuously analyze the market and identify potential trading signals.
void OnTick()
{
   if(Bars(_Symbol, _Period) < TrendCandles + 2)
   {
      Print("Not enough bars for tick processing.");
      return;
   }

   CalculateHeikinAshi();

   double rsiValue;
   if(!GetRSIValue(rsiValue))
   {
      Print("Failed to retrieve RSI value.");
      return;
   }

   if(DetectReversal(true) && rsiValue < RSI_Buy_Threshold)
   {
      DrawArrow("BuyArrow", iTime(NULL, 0, 0), SymbolInfoDouble(_Symbol, SYMBOL_BID), 233, BuyArrowColor);
      Print("Bullish Reversal Detected - RSI:", rsiValue);
   }
   else if(DetectReversal(false) && rsiValue > RSI_Sell_Threshold)
   {
      DrawArrow("SellArrow", iTime(NULL, 0, 0), SymbolInfoDouble(_Symbol, SYMBOL_ASK), 234, SellArrowColor);
      Print("Bearish Reversal Detected - RSI:", rsiValue);
   }
}
We generate a unique name for each arrow based on the signal timestamp. If an existing arrow with the same name is found, we delete it to avoid clutter. Then, we create a new arrow object and set its properties (color, size, and type). If successful, we print a message confirming the arrow was placed.
Cleanup on Deinitialization (OnDeinit)
When we remove the EA from the chart, we need to release indicator resources to avoid memory issues.
void OnDeinit(const int reason)
{
   if(rsiHandle != INVALID_HANDLE)
      IndicatorRelease(rsiHandle);
}
This function ensures that the RSI indicator is properly removed when the EA stops running.
MQL5 Code
//+------------------------------------------------------------------+
//|                                        Heikin Ashi Signal EA.mq5 |
//|                              Copyright 2025, Christian Benjamin. |
//|                                             https://www.mql5.com |
//+------------------------------------------------------------------+
#property copyright "Copyright 2025, Christian Benjamin."
#property link      "https://www.mql5.com/en/users/lynnchris"
#property version   "1.00"
#property strict

//--- Input parameters
input int TrendCandles = 3;                 // Number of candles for trend detection
input double ShadowToBodyRatio = 1.5;       // Shadow-to-body ratio for reversal detection
input int ConsecutiveCandles = 2;           // Consecutive candles to confirm trend
input int RSI_Period = 14;                  // RSI Period
input double RSI_Buy_Threshold = 34.0;      // RSI level for buy confirmation
input double RSI_Sell_Threshold = 65.0;     // RSI level for sell confirmation
input color BuyArrowColor = clrGreen;       // Buy signal color
input color SellArrowColor = clrRed;        // Sell signal color

//--- Global variables
double haClose[], haOpen[], haHigh[], haLow[];
int rsiHandle;

//+------------------------------------------------------------------+
//| Expert initialization                                            |
//+------------------------------------------------------------------+
int OnInit()
  {
   ArraySetAsSeries(haClose, true);
   ArraySetAsSeries(haOpen, true);
   ArraySetAsSeries(haHigh, true);
   ArraySetAsSeries(haLow, true);

   if(Bars(_Symbol, _Period) < TrendCandles + 2)
     {
      Print("Not enough bars for initialization.");
      return INIT_FAILED;
     }

// Initialize RSI indicator
   rsiHandle = iRSI(_Symbol, _Period, RSI_Period, PRICE_CLOSE);
   if(rsiHandle == INVALID_HANDLE)
     {
      Print("Failed to create RSI indicator.");
      return INIT_FAILED;
     }

   Print("EA Initialized Successfully");
   return INIT_SUCCEEDED;
  }

//+------------------------------------------------------------------+
//| Expert tick function                                             |
//+------------------------------------------------------------------+
void OnTick()
  {
   if(Bars(_Symbol, _Period) < TrendCandles + 2)
     {
      Print("Not enough bars for tick processing.");
      return;
     }

// Calculate Heikin-Ashi
   CalculateHeikinAshi();

// Get RSI Value
   double rsiValue;
   if(!GetRSIValue(rsiValue))
     {
      Print("Failed to retrieve RSI value.");
      return;
     }

// Detect potential reversals with RSI confirmation
   if(DetectReversal(true) && rsiValue < RSI_Buy_Threshold)  // Bullish reversal with RSI confirmation
     {
      DrawArrow("BuyArrow", iTime(NULL, 0, 0), SymbolInfoDouble(_Symbol, SYMBOL_BID), 233, BuyArrowColor);
      Print("Bullish Reversal Detected - RSI:", rsiValue);
     }
   else
      if(DetectReversal(false) && rsiValue > RSI_Sell_Threshold)  // Bearish reversal with RSI confirmation
        {
         DrawArrow("SellArrow", iTime(NULL, 0, 0), SymbolInfoDouble(_Symbol, SYMBOL_ASK), 234, SellArrowColor);
         Print("Bearish Reversal Detected - RSI:", rsiValue);
        }
  }

//+------------------------------------------------------------------+
//| Calculate Heikin-Ashi                                            |
//+------------------------------------------------------------------+
void CalculateHeikinAshi()
  {
   MqlRates rates[];
   int copied = CopyRates(_Symbol, _Period, 0, Bars(_Symbol, _Period), rates);

   if(copied < TrendCandles + 2)
     {
      Print("Failed to copy rates. Copied: ", copied);
      return;
     }

   ArraySetAsSeries(rates, true);

// Resize arrays to match the number of copied bars
   ArrayResize(haClose, copied);
   ArrayResize(haOpen, copied);
   ArrayResize(haHigh, copied);
   ArrayResize(haLow, copied);

// Calculate Heikin-Ashi
   for(int i = copied - 1; i >= 0; i--)
     {
      haClose[i] = (rates[i].open + rates[i].high + rates[i].low + rates[i].close) / 4.0;
      haOpen[i] = (i == copied - 1) ? (rates[i].open + rates[i].close) / 2.0 : (haOpen[i + 1] + haClose[i + 1]) / 2.0;
      haHigh[i] = MathMax(rates[i].high, MathMax(haOpen[i], haClose[i]));
      haLow[i] = MathMin(rates[i].low, MathMin(haOpen[i], haClose[i]));
     }

   Print("Heikin-Ashi Calculation Complete");
  }

//+------------------------------------------------------------------+
//| Detect Reversals with Trend Confirmation                         |
//+------------------------------------------------------------------+
bool DetectReversal(bool isBullish)
  {
   int direction = isBullish ? 1 : -1;

// Confirm trend location: Check for consecutive candles in the same direction
   int consecutive = 0;
   for(int i = 2; i <= TrendCandles + 1; i++)
     {
      if((haClose[i] > haClose[i + 1] && isBullish) || (haClose[i] < haClose[i + 1] && !isBullish))
         consecutive++;
      else
         break;
     }
   if(consecutive < ConsecutiveCandles)
      return false;

// Check for a strong reversal candlestick
   double body = MathAbs(haClose[1] - haOpen[1]);
   double shadow = (direction > 0) ? MathAbs(haLow[1] - haOpen[1]) : MathAbs(haHigh[1] - haOpen[1]);

// Avoid division by zero and confirm shadow-to-body ratio
   if(body == 0.0 || (shadow / body) < ShadowToBodyRatio)
      return false;

// Confirm the reversal with the next candlestick (opposite direction)
   return ((haClose[0] - haOpen[0]) * direction < 0);
  }

//+------------------------------------------------------------------+
//| Get RSI Value                                                    |
//+------------------------------------------------------------------+
bool GetRSIValue(double &rsiValue)
  {
   double rsiBuffer[];
   if(CopyBuffer(rsiHandle, 0, 0, 1, rsiBuffer) > 0)
     {
      rsiValue = rsiBuffer[0];
      return true;
     }
   return false;
  }

//+------------------------------------------------------------------+
//| Draw Arrow                                                       |
//+------------------------------------------------------------------+
void DrawArrow(string name, datetime time, double price, int code, color clr)
  {
   name += "_" + IntegerToString(time);
   if(ObjectFind(0, name) != -1)
      ObjectDelete(0, name);

   if(ObjectCreate(0, name, OBJ_ARROW, 0, time, price))
     {
      ObjectSetInteger(0, name, OBJPROP_ARROWCODE, code);
      ObjectSetInteger(0, name, OBJPROP_COLOR, clr);
      ObjectSetInteger(0, name, OBJPROP_WIDTH, 2);
      Print("Arrow Drawn: ", name, " at ", price);
     }
   else
     {
      Print("Failed to create arrow: ", GetLastError());
     }
  }

//+------------------------------------------------------------------+
//| Expert deinitialization                                          |
//+------------------------------------------------------------------+
void OnDeinit(const int reason)
  {
   if(rsiHandle != INVALID_HANDLE)
      IndicatorRelease(rsiHandle);
  }
//+------------------------------------------------------------------+
Outcomes
In my testing process, I used both backtesting and live market testing to evaluate the EA's performance.- Backtesting
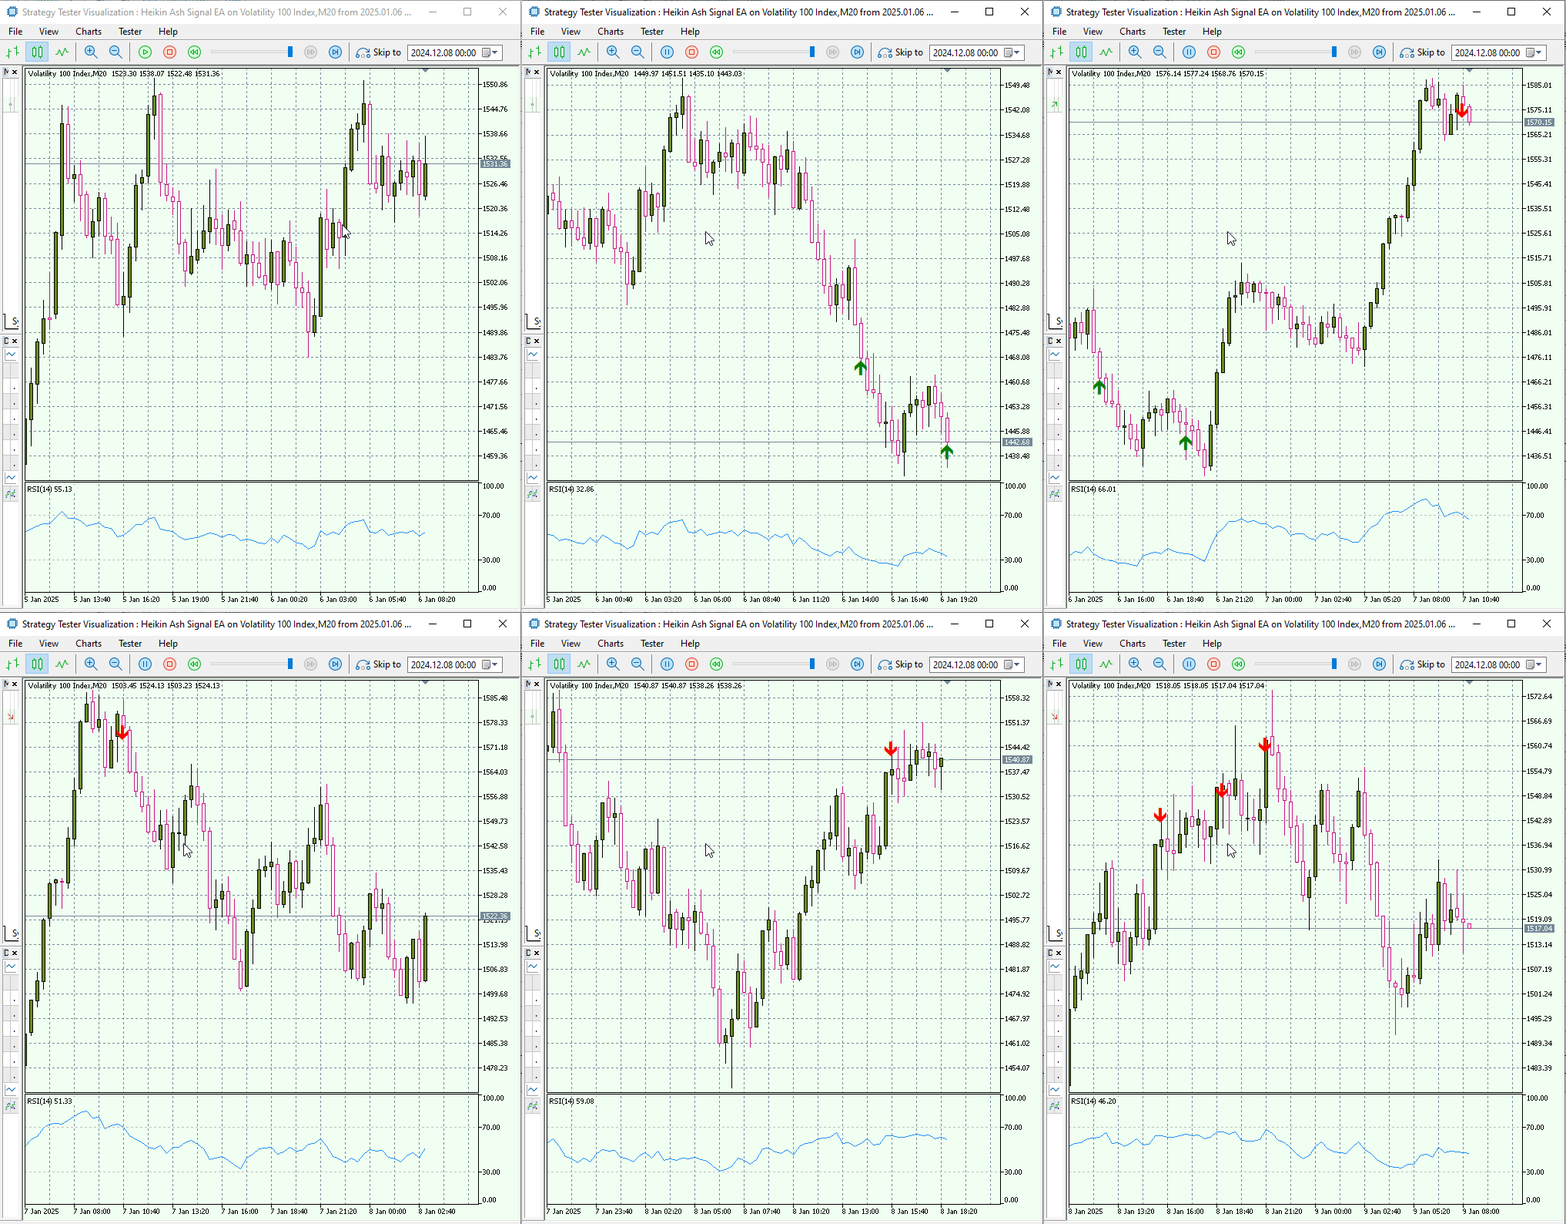
I ran the EA on historical data to verify its basic viability and uncover its strengths and weaknesses. This phase confirms that the approach works under known market conditions, although it can’t fully replicate real-world factors like slippage or variable spreads. Let’s take a look at the GIF below.

Fig 3. V100 Index Backtesting
Below, I have presented additional backtesting results for three different pairs over a period of 27 days to evaluate signal accuracy. A signal was deemed successful if the market changed direction after confirmation.
- EURUSD
| Signal | Total | True | % Accuracy |
|---|---|---|---|
| Buy | 20 | 17 | 85% |
| Sell | 10 | 8 | 80% |
- Crash 900 Index
| Signal | Total | True | % Accuracy |
|---|---|---|---|
| Buy | 18 | 14 | 77.8% |
| Sell | 25 | 15 | 60% |
- Step Index
| Signal | Total | True | % Accuracy |
|---|---|---|---|
| Buy | 18 | 15 | 83.3.% |
| Sell | 22 | 14 | 63.6% |
The EA has proven to be highly effective, achieving a minimum of 77.8% accuracy on buy signals and at least 60% accuracy on sell signals across the tested pairs.
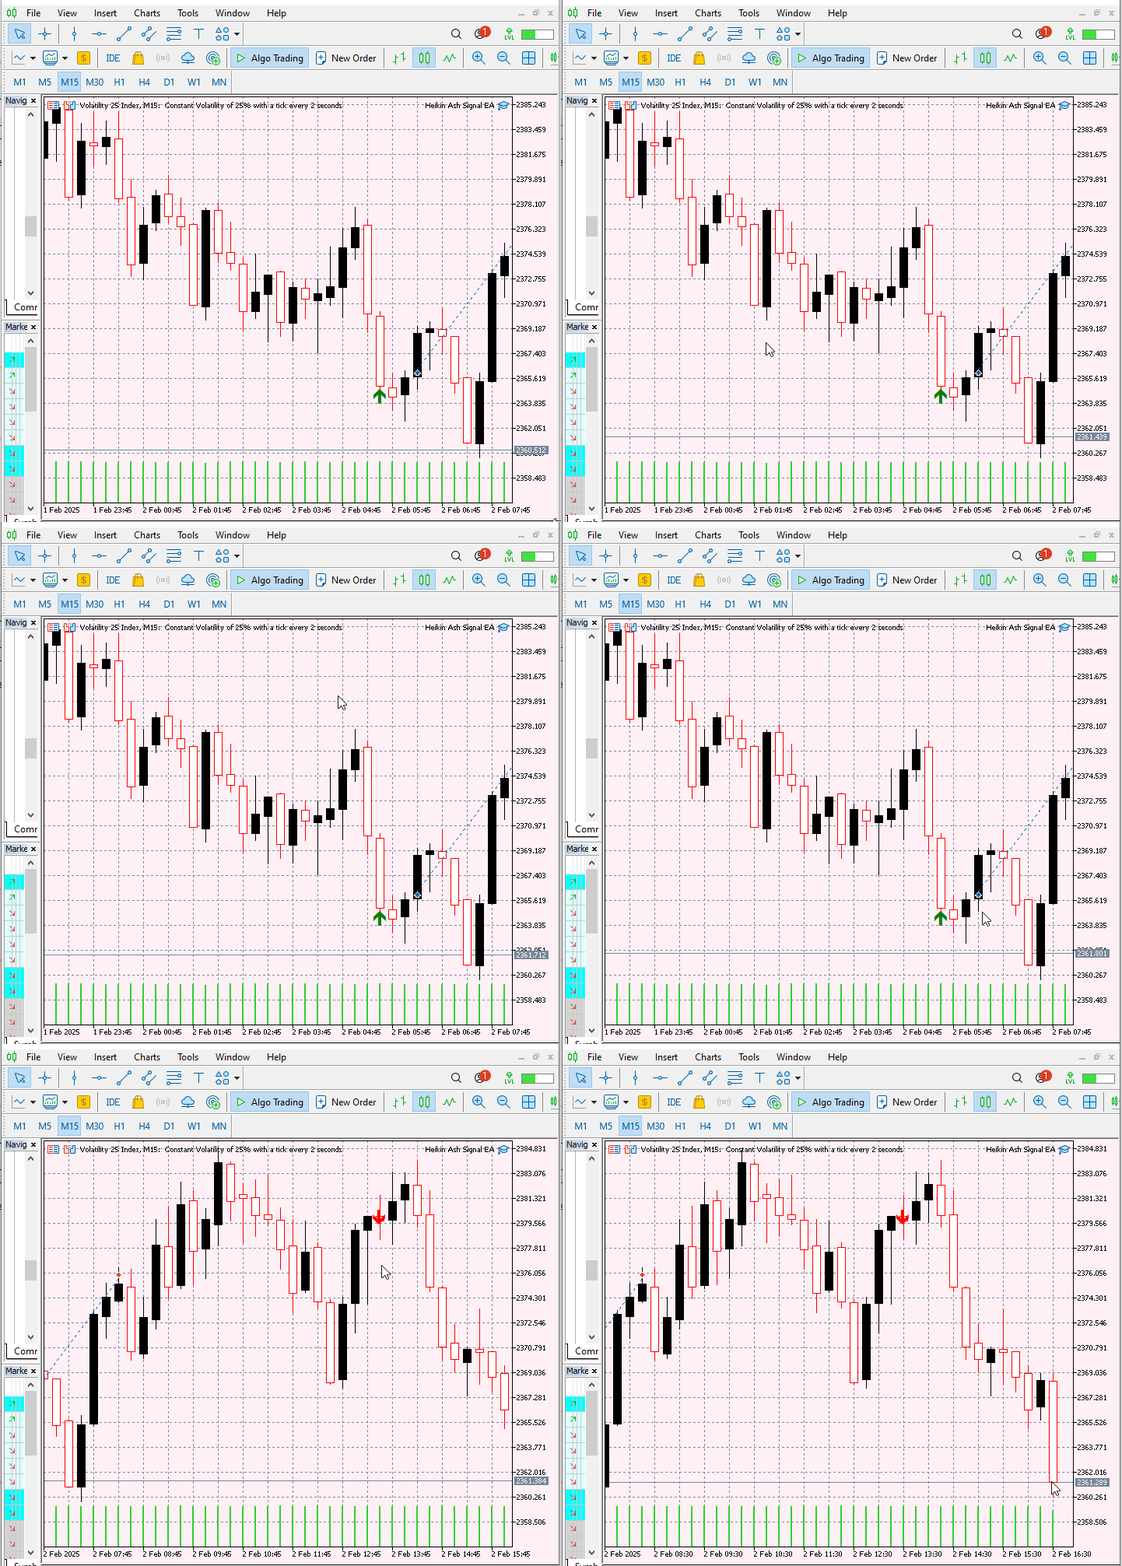
- Live Market Testing

Fig 4. V25 Index Live Market Testing
Key Takeaway
Backtesting validates the strategy in theory, while live testing demonstrates its practical performance. Both stages are crucial for refining the EA and ensuring its robust enough for real-world trading.
Conclusion
The Heikin-Ashi technique is particularly effective at filtering market fluctuations. I've also found it useful for identifying market reversal points. After testing it like any other tool, I discovered that it works more efficiently when used in with other strategies. It's important to experiment with the code inputs and test on a demo account or through backtestinguntil you achieve the best performance according to your preferences. Your suggestions are greatly appreciated.
| Date | Tool Name | Description | Version | Updates | Notes |
|---|---|---|---|---|---|
| 01/10/24 | Chart Projector | Script to overlay the previous day's price action with ghost effect. | 1.0 | Initial Release | First tool in Lynnchris Tool Chest |
| 18/11/24 | Analytical Comment | It provides previous day's information in a tabular format, as well as anticipates the future direction of the market. | 1.0 | Initial Release | Second tool in the Lynnchris Tool Chest |
| 27/11/24 | Analytics Master | Regular Update of market metrics after every two hours | 1.01 | Second Release | Third tool in the Lynnchris Tool Chest |
| 02/12/24 | Analytics Forecaster | Regular Update of market metrics after every two hours with telegram integration | 1.1 | Third Edition | Tool number 4 |
| 09/12/24 | Volatility Navigator | The EA analyzes market conditions using the Bollinger Bands, RSI and ATR indicators | 1.0 | Initial Release | Tool Number 5 |
| 19/12/24 | Mean Reversion Signal Reaper | Analyzes market using mean reversion strategy and provides signal | 1.0 | Initial Release | Tool number 6 |
| 9/01/25 | Signal Pulse | Multiple timeframe analyzer | 1.0 | Initial Release | Tool number 7 |
| 17/01/25 | Metrics Board | Panel with button for analysis | 1.0 | Initial Release | Tool number 8 |
| 21/01/25 | External Flow | Analytics through external libraries | 1.0 | Initial Release | Tool number 9 |
| 27/01/25 | VWAP | Volume Weighted Average Price | 1.3 | Initial Release | Tool number 10 |
| 02/02/25 | Heikin Ashi Signal EA | Trend Smoothening and reversal signal identification | 1.0 | Initial Release | Tool number 11 |
 Developing a Replay System (Part 58): Returning to Work on the Service
 Custom Indicator: Plotting Partial Entry, Exit and Reversal Deals for Netting Accounts
 Feature Engineering With Python And MQL5 (Part III): Angle Of Price (2) Polar Coordinates
 Artificial Bee Hive Algorithm (ABHA): Theory and methods
- Free trading apps
- Over 8,000 signals for copying
- Economic news for exploring financial markets
You agree to website policy and terms of use