
Price Action Analysis Toolkit Development (Part 14): Parabolic Stop and Reverse Tool
Contents
Introduction
Technical indicators are signals generated through the analysis of historical data patterns such as price, volume, and open interest. These heuristic tools enable traders to assess market behavior and forecast future movements based on proven trends and statistical models.
In this article, we focus on developing an Expert Advisor (EA) using MQL5, designed to identify potential market reversals. The EA employs the Parabolic SAR for signal detection, generating trading signals by monitoring technical indicators, evaluating their validity in real time, and identifying optimal exit points when predefined levels are reached.
Our discussion begins with an overview of the underlying strategy and the rationale for employing technical indicators in trading. Following this, we will detail the implementation process in MQL5, comprehensively analyze our testing results, and conclude with insights and recommendations for traders seeking to integrate these techniques into their systems.
Understanding The Strategy
Parabolic SAR
In the Parabolic SAR indicator, the term "parabolic" refers to the shape of the plotted curve. As the trend advances, the indicator's dots accelerate in a curved, parabolic fashion, reflecting the increasing momentum as prices move further away from recent extremes.
On the other hand, "SAR" stands for "Stop and Reverse." This component of the indicator signals potential trend reversals. When the dots flip from one side of the price to the other, it suggests that the current trend may be ending, prompting traders to consider stopping their current position and preparing for a possible reversal in market direction.
Before diving deeper into our concept, it is essential to add the Parabolic SAR to your chart for easy reference. There are two methods to do this, but I will explain one approach. In your MetaTrader 5 application, click on the Insert menu, then navigate to Indicators and select Trend. Locate and insert the Parabolic SAR. Once added, configure the parameters to your preference, ensuring they align with those used in your Expert Advisor (EA).
For further details on how to add the indicator, please refer to Figure 1 below.
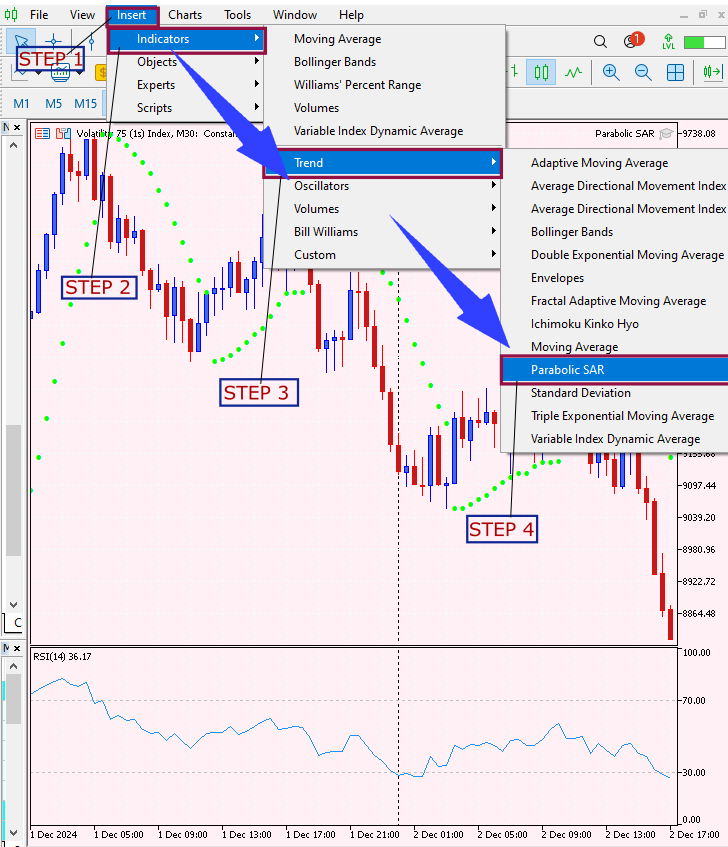
Fig 1. Adding The Indicator
Signal Generation Logic
Working with the Parabolic SAR indicator involves closely monitoring the interaction between the SAR parabola and the price action. In this strategy, signals are generated based on the following logic:
Buy Signal
A buy signal is triggered when:
- The current bar is bullish (its close is higher than its open) and its PSAR value is below the close.
- The previous two bars confirm a bearish trend by having their PSAR dots above their close prices.
- The gap between the PSAR values of the previous bars is within an acceptable range, ensuring consistency.
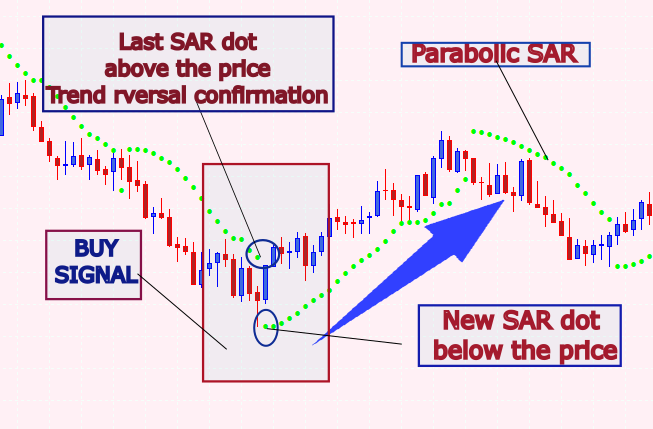
Fig 2. Buy Conditions
Sell Signal
A sell signal is triggered when:
- The current bar is bearish (its close is lower than its open) and its PSAR value is above the close.
- The previous two bars confirm a bullish trend by having their PSAR dots below their close prices.
- Similarly, the gap between the PSAR values of the previous bars must be within a predefined threshold.
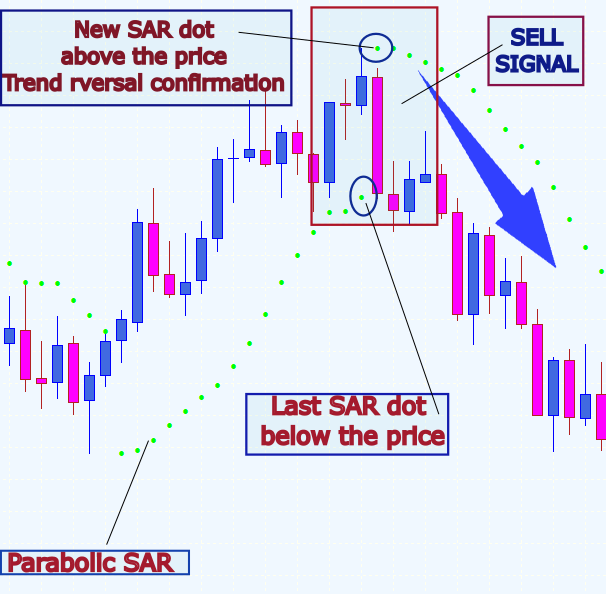
Fig 3. Sell Conditions
Implementation Into MQL5
File Header and Properties
At the very top of the code, we start with a header that includes essential file information such as the file name, copyright details, and a link to the author's webpage, in this case, I have provided mine. This is immediately followed by several #property directives, which set up critical compilation properties, like the version number and strict mode.
//+--------------------------------------------------------------------+
//|                                              Parabolic SAR EA.mql5 |
//|                                 Copyright 2025, Christian Benjamin |
//|                                               https://www.mql5.com |
//+--------------------------------------------------------------------+
#property copyright "2025, Christian Benjamin"
#property link      "https://www.mql5.com/en/users/lynnchris"
#property version   "1.0"
#property strict
The use of #property strict is fundamental, it enforces rigorous type checking and parameter validation within the EA. This precaution helps identify potential coding mistakes before they escalate into runtime errors. Whether you’re planning to publish the EA or use it in a live trading environment, this setting acts as a safeguard, ensuring smooth operation and future compliance with MetaTrader 5 updates. Think of it as an essential quality control measure for your code.
Input Parameters
Next, the code defines a series of input parameters that you can customize directly from the MetaTrader 5 interface. These inputs include parameters for the Parabolic SAR indicator, such as SARStep and SARMaximum, which control the acceleration factor and the maximum acceleration, respectively. There are also settings to refine the signal detection, like MinConsecutiveDots and MaxDotGapPercentage, which help ensure that only strong trends trigger signals. You can also enable alerts, sound notifications, and arrow drawings on the chart.
// Input parameters for the Parabolic SAR indicator
input double SARStep    = 0.02;  // Acceleration factor for PSAR
input double SARMaximum = 0.2;   // Maximum acceleration for PSAR

// Input parameters for refining the signal based on PSAR dots
input int    MinConsecutiveDots = 2;          // Require at least 2 consecutive bars in one trend before reversal
input double MaxDotGapPercentage  = 1.0;      // Maximum allowed gap between consecutive PSAR dots (% of current close)

// Input parameters for alerts and arrow drawing
input bool   EnableAlerts  = true;            // Enable popup alerts
input bool   EnableSound   = true;            // Enable sound alerts
input bool   EnableArrows  = true;            // Draw arrows on chart
input string BuyArrowSymbol  = "233";         // Wingdings up arrow (as string)
input string SellArrowSymbol = "234";         // Wingdings down arrow (as string)
input int    ArrowWidth    = 2;               // Arrow thickness
input double ArrowOffsetMultiplier = 5;       // Multiplier for arrow placement offset
These inputs let you customize the EA to suit different market conditions and your trading preferences. One important aspect here is the versatility of arrow symbols in MetaTrader 5. These symbols, sourced from the Wingdings font, are easily customizable. For instance, you might choose a checkmark for buy signals or an “X” for sell signals, depending on your trading style. Adjusting parameters such as arrow width further enhances signal visibility, allowing you to fine-tune the chart’s visuals for clarity and immediate recognition.
Global Variables and Enumerations
To manage the internal state of the EA, several global variables and an enumeration are declared. For instance, we store the indicator handle for the Parabolic SAR in the sarHandle variable, which allows us to reference the indicator throughout our code. We also keep track of the time of the last processed bar with lastBarTime so that the EA processes each bar only once. The enumeration SignalType defines the possible signal states: no signal, a buy signal, or a sell signal.
// Global indicator handle for PSAR
int sarHandle = INVALID_HANDLE;

// Global variable to track last processed bar time
datetime lastBarTime = 0;

// Enumeration for signal types
enum SignalType
  {
   NO_SIGNAL,
   BUY_SIGNAL,
   SELL_SIGNAL
  };

// Global variables for pending signal mechanism
SignalType pendingSignal = NO_SIGNAL;
int        waitCount     = 0;          // Counts new closed bars since signal detection
double     pendingReversalLevel = 0.0; // Stores the PSAR value at signal detection
In addition, variables like pendingSignal, waitCount, and pendingReversalLevel are used to manage pending signals that are waiting for further confirmation over a few bars before a final action is taken. A critical variable is pendingReversalLevel, which captures the PSAR value presently a signal is generated. Serving as a reference point, this level helps the EA monitor subsequent price movements to determine if a reversal is genuine or just a false alarm. This checkpoint mechanism is vital for reducing unnecessary trades and refining the overall accuracy of the EA.
Drawing Arrows on the Chart
For a more intuitive visual representation, the EA includes a function named DrawSignalArrow. This function is responsible for drawing an arrow on the chart when a signal is detected. It works by generating a unique object name based on the bar time, checking for any existing object with that name, and deleting it to avoid duplication.
void DrawSignalArrow(string prefix, datetime barTime, double price, color arrowColor, long arrowCode)
  {
   string arrowName = prefix + "_" + TimeToString(barTime, TIME_SECONDS);
   // Remove existing object with the same name to prevent duplicates
   if(ObjectFind(0, arrowName) != -1)
      ObjectDelete(0, arrowName);

   if(ObjectCreate(0, arrowName, OBJ_ARROW, 0, barTime, price))
     {
      ObjectSetInteger(0, arrowName, OBJPROP_COLOR, arrowColor);
      ObjectSetInteger(0, arrowName, OBJPROP_ARROWCODE, arrowCode);
      ObjectSetInteger(0, arrowName, OBJPROP_WIDTH, ArrowWidth);
     }
   else
     {
      Print("Failed to create arrow object: ", arrowName);
     }
  }
The EA employs the OBJ_ARROW object to visually represent signals on the chart. To avoid clutter from duplicate markers, the code first checks and removes any existing arrows before drawing a new one. This approach maintains a clean and legible chart, crucial for real-time trading decisions. You can also customize various aspects such as the arrow symbol, color, and offset to match your personal preference for visual cues.
Signal Detection Function
The heart of the EA lies in the CheckForSignal function. Here, the code examines the most recent three bars of price and PSAR data. For a buy signal to be recognized, the function checks that the current bar is bullish (meaning its closing price is higher than its opening price) and that the PSAR dot is below the candle, while the two previous bars are bearish with their PSAR dots above the candles. The reverse logic applies for a sell signal.
SignalType CheckForSignal(const double &sarArray[], const double &openArray[], const double &closeArray[])
  {
   // Mapping indices:
   // Index 0: Last closed bar (current candidate)
   // Index 1: Previous bar
   // Index 2: Bar before previous

   double sar0 = sarArray[0], sar1 = sarArray[1], sar2 = sarArray[2];
   double open0 = openArray[0], close0 = closeArray[0];
   double open1 = openArray[1], close1 = closeArray[1];
   double open2 = openArray[2], close2 = closeArray[2];

   // Check for BUY signal:
   if((close0 > open0) && (sar0 < close0) &&
      (sar1 > close1) && (sar2 > close2))
     {
      int countBearish = 0;
      if(sar1 > close1) countBearish++;
      if(sar2 > close2) countBearish++;
      double dotGap = MathAbs(sar1 - sar2);
      double gapThreshold = (MaxDotGapPercentage / 100.0) * close0;
      if(countBearish >= MinConsecutiveDots && dotGap <= gapThreshold)
         return BUY_SIGNAL;
     }

   // Check for SELL signal:
   if((close0 < open0) && (sar0 > close0) &&
      (sar1 < close1) && (sar2 < close2))
     {
      int countBullish = 0;
      if(sar1 < close1) countBullish++;
      if(sar2 < close2) countBullish++;
      double dotGap = MathAbs(sar1 - sar2);
      double gapThreshold = (MaxDotGapPercentage / 100.0) * close0;
      if(countBullish >= MinConsecutiveDots && dotGap <= gapThreshold)
         return SELL_SIGNAL;
     }

   return NO_SIGNAL;
  }
The function also uses a gap threshold to ensure the spacing between consecutive PSAR dots stays within acceptable limits. If the conditions are met, it returns the appropriate signal type (buy or sell); otherwise, it returns no signal. The signal detection function effectively identifies reversals using PSAR positioning and candlestick patterns. However, its design allows for further enhancement by incorporating extra filters like moving averages, RSI, or even volatility index. Adding these layers can help eliminate false signals during sideways markets or during periods influenced by major news events. Essentially, the EA is built to be adaptable, giving you the freedom to tailor its logic to your unique trading strategy and market conditions.
New Bar Detection
Before processing any data, the EA needs to determine whether a new bar has closed. The IsNewBar function handles this by retrieving the time of the most recent closed bar and comparing it to the stored lastBarTime. If the times differ, it means a new bar has been formed, so the function updates lastBarTime and returns true.
bool IsNewBar()
  {
   datetime times[];
   if(CopyTime(_Symbol, _Period, 1, 1, times) <= 0)
     {
      Print("Failed to retrieve bar time in IsNewBar().");
      return false;
     }
   if(times[0] != lastBarTime)
     {
      lastBarTime = times[0];
      return true;
     }
   return false;
  }
This check is crucial because it ensures that the EA processes the data only once per new bar, thus preventing repetitive or erroneous signal processing. The IsNewBar function is a smart efficiency booster for the EA. By ensuring that signals are processed only once per new bar, it prevents redundant calculations and repeated alerts. This simple check keeps the EA running efficiently and reduces the risk of misinterpreting price movements within a single bar. Overall, it helps maintain consistent and predictable performance on the MetaTrader platform.
Initialization and Deinitialization
When the EA is loaded, the OnInit function runs first. Its primary task is to create a handle for the built-in Parabolic SAR indicator using the parameters provided by the user. If the indicator is successfully initialized, a confirmation message is printed; if not, an error message is generated and the initialization fails. Conversely, the OnDeinit function is called when the EA is removed from the chart or when the terminal is closed.
int OnInit()
  {
   // Create the built-in Parabolic SAR indicator handle
   sarHandle = iSAR(_Symbol, _Period, SARStep, SARMaximum);
   if(sarHandle == INVALID_HANDLE)
     {
      Print("Error creating PSAR handle");
      return INIT_FAILED;
     }
   Print("SAR EA initialized successfully.");
   return INIT_SUCCEEDED;
  }
This function takes care of releasing the indicator handle and cleaning up any graphical objects (like arrows) that were created during the EA's operation, ensuring that no unnecessary clutter is left behind. A well-designed EA pays attention to cleanup during deinitialization. Removing any arrows or other visual elements created during operation prevents the chart from becoming cluttered with obsolete markers. This cleanup process is akin to good housekeeping, it ensures that every time you launch the EA, you’re working with a fresh, uncluttered chart and optimal system performance.
Main Logic (OnTick Function)
Finally, the OnTick function is the main engine that runs on every tick. It first checks if a new bar has just closed using the IsNewBar function. If no new bar is detected, the function exits early to avoid redundant processing. Once a new bar is confirmed, the EA retrieves the latest PSAR values along with the corresponding open and close prices for the recent bars. At this point, the EA evaluates whether there is a pending signal waiting for confirmation. If a signal is pending, a counter (waitCount) is incremented to track how many bars have passed.
void OnTick()
  {
   // Process only once per new closed bar
   if(!IsNewBar())
      return;

   // Retrieve PSAR and price data
   double sarArray[4];
   if(CopyBuffer(sarHandle, 0, 1, 4, sarArray) < 3) { /* error handling */ }
   double openArray[4], closeArray[4];
   if(CopyOpen(_Symbol, _Period, 1, 4, openArray) < 3 ||
      CopyClose(_Symbol, _Period, 1, 4, closeArray) < 3) { /* error handling */ }

   // Pending Signal Logic...
   if(pendingSignal != NO_SIGNAL)
     {
      waitCount++; // Increment waiting counter

      if(pendingSignal == BUY_SIGNAL)
        {
         if(closeArray[0] <= pendingReversalLevel)
           {
            // Confirm reversal: Close alert for BUY signal
           }
         else if(waitCount >= 3)
           {
            // Warn about a possible fake BUY signal
           }
        }
      else if(pendingSignal == SELL_SIGNAL)
        {
         if(closeArray[0] >= pendingReversalLevel)
           {
            // Confirm reversal: Close alert for SELL signal
           }
         else if(waitCount >= 3)
           {
            // Warn about a possible fake SELL signal
           }
        }
      return; // Wait until pending signal is resolved
     }

   // Check for a new reversal signal if no pending signal exists
   SignalType newSignal = CheckForSignal(sarArray, openArray, closeArray);
   if(newSignal != NO_SIGNAL)
     {
      pendingSignal = newSignal;
      waitCount = 0; // Reset counter
      pendingReversalLevel = sarArray[0]; // Store current PSAR value

      // Alert and optionally draw an arrow based on the new signal
      if(newSignal == BUY_SIGNAL) { /* process BUY signal */ }
      else if(newSignal == SELL_SIGNAL) { /* process SELL signal */ }
     }
  }
The EA then checks if the current price has reached the stored reversal level: if it has, an alert is issued to “close here” for the signal; if three bars pass without confirmation, the EA warns of a potential fake signal. If no pending signal is active, the EA calls the CheckForSignal function to see if a new signal has emerged. If so, it stores the signal, resets the waiting counter, sets the pending reversal level based on the current PSAR value, and triggers the appropriate alerts and visual markers. An innovative feature within the OnTickfunction is its method for filtering out potential false signals.
By using a counter (waitCount) to monitor how many bars pass after a signal is generated, the EA allows time for confirmation before taking action. This delay is particularly useful in volatile markets, where rapid price swings might otherwise trigger premature signals. Adjusting the number of confirmation bars lets you balance between responsiveness and caution, making the EA flexible enough to support both short-term scalping and long-term trend strategies.
Full MQL5 EA Code
//+--------------------------------------------------------------------+
//|                                              Parabolic SAR EA.mql5 |
//|                                 Copyright 2025, Christian Benjamin |
//|                                               https://www.mql5.com |
//+--------------------------------------------------------------------+

#property copyright "2025, Christian Benjamin"
#property link      "https://www.mql5.com/en/users/lynnchris"
#property version   "1.2"
#property strict

// Input parameters for the Parabolic SAR indicator
input double SARStep    = 0.1;  // Acceleration factor for PSAR
input double SARMaximum = 1;   // Maximum acceleration for PSAR

// Input parameters for refining the signal based on PSAR dots
input int    MinConsecutiveDots = 2;         // Require at least 2 consecutive bars in one trend before reversal
input double MaxDotGapPercentage  = 1.0;     // Maximum allowed gap between consecutive PSAR dots (% of current close)

// Input parameters for alerts and arrow drawing
input bool   EnableAlerts  = true;            // Enable popup alerts
input bool   EnableSound   = true;            // Enable sound alerts
input bool   EnableArrows  = true;            // Draw arrows on chart
input string BuyArrowSymbol  = "233";         // Wingdings up arrow (as string)
input string SellArrowSymbol = "234";         // Wingdings down arrow (as string)
input int    ArrowWidth    = 2;               // Arrow thickness
input double ArrowOffsetMultiplier = 5;       // Multiplier for arrow placement offset

// Global indicator handle for PSAR
int sarHandle = INVALID_HANDLE;

// Global variable to track last processed bar time
datetime lastBarTime = 0;

// Enumeration for signal types
enum SignalType
  {
   NO_SIGNAL,
   BUY_SIGNAL,
   SELL_SIGNAL
  };

// Global variables for pending signal mechanism
SignalType pendingSignal = NO_SIGNAL;
int        waitCount     = 0;        // Counts new closed bars since signal detection
double     pendingReversalLevel = 0.0; // Stores the PSAR value at signal detection

//+------------------------------------------------------------------+
//| DrawSignalArrow - Draws an arrow object on the chart             |
//+------------------------------------------------------------------+
void DrawSignalArrow(string prefix, datetime barTime, double price, color arrowColor, long arrowCode)
  {
   string arrowName = prefix + "_" + TimeToString(barTime, TIME_SECONDS);
// Remove existing object with the same name to prevent duplicates
   if(ObjectFind(0, arrowName) != -1)
      ObjectDelete(0, arrowName);

   if(ObjectCreate(0, arrowName, OBJ_ARROW, 0, barTime, price))
     {
      ObjectSetInteger(0, arrowName, OBJPROP_COLOR, arrowColor);
      ObjectSetInteger(0, arrowName, OBJPROP_ARROWCODE, arrowCode);
      ObjectSetInteger(0, arrowName, OBJPROP_WIDTH, ArrowWidth);
     }
   else
     {
      Print("Failed to create arrow object: ", arrowName);
     }
  }

//+-------------------------------------------------------------------+
//| CheckForSignal - Evaluates PSAR and price data to determine signal|
//+-------------------------------------------------------------------+
SignalType CheckForSignal(const double &sarArray[], const double &openArray[], const double &closeArray[])
  {
// Mapping indices:
// Index 0: Last closed bar (current candidate)
// Index 1: Previous bar
// Index 2: Bar before previous

   double sar0 = sarArray[0], sar1 = sarArray[1], sar2 = sarArray[2];
   double open0 = openArray[0], close0 = closeArray[0];
   double open1 = openArray[1], close1 = closeArray[1];
   double open2 = openArray[2], close2 = closeArray[2];

// Check for BUY signal:
   if((close0 > open0) && (sar0 < close0) &&
      (sar1 > close1) && (sar2 > close2))
     {
      int countBearish = 0;
      if(sar1 > close1)
         countBearish++;
      if(sar2 > close2)
         countBearish++;
      double dotGap = MathAbs(sar1 - sar2);
      double gapThreshold = (MaxDotGapPercentage / 100.0) * close0;
      if(countBearish >= MinConsecutiveDots && dotGap <= gapThreshold)
         return BUY_SIGNAL;
     }

// Check for SELL signal:
   if((close0 < open0) && (sar0 > close0) &&
      (sar1 < close1) && (sar2 < close2))
     {
      int countBullish = 0;
      if(sar1 < close1)
         countBullish++;
      if(sar2 < close2)
         countBullish++;
      double dotGap = MathAbs(sar1 - sar2);
      double gapThreshold = (MaxDotGapPercentage / 100.0) * close0;
      if(countBullish >= MinConsecutiveDots && dotGap <= gapThreshold)
         return SELL_SIGNAL;
     }

   return NO_SIGNAL;
  }

//+------------------------------------------------------------------+
//| IsNewBar - Determines if a new closed bar is available           |
//+------------------------------------------------------------------+
bool IsNewBar()
  {
   datetime times[];
   if(CopyTime(_Symbol, _Period, 1, 1, times) <= 0)
     {
      Print("Failed to retrieve bar time in IsNewBar().");
      return false;
     }
   if(times[0] != lastBarTime)
     {
      lastBarTime = times[0];
      return true;
     }
   return false;
  }

//+------------------------------------------------------------------+
//| Expert initialization function                                   |
//+------------------------------------------------------------------+
int OnInit()
  {
// Create the built-in Parabolic SAR indicator handle
   sarHandle = iSAR(_Symbol, _Period, SARStep, SARMaximum);
   if(sarHandle == INVALID_HANDLE)
     {
      Print("Error creating PSAR handle");
      return INIT_FAILED;
     }
   Print("SAR EA initialized successfully.");
   return INIT_SUCCEEDED;
  }

//+------------------------------------------------------------------+
//| Expert deinitialization function                                 |
//+------------------------------------------------------------------+
void OnDeinit(const int reason)
  {
   if(sarHandle != INVALID_HANDLE)
      IndicatorRelease(sarHandle);

// Remove all arrow objects from the current chart window
   ObjectsDeleteAll(0, (int)OBJ_ARROW, 0);
  }

//+------------------------------------------------------------------+
//| Expert tick function                                             |
//+------------------------------------------------------------------+
void OnTick()
  {
// Process only once per new closed bar
   if(!IsNewBar())
      return;

// Retrieve the last 4 PSAR values (we require at least 3 values)
   double sarArray[4];
   if(CopyBuffer(sarHandle, 0, 1, 4, sarArray) < 3)
     {
      Print("Failed to retrieve PSAR data.");
      return;
     }

// Retrieve the last 4 bars' price data (Open and Close)
   double openArray[4], closeArray[4];
   if(CopyOpen(_Symbol, _Period, 1, 4, openArray) < 3 ||
      CopyClose(_Symbol, _Period, 1, 4, closeArray) < 3)
     {
      Print("Failed to retrieve price data.");
      return;
     }

// Process pending signal logic if a signal is waiting confirmation
   if(pendingSignal != NO_SIGNAL)
     {
      waitCount++; // Increment the waiting counter

      if(pendingSignal == BUY_SIGNAL)
        {
         if(closeArray[0] <= pendingReversalLevel)
           {
            Print("Reversal level reached for BUY signal. Close here.");
            if(EnableAlerts)
               Alert("Close here for BUY signal on ", _Symbol, " at price ", DoubleToString(closeArray[0], _Digits));
            if(EnableSound)
               PlaySound("alert.wav");
            pendingSignal = NO_SIGNAL;
            waitCount = 0;
           }
         else
            if(waitCount >= 3)
              {
               Print("Warning: Possible fake BUY signal - reversal not confirmed in 3 candles.");
               if(EnableAlerts)
                  Alert("Warning: Possible fake BUY signal on ", _Symbol);
               pendingSignal = NO_SIGNAL;
               waitCount = 0;
              }
        }
      else
         if(pendingSignal == SELL_SIGNAL)
           {
            if(closeArray[0] >= pendingReversalLevel)
              {
               Print("Reversal level reached for SELL signal. Close here.");
               if(EnableAlerts)
                  Alert("Close here for SELL signal on ", _Symbol, " at price ", DoubleToString(closeArray[0], _Digits));
               if(EnableSound)
                  PlaySound("alert.wav");
               pendingSignal = NO_SIGNAL;
               waitCount = 0;
              }
            else
               if(waitCount >= 3)
                 {
                  Print("Warning: Possible fake SELL signal - reversal not confirmed in 3 candles.");
                  if(EnableAlerts)
                     Alert("Warning: Possible fake SELL signal on ", _Symbol);
                  pendingSignal = NO_SIGNAL;
                  waitCount = 0;
                 }
           }
      return;
     }

// Check for a new reversal signal
   SignalType newSignal = CheckForSignal(sarArray, openArray, closeArray);
   if(newSignal != NO_SIGNAL)
     {
      pendingSignal = newSignal;
      waitCount = 0; // Reset waiting counter
      pendingReversalLevel = sarArray[0]; // Set reversal level from current PSAR value

      if(newSignal == BUY_SIGNAL)
        {
         Print("Buy signal detected on ", TimeToString(lastBarTime, TIME_DATE|TIME_SECONDS),
               ". Waiting for reversal confirmation (up to 3 candles).");
         if(EnableAlerts)
            Alert("Buy signal detected on ", _Symbol, " at price ", DoubleToString(closeArray[0], _Digits));
         if(EnableArrows)
           {
            double lowVal[];
            if(CopyLow(_Symbol, _Period, 1, 1, lowVal) > 0)
              {
               double offset = _Point * ArrowOffsetMultiplier;
               DrawSignalArrow("BuyArrow", lastBarTime, lowVal[0] - offset, clrGreen, StringToInteger(BuyArrowSymbol));
              }
            else
               Print("Failed to retrieve low price for arrow placement.");
           }
        }
      else
         if(newSignal == SELL_SIGNAL)
           {
            Print("Sell signal detected on ", TimeToString(lastBarTime, TIME_DATE|TIME_SECONDS),
                  ". Waiting for reversal confirmation (up to 3 candles).");
            if(EnableAlerts)
               Alert("Sell signal detected on ", _Symbol, " at price ", DoubleToString(closeArray[0], _Digits));
            if(EnableArrows)
              {
               double highVal[];
               if(CopyHigh(_Symbol, _Period, 1, 1, highVal) > 0)
                 {
                  double offset = _Point * ArrowOffsetMultiplier;
                  DrawSignalArrow("SellArrow", lastBarTime, highVal[0] + offset, clrRed, StringToInteger(SellArrowSymbol));
                 }
               else
                  Print("Failed to retrieve high price for arrow placement.");
              }
           }
     }
  }
//+------------------------------------------------------------------+
Testing And Outcomes
Before moving to live trading, I recommend backtesting on a demo account. Here’s how you can fine-tune your EA based on your test results:- Once you have successfully compiled your EA in MetaEditor, open MetaTrader.
- In MetaTrader, navigate to the Strategy Tester. Select the EA you wish to test, then choose the desired timeframe, testing period, and any other relevant parameters.
- After configuring your settings, click ‘Start’ to begin the backtest.
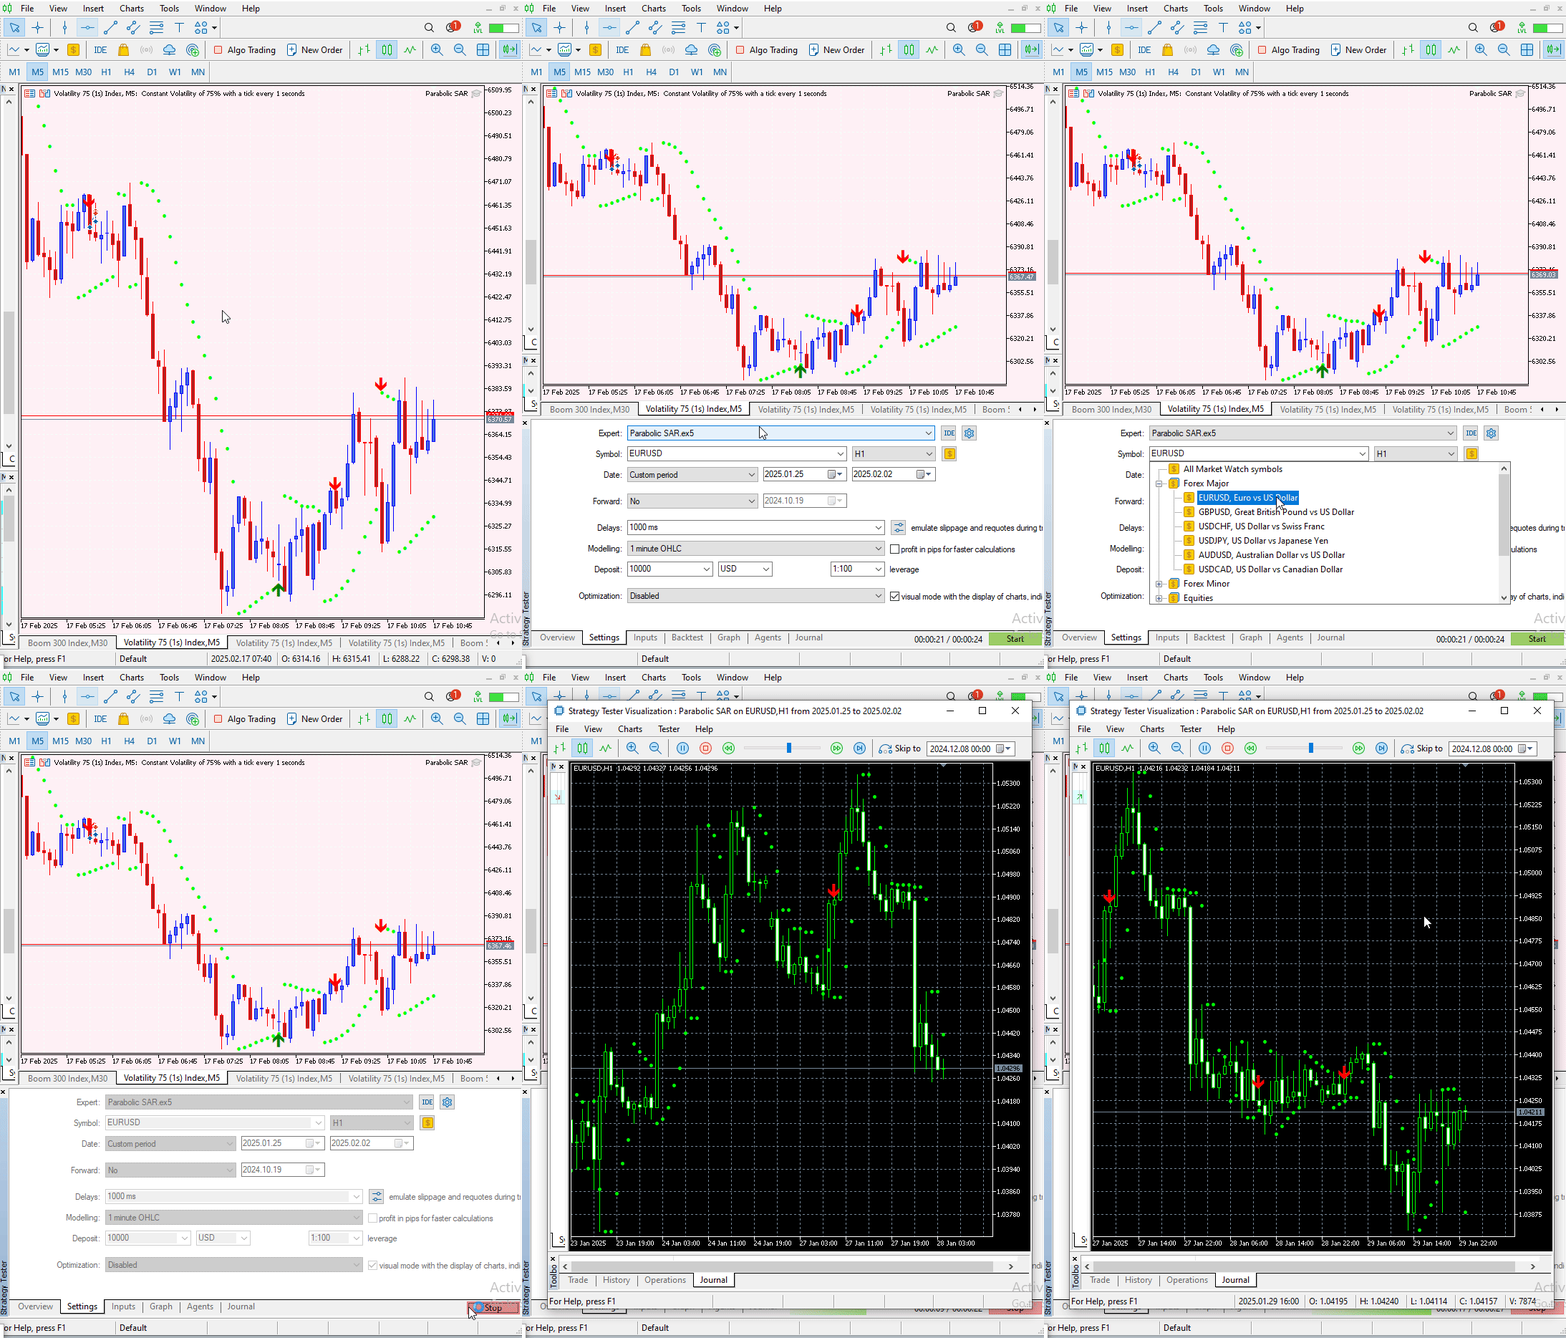
Fig 4. Initializing Tester
Below, I’ve provided images and multiple GIFs captured during my backtesting sessions. The first image is a diagram for the Volatility 25 index, highlighting where both sell and buy signals were confirmed during the test. This is followed by several GIFs for additional visualization, which may help you better understand the EA’s performance.
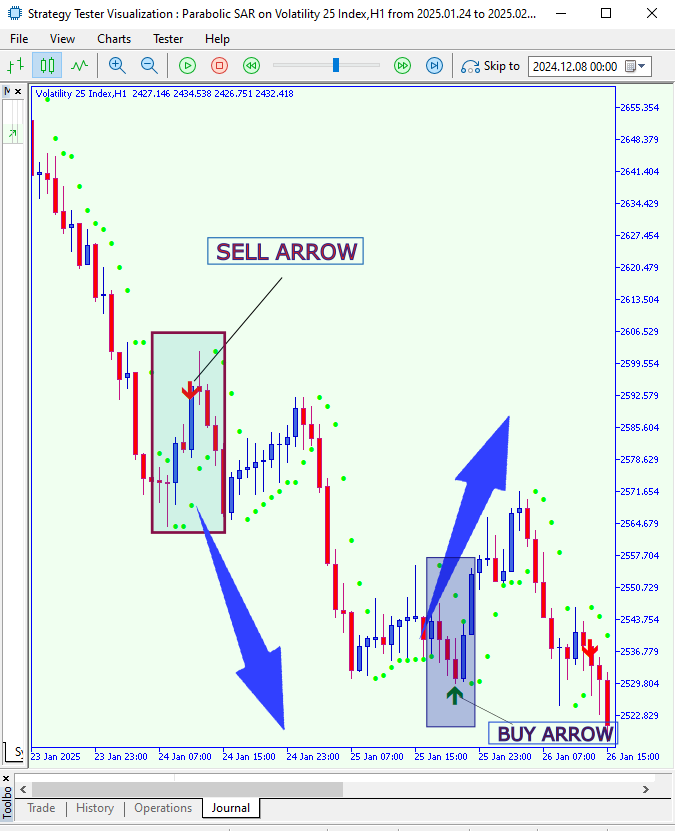
Fig 5. Backtesting On Volatility 25 Index
Backtescting on Volatility 25 Index GIF.
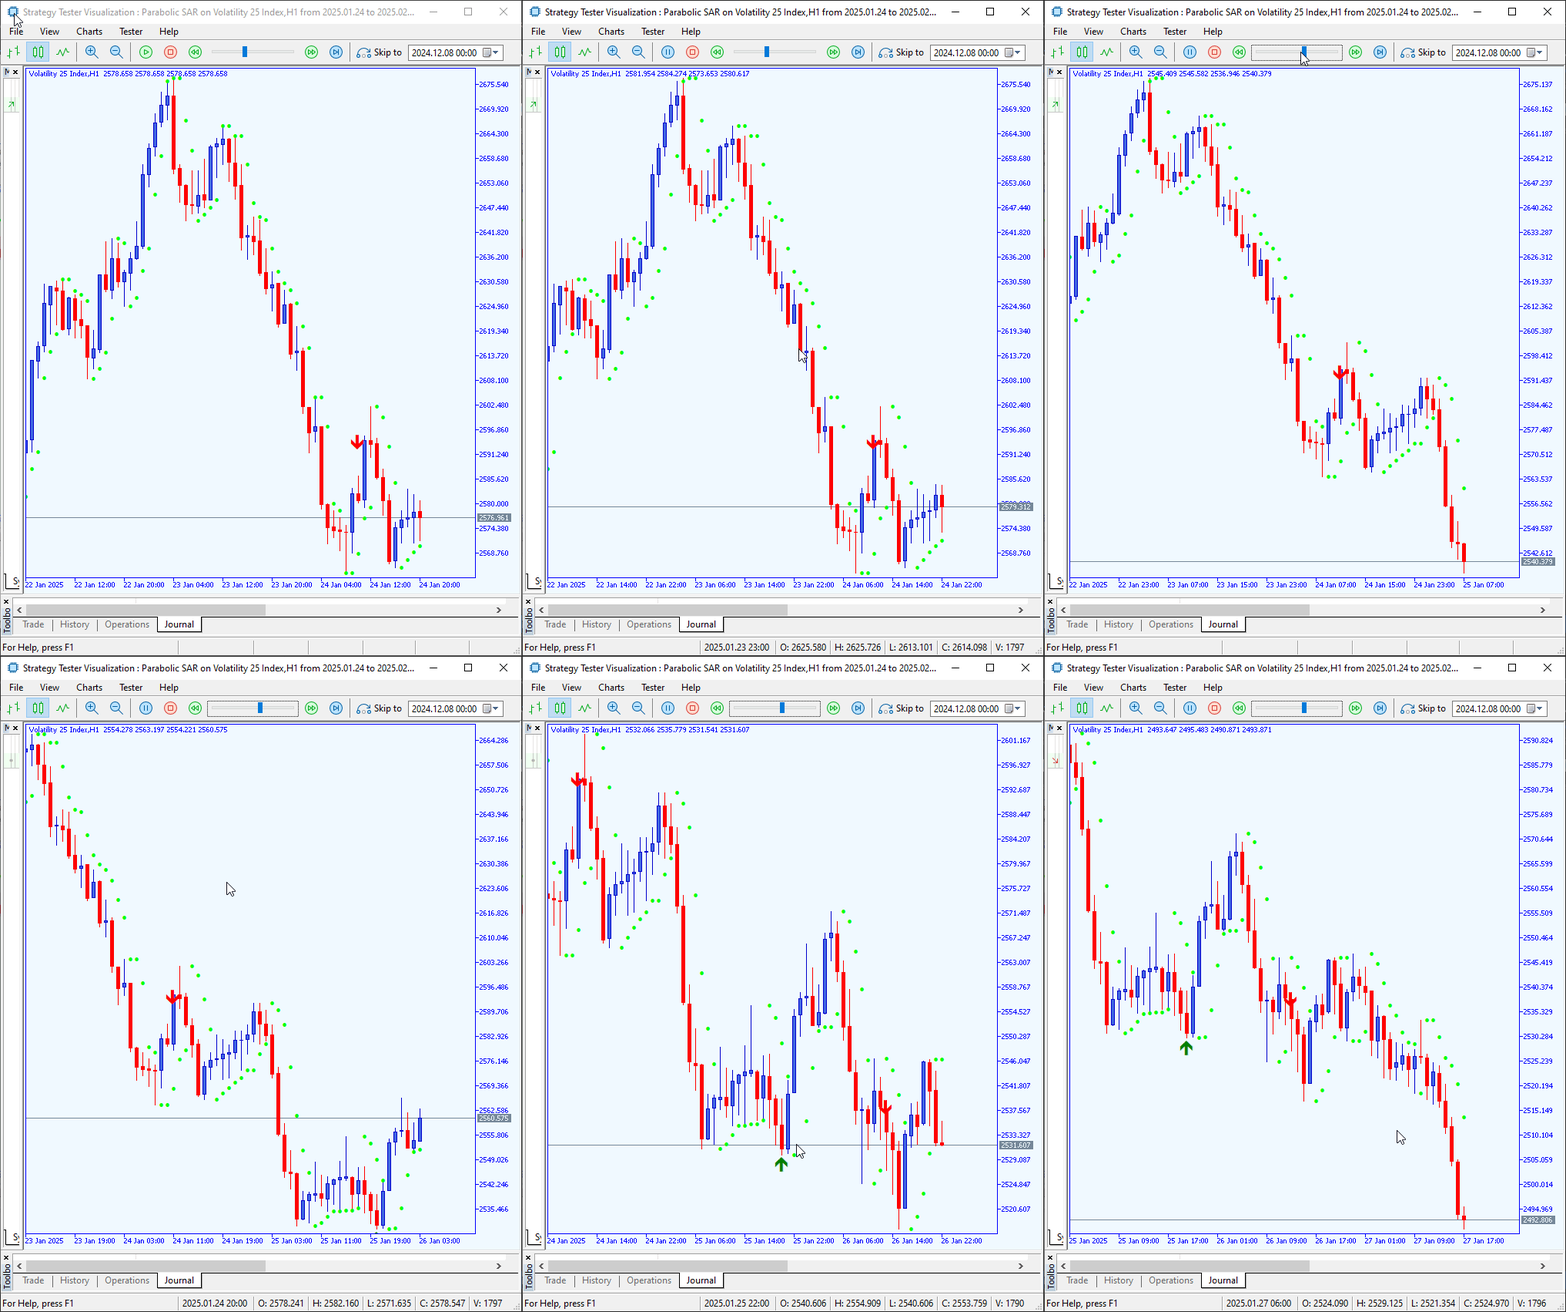
Fig 6: Backtesting On Volatility 25 Index
Backtesting on Step Index.
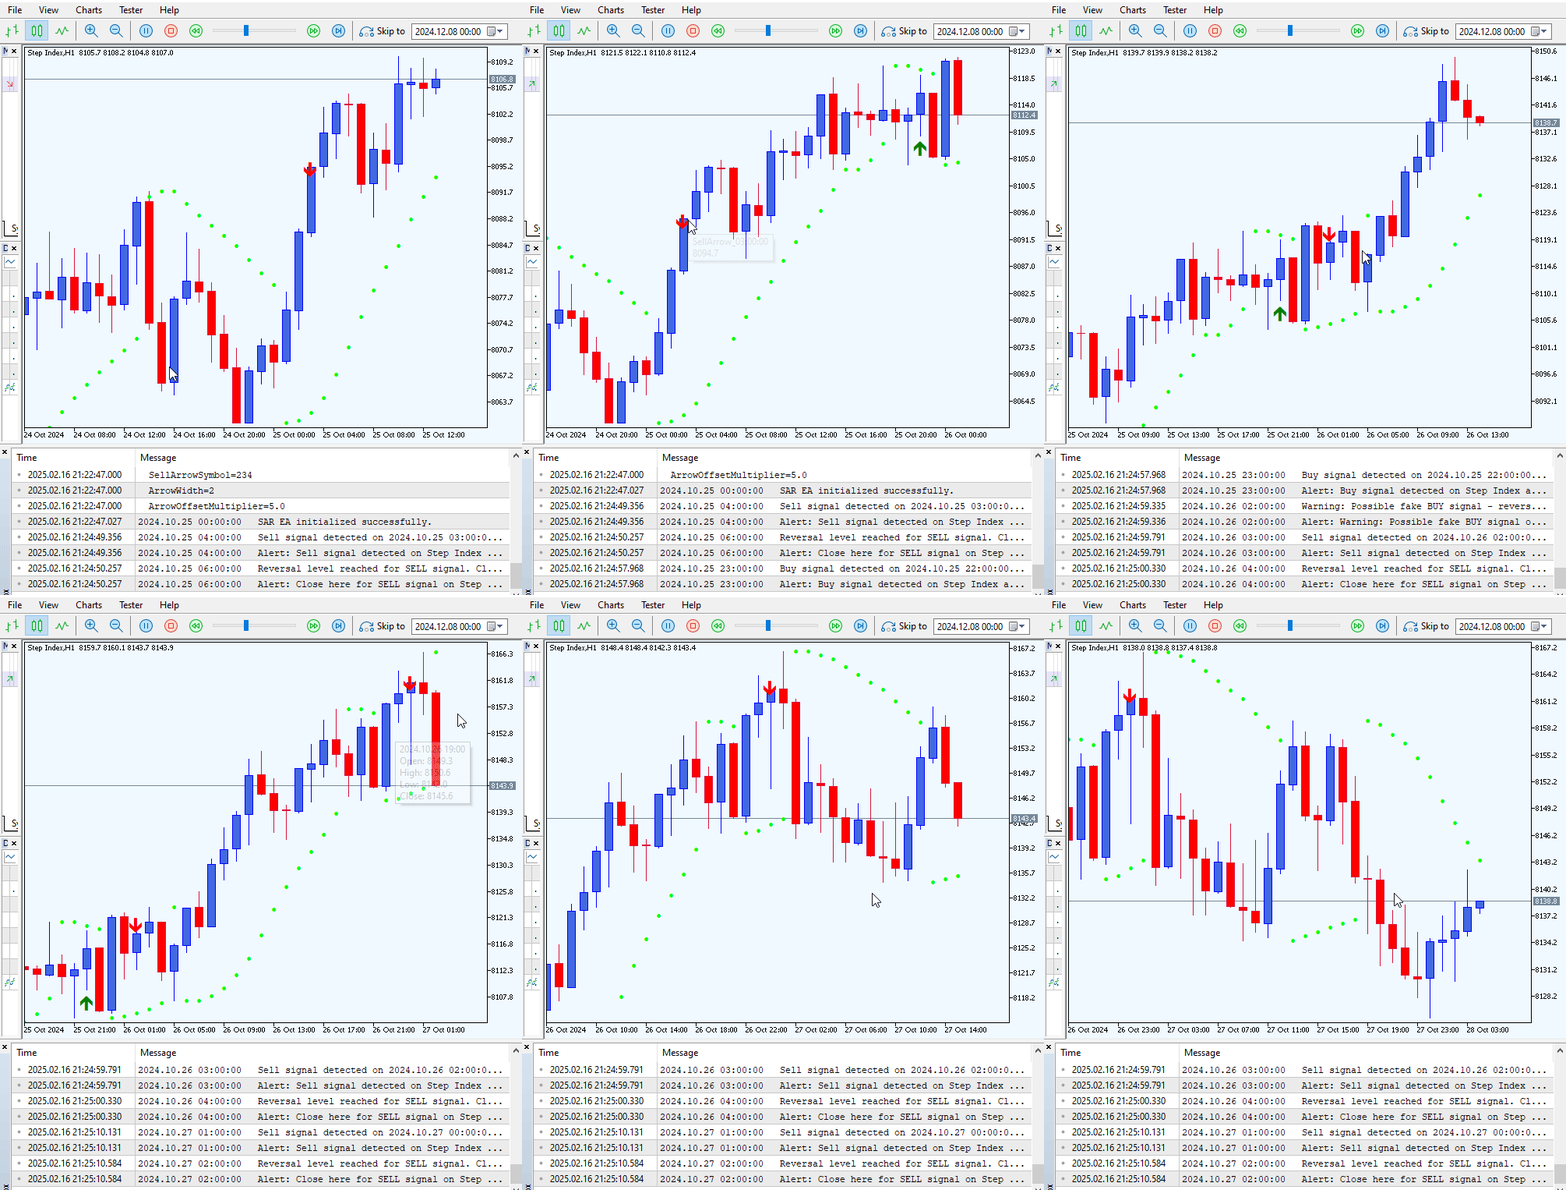
Fig 7: Backtesting On Step Index
Live trading Step Index.
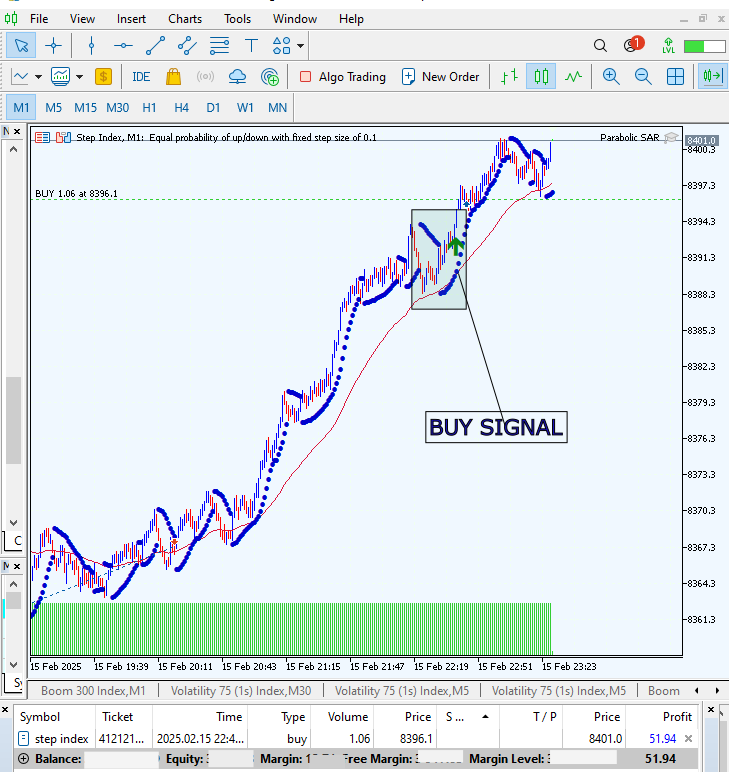
Fig 8: Live Trading
Conclusion
We have developed and tested the EA, achieving positive results. However, some signals may require additional filtering. Remember that this EA is designed to complement your own trading strategies, rather than replace them. Always verify all relevant conditions before executing any trades based on its signals. Furthermore, working with larger timeframes can be crucial in minimizing false signals.
| Date | Tool Name | Description | Version | Updates | Notes |
|---|---|---|---|---|---|
| 01/10/24 | Chart Projector | Script to overlay the previous day's price action with ghost effect. | 1.0 | Initial Release | Tool number 1 |
| 18/11/24 | Analytical Comment | It provides previous day's information in a tabular format, as well as anticipates the future direction of the market. | 1.0 | Initial Release | Tool number 2 |
| 27/11/24 | Analytics Master | Regular Update of market metrics after every two hours | 1.01 | Second Release | Tool number 3 |
| 02/12/24 | Analytics Forecaster | Regular Update of market metrics after every two hours with telegram integration | 1.1 | Third Edition | Tool number 4 |
| 09/12/24 | Volatility Navigator | The EA analyzes market conditions using the Bollinger Bands, RSI and ATR indicators | 1.0 | Initial Release | Tool Number 5 |
| 19/12/24 | Mean Reversion Signal Reaper | Analyzes market using mean reversion strategy and provides signal | 1.0 | Initial Release | Tool number 6 |
| 9/01/25 | Signal Pulse | Multiple timeframe analyzer | 1.0 | Initial Release | Tool number 7 |
| 17/01/25 | Metrics Board | Panel with button for analysis | 1.0 | Initial Release | Tool number 8 |
| 21/01/25 | External Flow | Analytics through external libraries | 1.0 | Initial Release | Tool number 9 |
| 27/01/25 | VWAP | Volume Weighted Average Price | 1.3 | Initial Release | Tool number 10 |
| 02/02/25 | Heikin Ashi | Trend Smoothening and reversal signal identification | 1.0 | Initial Release | Tool number 11 |
| 04/02/25 | FibVWAP | Signal generation through python analysis | 1.0 | Initial Release | Tool number 12 |
| 14/02/25 | RSI DIVERGENCE | Price action versus RSI divergences | 1.0 | Initial Release | Tool number 13 |
| 17/02/2025 | Parabolic Stop and Reverse (PSAR) | Automating PSAR strategy | 1.0 | Initial Release | Tool number 14 |
 Neural Networks in Trading: Practical Results of the TEMPO Method
 William Gann methods (Part I): Creating Gann Angles indicator
 Build Self Optimizing Expert Advisors in MQL5 (Part 6): Stop Out Prevention
 Master MQL5 from beginner to pro (Part IV): About Arrays, Functions and Global Terminal Variables
- Free trading apps
- Over 8,000 signals for copying
- Economic news for exploring financial markets
You agree to website policy and terms of use