
Price Action Analysis Toolkit Development (Part 15): Introducing Quarters Theory (I) — Quarters Drawer Script
Contents
Introduction
In every market, prices move in cycles. Whether prices are trending up or down, they repeatedly oscillate within defined ranges. Over time traders have developed many theories to explain these patterns. In our ongoing series, we are building a comprehensive price action analysis toolkit. Today we introduce an innovative approach that we have automated using MQL5 to simplify application and achieve impressive results.
The Quarters Theory is the focus of this article. It was developed by Ilian Yotov, a name familiar to thousands of currency traders and Forex strategists from his work on the Traders Television Network. Ilian founded AllThingsForex.com and TraderTape.com and hosts the popular daily show All Things Forex. His theory suggests that significant price moves occur between two Large Quarter Points and progress in increments of 250 PIPs. This method offers clear markers to identify key support and resistance levels while giving traders practical insights.
This article is the first part in our Quarters Theory. In this installment, we focus on constructing the quarters using our "quarters drawer" script. By automating the drawing of these crucial levels, we offer a practical starting point for visualizing key reversal and continuation zones. As we advance in this theory, we will develop even more robust tools to support signal generation and advanced market analysis.
Concept Overview
The Quarters Theory is a technical analysis approach that divides a significant price range into smaller, more meaningful segments. In this framework, a "MajorStep"—for example, 0.1000 in currency pairs like EUR/USD, defines the difference between major whole numbers (such as 1.2000 to 1.3000). This range is then subdivided into four equal parts, known as large quarters. Each large quarter represents a critical level where price may pause, reverse, or accelerate, offering traders potential support and resistance areas.
Key components of the Quarters Theory include
- Major Whole Numbers: These are the primary levels (e.g., 1.2000, 1.3000) that frame the trading range. They are used as reference points to build the finer structure of the theory.
- Large Quarter Lines: The interval between two major levels is divided equally into four segments. These lines indicate the intermediate levels that often play an important role in price behavior. Traders use these levels to anticipate potential turning points or areas of consolidation.
- Small Quarter Lines (Optional): For further precision, each 100-pip segment can be subdivided into even smaller intervals, small quarters. Although these lines offer additional granularity, the primary focus remains on the large quarter levels.
- Overshoot/Undershoot Areas: Surrounding each large quarter line, slight offsets (overshoots and undershoots) are drawn to signal zones where price might momentarily exceed or fall short of the expected level. These areas help in identifying potential corrections or reversals.
For further insights, please review the following diagrams
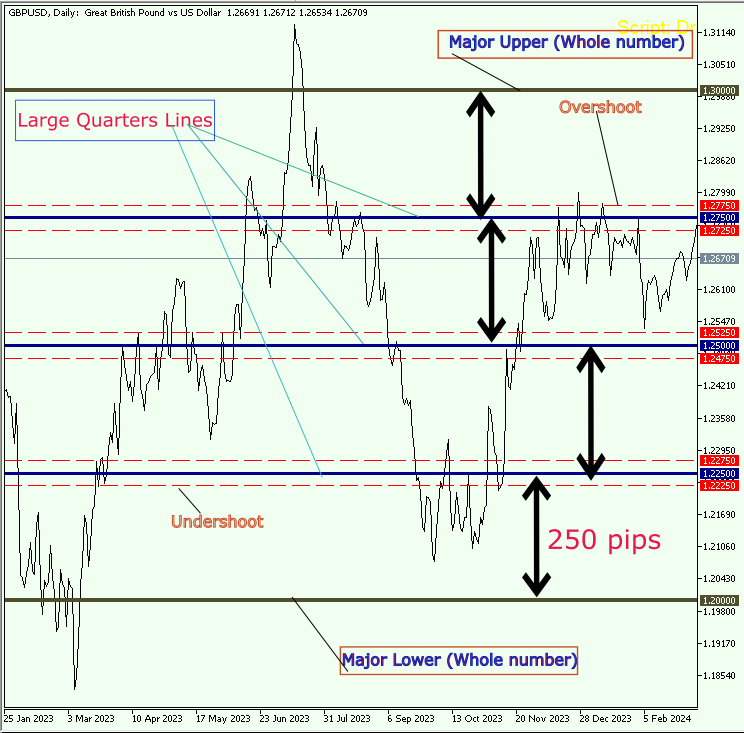
Fig 1. The Quarters
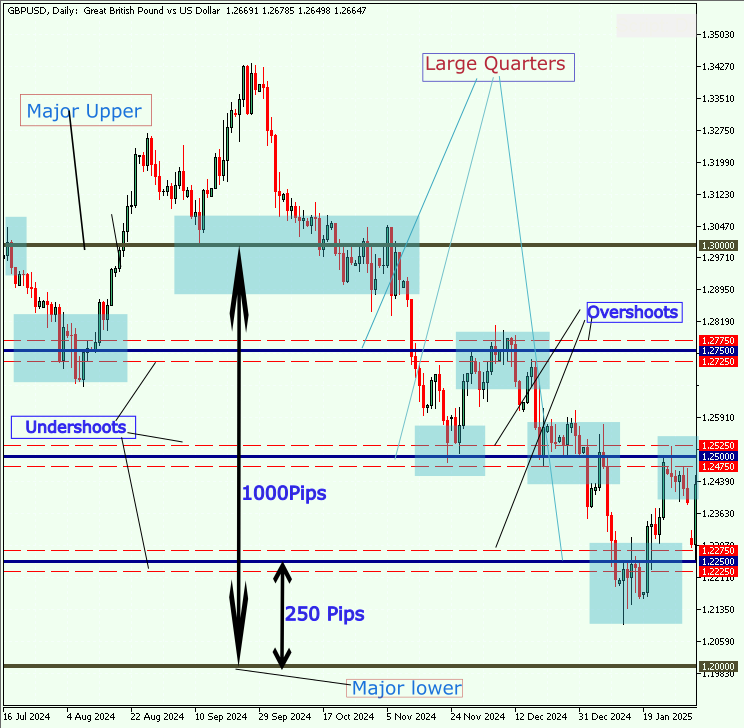
Fig 2. The QUATERS
By visually marking these key levels on a chart, the Quarters Theory provides traders with a structured way to assess price dynamics. The approach is implemented in the script “Quarters Drawer,” which draws distinct lines with varying styles and colors to enhance clarity, ensuring that each group (major, large quarter, and small quarter lines) is easily distinguishable. This visual tool reinforces the theory by clearly highlighting the crucial price segments.
MQL5 Implementation
The first block of the script includes a header comment that provides essential details such as the script’s name, version, copyright information, and a link to the author’s profile. Following this, property declarations embed important metadata (like copyright and version) and enforce strict compilation settings. This combination establishes the script's identity and ensures it adheres to robust coding standards.
//+------------------------------------------------------------------+
//|                                              Quarters Drawer.mql5|
//|                                Copyright 2025, Christian Benjamin|
//|                           https://www.mql5.com/en/users/lynnchris|
//+------------------------------------------------------------------+
#property copyright "Christian Benjamin"
#property link      "https://www.mql5.com/en/users/lynnchris"
#property version   "1.0"
#property strict
Next, the input parameters are defined to give users complete control over the script’s behavior and appearance. Here, you set the interval between major price levels with a parameter like MajorStep, and use boolean flags to toggle the drawing of large quarter lines, small quarter lines, and overshoot/undershoot markers. For instance, if DrawLargeQuarters is set to true, the script will draw large quarter lines, but switching it to false will prevent them from appearing.
The same applies to DrawSmallQuarters and DrawOvershootAreas, if you don’t want to see small quarter lines or overshoot zones, simply toggle their values to false. This makes it easy to customize the display without modifying the core logic. Moreover, color settings and line style/thickness options are provided for each type of line, allowing traders to easily customize the visual output to match their personal preferences and trading strategies.
//---- Input parameters -------------------------------------------------
input double MajorStep          = 0.1000;   // Difference between major whole numbers.
input bool   DrawLargeQuarters  = true;     // Draw intermediate large quarter lines.
input bool   DrawSmallQuarters  = true;     // Draw small quarter lines.
input bool   DrawOvershootAreas = true;     // Mark overshoot/undershoot areas for large quarter lines.

//---- Color settings ---------------------------------------------------
input color  MajorColor         = 0x2F4F4F; // Dark Slate Gray for major lines.
input color  LargeQuarterColor  = 0x8B0000; // Dark Red for large quarter lines.
input color  SmallQuarterColor  = 0x00008B; // Dark Blue for small quarter lines.
input color  OvershootColor     = clrRed;   // Red for overshoot/undershoot lines.

//---- Group style and thickness settings -------------------------------
input ENUM_LINE_STYLE MajorLineStyle       = STYLE_SOLID;
input int    MajorLineWidth                 = 4;
input ENUM_LINE_STYLE LargeQuarterLineStyle  = STYLE_DOT;
input int    LargeQuarterLineWidth          = 3;
input ENUM_LINE_STYLE OvershootLineStyle     = STYLE_DASH;
input int    OvershootLineWidth             = 1;
input ENUM_LINE_STYLE SmallQuarterLineStyle  = STYLE_SOLID;
input int    SmallQuarterLineWidth          = 1;
When you see hexadecimal color codes in the script, they’re representing specific colors by combining red, green, and blue values. For example:
- 0x2F4F4F – This code corresponds to Dark Slate Gray. The two-digit pairs represent the red, green, and blue components respectively. Here, “2F” (47 in decimal) is for red, and “4F” (79 in decimal) for both green and blue, creating a muted, cool gray tone that's ideal for primary lines on a chart.
- 0x8B0000 – This code represents Dark Red. In this value, “8B” (139 in decimal) is a strong red component, while both the green and blue components are “00” (zero), resulting in a deep, intense red. This color is used in the script to emphasize large quarter lines.
- 0x00008B – This code signifies Dark Blue. In this case, the red and green components are “00”, and the blue component is “8B” (139 in decimal), yielding a deep blue color. This is applied to small quarter lines, providing a distinct visual contrast.
In addition to these hard-coded hexadecimal values, the script also uses a predefined constant called clrRed. Instead of specifying a hex code manually, you can simply use this built-in constant, which typically represents the color red with the RGB values (255, 0, 0). For instance, the script sets the overshoot color like this:
input color OvershootColor = clrRed;
Following the inputs, the script features a dedicated function that handles drawing horizontal lines on the chart. This function first checks whether a line with the specified name already exists, removing it if necessary to avoid duplicates. It then creates a new horizontal line at a specified price level and applies the defined color, style, and width. By ensuring that each line extends across the chart, this modular function simplifies the process of drawing multiple lines consistently throughout the script.
//+------------------------------------------------------------------+
//| DrawHorizontalLine: Creates or replaces a horizontal line        |
//+------------------------------------------------------------------+
void DrawHorizontalLine(string name, double price, color lineColor, int width, ENUM_LINE_STYLE style)
{
   // Delete the object if it already exists
   if(ObjectFind(0, name) != -1)
      ObjectDelete(0, name);

   // Create a new horizontal line object
   if(!ObjectCreate(0, name, OBJ_HLINE, 0, 0, price))
   {
      Print("Failed to create line: ", name);
      return;
   }

   // Set properties: color, style, width, and extension to the right
   ObjectSetInteger(0, name, OBJPROP_COLOR, lineColor);
   ObjectSetInteger(0, name, OBJPROP_STYLE, style);
   ObjectSetInteger(0, name, OBJPROP_WIDTH, width);
   ObjectSetInteger(0, name, OBJPROP_RAY_RIGHT, true);
}
The script’s main execution begins with the OnStart function, where it retrieves the current symbol and its bid price. This step is crucial, as all subsequent calculations depend on a valid market price. If the bid price isn’t available, the script exits early to prevent any errors, ensuring that further operations are only performed with valid data.
void OnStart()
{
   // Get current symbol price
   string symbol = _Symbol;
   double currentPrice = SymbolInfoDouble(symbol, SYMBOL_BID);
   if(currentPrice == 0)
      return;
Once the current price is obtained, the script calculates the major price levels that will serve as the primary reference points. It determines the lower level by rounding down the current price to the nearest interval defined by MajorStep, and then computes the upper level by adding that same step. These calculated levels create a structured framework, setting clear boundaries for the rest of the visual grid.
   // Calculate the major range based on the current price and MajorStep
   double lowerMajor = MathFloor(currentPrice / MajorStep) * MajorStep;
   double upperMajor = lowerMajor + MajorStep;
Using these major price levels, the script then draws two prominent horizontal lines at the lower and upper boundaries. These major lines are styled with specific colors, thicknesses, and line patterns, making them easily identifiable on the chart. They act as the backbone for the chart’s visual structure, helping traders quickly spot significant support and resistance areas.
   // Draw Major Whole Number lines at lower and upper boundaries
   DrawHorizontalLine("MajorLower", lowerMajor, MajorColor, MajorLineWidth, MajorLineStyle);
   DrawHorizontalLine("MajorUpper", upperMajor, MajorColor, MajorLineWidth, MajorLineStyle);
If the option to draw large quarter lines is enabled, the script subdivides the major interval into four equal parts. It calculates intermediate levels between the major boundaries and draws horizontal lines at these points. Furthermore, if overshoot/undershoot markers are also activated, additional lines are drawn just above and below each large quarter line. These extra markers serve to highlight areas where the price might temporarily extend beyond its expected range, offering traders valuable insights into potential price reversals.
   // Draw Large Quarter lines and overshoot/undershoot lines if enabled
   if(DrawLargeQuarters)
   {
      double LQIncrement = MajorStep / 4.0;
      for(int i = 1; i < 4; i++)
      {
         double level = lowerMajor + i * LQIncrement;
         string objName = "LargeQuarter_" + IntegerToString(i);
         DrawHorizontalLine(objName, level, LargeQuarterColor, LargeQuarterLineWidth, LargeQuarterLineStyle);

         if(DrawOvershootAreas)
         {
            double smallQuarter = MajorStep / 40.0;
            DrawHorizontalLine("Overshoot_" + IntegerToString(i) + "_up", level + smallQuarter, OvershootColor, OvershootLineWidth, OvershootLineStyle);
            DrawHorizontalLine("Undershoot_" + IntegerToString(i) + "_down", level - smallQuarter, OvershootColor, OvershootLineWidth, OvershootLineStyle);
         }
      }
   }
For even finer detail, the script can also draw small quarter lines when that option is enabled. It divides the major interval into ten segments, and then further splits each segment into smaller subdivisions. This creates a more granular grid that captures subtle price movements, providing traders with a detailed view that can be particularly useful for identifying precise entry and exit points.
   // Draw Small Quarter lines if enabled
   if(DrawSmallQuarters)
   {
      double segStep = MajorStep / 10.0;
      double smallQuarter = segStep / 4.0;
      for(int seg = 0; seg < 10; seg++)
      {
         double segStart = lowerMajor + seg * segStep;
         for(int j = 1; j < 4; j++)
         {
            double level = segStart + j * smallQuarter;
            string objName = "SmallQuarter_" + IntegerToString(seg) + "_" + IntegerToString(j);
            DrawHorizontalLine(objName, level, SmallQuarterColor, SmallQuarterLineWidth, SmallQuarterLineStyle);
         }
      }
   }
To round off the visual enhancements, the script adds a persistent label, or logo, to the chart. This label displays the script’s name, version, and author information, acting as both a credit and a quick reference for users. Before placing the label, the script checks for any existing instance to avoid duplicates, then positions the label in the top-right corner with carefully chosen font size and color settings for clear visibility.
   // Create a persistent label (logo) in the top-right corner
   if(ObjectFind(0, "ScriptLogo") != -1)
      ObjectDelete(0, "ScriptLogo");
   if(ObjectCreate(0, "ScriptLogo", OBJ_LABEL, 0, 0, 0))
   {
      string logoText = "Script: DrawQuarters_DarkBold\nv1.04\nby Christian Benjamin";
      ObjectSetString(0, "ScriptLogo", OBJPROP_TEXT, logoText);
      ObjectSetInteger(0, "ScriptLogo", OBJPROP_COLOR, clrYellow);
      ObjectSetInteger(0, "ScriptLogo", OBJPROP_FONTSIZE, 14);
      ObjectSetInteger(0, "ScriptLogo", OBJPROP_CORNER, CORNER_RIGHT_UPPER);
      ObjectSetInteger(0, "ScriptLogo", OBJPROP_XDISTANCE, 80);
      ObjectSetInteger(0, "ScriptLogo", OBJPROP_YDISTANCE, 10);
   }
Finally, the script refreshes the chart with a redraw command, ensuring that all the drawn objects (lines and labels) are immediately visible. This final step is crucial as it updates the display to reflect the latest market data and custom settings, presenting a complete and current visual tool for technical analysis.
   // Redraw the chart to display all objects
   ChartRedraw();
}
MQL5 Code
//+------------------------------------------------------------------+
//|                                              Quarters Drawer.mql5|
//|                                Copyright 2025, Christian Benjamin|
//|                           https://www.mql5.com/en/users/lynnchris|
//+------------------------------------------------------------------+
#property copyright "Christian Benjamin"
#property link      "https://www.mql5.com/en/users/lynnchris"
#property version   "1.0"
#property strict

//---- Input parameters -------------------------------------------------
input double MajorStep          = 0.1000;   // Difference between major whole numbers.
input bool   DrawLargeQuarters  = true;     // Draw intermediate large quarter lines.
input bool   DrawSmallQuarters  = true;    // Draw small quarter lines.
input bool   DrawOvershootAreas = true;     // Mark overshoot/undershoot areas for large quarter lines.

//---- Color settings ---------------------------------------------------
input color  MajorColor         = 0x2F4F4F; // Dark Slate Gray for major lines.
input color  LargeQuarterColor  = 0x8B0000; // Dark Red for large quarter lines.
input color  SmallQuarterColor  = 0x00008B; // Dark Blue for small quarter lines.
input color  OvershootColor     = clrRed;   // Red for overshoot/undershoot lines.

//---- Group style and thickness settings -------------------------------
input ENUM_LINE_STYLE MajorLineStyle       = STYLE_SOLID;
input int    MajorLineWidth                 = 4;
input ENUM_LINE_STYLE LargeQuarterLineStyle  = STYLE_DOT;
input int    LargeQuarterLineWidth          = 3;
input ENUM_LINE_STYLE OvershootLineStyle     = STYLE_DASH;
input int    OvershootLineWidth             = 1;
// For small quarter lines, we now use a continuous (solid) style.
input ENUM_LINE_STYLE SmallQuarterLineStyle  = STYLE_SOLID;
input int    SmallQuarterLineWidth          = 1;

//+------------------------------------------------------------------+
//| DrawHorizontalLine: Creates or replaces a horizontal line        |
//+------------------------------------------------------------------+
void DrawHorizontalLine(string name, double price, color lineColor, int width, ENUM_LINE_STYLE style)
  {
   if(ObjectFind(0, name) != -1)
      ObjectDelete(0, name);

   if(!ObjectCreate(0, name, OBJ_HLINE, 0, 0, price))
     {
      Print("Failed to create line: ", name);
      return;
     }

   ObjectSetInteger(0, name, OBJPROP_COLOR, lineColor);
   ObjectSetInteger(0, name, OBJPROP_STYLE, style);
   ObjectSetInteger(0, name, OBJPROP_WIDTH, width);
   ObjectSetInteger(0, name, OBJPROP_RAY_RIGHT, true);
  }

//+------------------------------------------------------------------+
//| Script entry point                                               |
//+------------------------------------------------------------------+
void OnStart()
  {
// Get current symbol price
   string symbol = _Symbol;
   double currentPrice = SymbolInfoDouble(symbol, SYMBOL_BID);
   if(currentPrice == 0)
      return;

// Calculate the major range
   double lowerMajor = MathFloor(currentPrice / MajorStep) * MajorStep;
   double upperMajor = lowerMajor + MajorStep;

// Draw Major Whole Number lines
   DrawHorizontalLine("MajorLower", lowerMajor, MajorColor, MajorLineWidth, MajorLineStyle);
   DrawHorizontalLine("MajorUpper", upperMajor, MajorColor, MajorLineWidth, MajorLineStyle);

// Draw Large Quarter lines and their overshoot/undershoot lines
   if(DrawLargeQuarters)
     {
      double LQIncrement = MajorStep / 4.0;
      for(int i = 1; i < 4; i++)
        {
         double level = lowerMajor + i * LQIncrement;
         string objName = "LargeQuarter_" + IntegerToString(i);
         DrawHorizontalLine(objName, level, LargeQuarterColor, LargeQuarterLineWidth, LargeQuarterLineStyle);

         if(DrawOvershootAreas)
           {
            double smallQuarter = MajorStep / 40.0;
            DrawHorizontalLine("Overshoot_" + IntegerToString(i) + "_up", level + smallQuarter, OvershootColor, OvershootLineWidth, OvershootLineStyle);
            DrawHorizontalLine("Undershoot_" + IntegerToString(i) + "_down", level - smallQuarter, OvershootColor, OvershootLineWidth, OvershootLineStyle);
           }
        }
     }

// Draw Small Quarter lines if enabled (continuous lines, without overshoot/undershoot)
   if(DrawSmallQuarters)
     {
      double segStep = MajorStep / 10.0;
      double smallQuarter = segStep / 4.0;
      for(int seg = 0; seg < 10; seg++)
        {
         double segStart = lowerMajor + seg * segStep;
         for(int j = 1; j < 4; j++)
           {
            double level = segStart + j * smallQuarter;
            string objName = "SmallQuarter_" + IntegerToString(seg) + "_" + IntegerToString(j);
            DrawHorizontalLine(objName, level, SmallQuarterColor, SmallQuarterLineWidth, SmallQuarterLineStyle);
           }
        }
     }

// Create a persistent label (logo) in the top-right corner
   if(ObjectFind(0, "ScriptLogo") != -1)
      ObjectDelete(0, "ScriptLogo");
   if(ObjectCreate(0, "ScriptLogo", OBJ_LABEL, 0, 0, 0))
     {
      string logoText = "Script: DrawQuarters_DarkBold\nv1.04\nby Christian Benjamin";
      ObjectSetString(0, "ScriptLogo", OBJPROP_TEXT, logoText);
      ObjectSetInteger(0, "ScriptLogo", OBJPROP_COLOR, clrYellow);
      ObjectSetInteger(0, "ScriptLogo", OBJPROP_FONTSIZE, 14);
      ObjectSetInteger(0, "ScriptLogo", OBJPROP_CORNER, CORNER_RIGHT_UPPER);
      ObjectSetInteger(0, "ScriptLogo", OBJPROP_XDISTANCE, 80);
      ObjectSetInteger(0, "ScriptLogo", OBJPROP_YDISTANCE, 10);
     }

   ChartRedraw();
  }
//+------------------------------------------------------------------+
Outcomes
Before exploring the outcomes, here is how to create and compile the script. Open MetaEditor and select "New" then choose "Script." Enter a name for your script and start writing your code. Compile the script. If errors appear, fix them until the compilation is successful. Once compiled, test your script on a chart. Since it is not an EA, you can run it on a live chart in either demo or live mode without affecting your balance.
In this section, I have several diagrams for visual understanding. I will guide you through each diagram step by step. The first diagram shows a test on the AUD/USD pair. In that test, I enabled DrawLargeQuarters along with overshoot and undershoot areas and set DrawSmallQuarters to false.
//---- Input parameters -------------------------------------------------
input double MajorStep          = 0.1000;   // Difference between major whole numbers.
input bool   DrawLargeQuarters  = true;     // Draw intermediate large quarter lines.
input bool   DrawSmallQuarters  = false;    // Draw small quarter lines.
input bool   DrawOvershootAreas = true;     // Mark overshoot/undershoot areas for large quarter lines.
Let's review Figure 2 below. It shows how I added the script and the outcomes recorded. We see how the price interacts with the Quarters and their overshoot and undershoot.
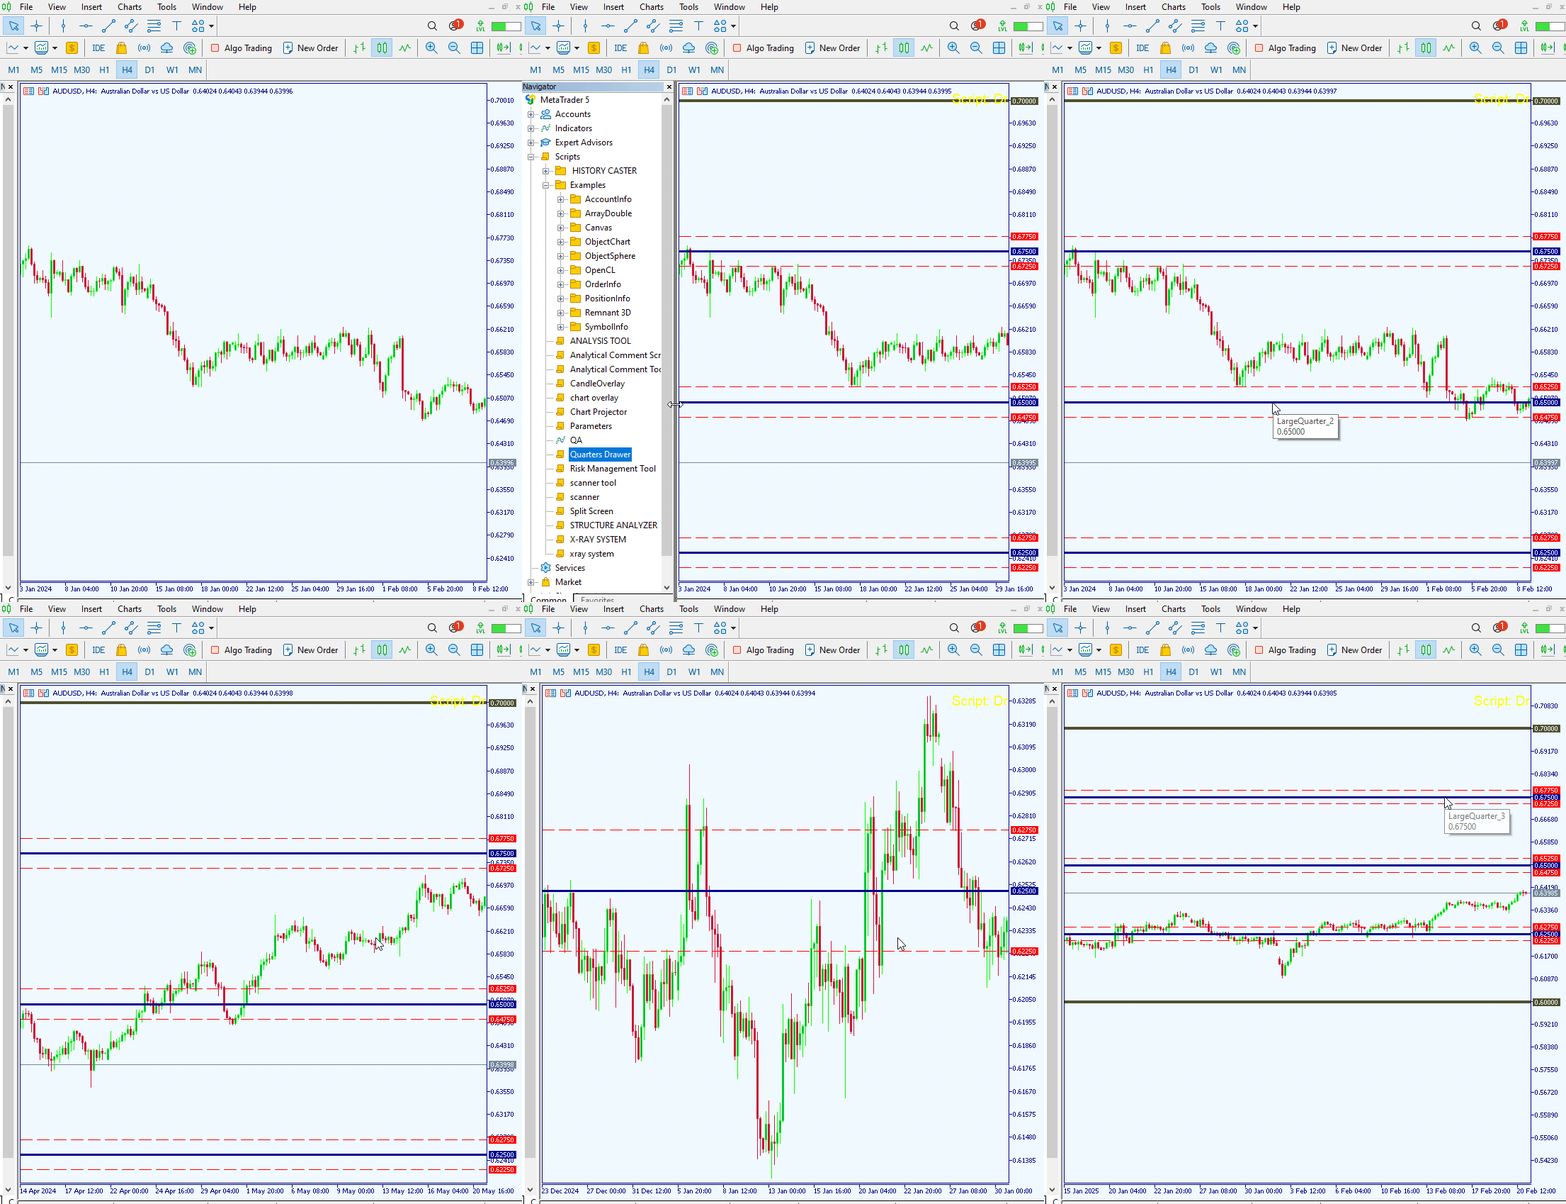
Fig 2. AUDUSD Quarters
Below is a screenshot captured on the same pair. I have highlighted the effect of the quarters on the chart. The results are clear: the market finds support and resistance at our larger quarter levels. I set the overshoot lines and smaller quartile options to false to clearly visualize these large quarters.
//---- Input parameters -------------------------------------------------
input double MajorStep          = 0.1000;   // Difference between major whole numbers.
input bool   DrawLargeQuarters  = true;     // Draw intermediate large quarter lines.
input bool   DrawSmallQuarters  = false;    // Draw small quarter lines.
input bool   DrawOvershootAreas = false;     // Mark overshoot/undershoot areas for large quarter lines.
See Figure 3 below
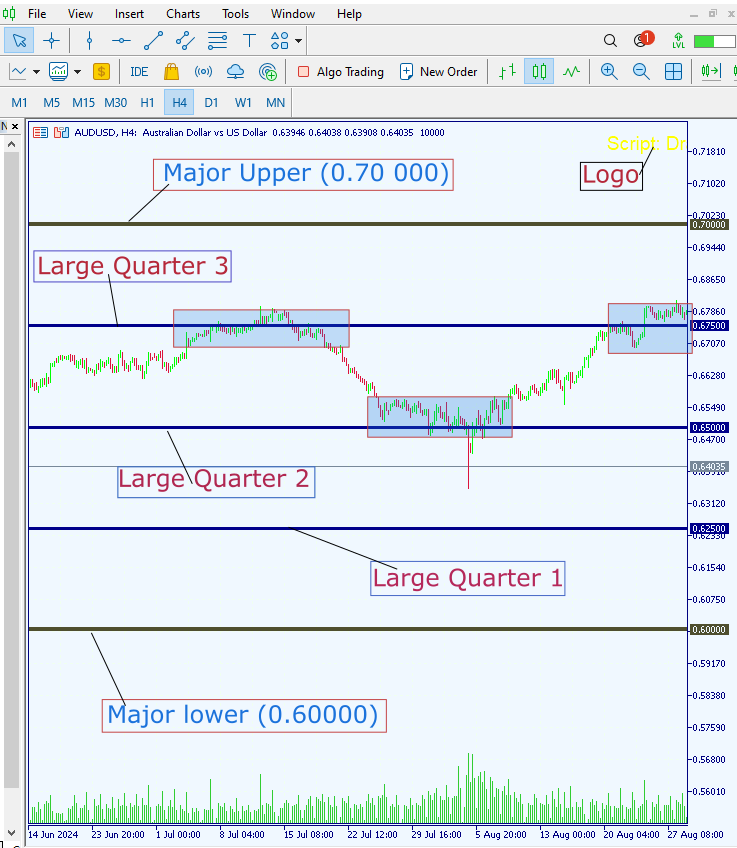
Fig 3. Large Quarters
I have zoomed in further so you can clearly see how the price interacts with the large quarter line, including its undershoots and overshoots.
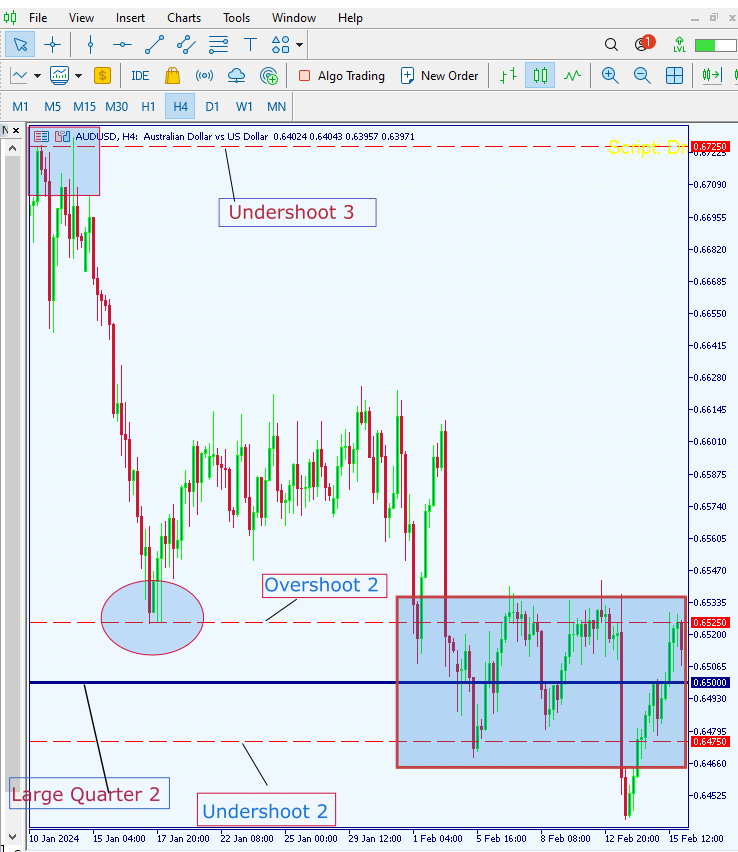
Fig 4. Overshoot and Undershoot
Lastly, let's examine the script's performance on EUR/USD. Key levels that every FX trader hunts for are clearly identified by the quarter levels.
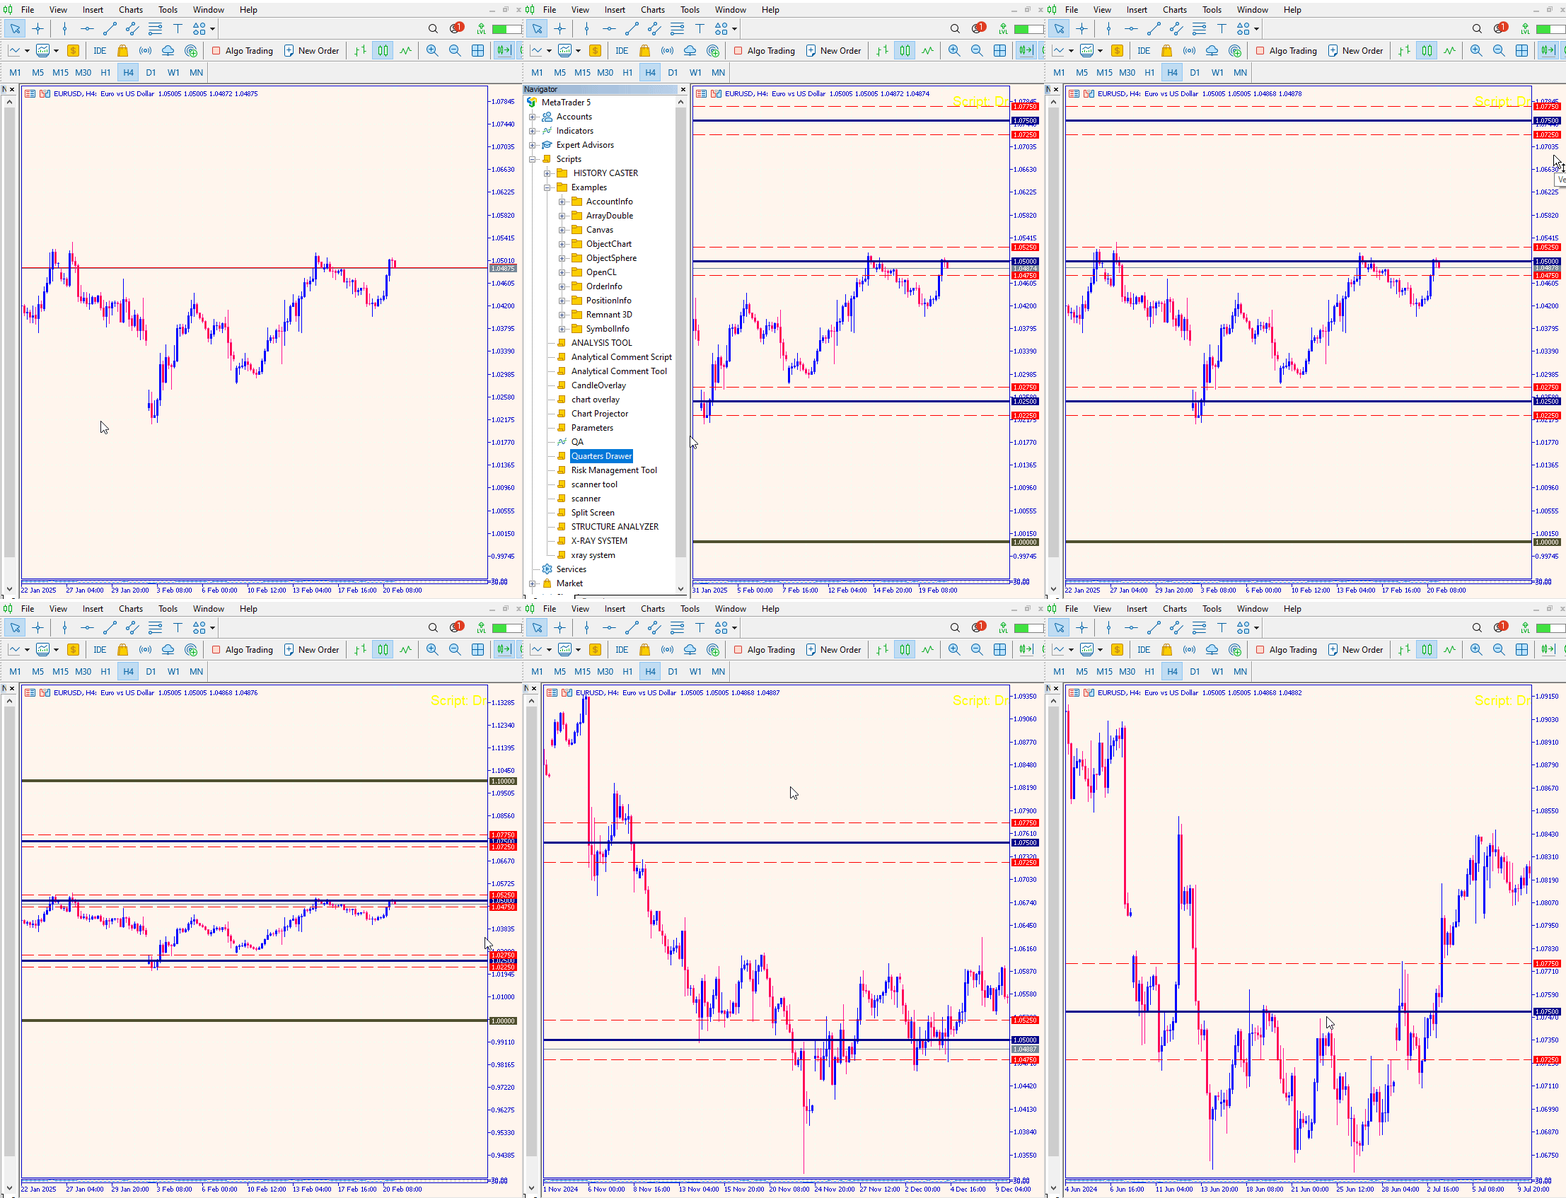
Fig 5. EURUSD Quarters
Please refer to the book: The_Quarters_Theory_-_Ilian_Yotov
Conclusion
I am sure you can all see the impact of this script. It draws the quarters and does the calculations that would be time-consuming to do manually. A notable aspect is how the quartile lines serve as support and reversal levels. The large quartiles, the major lower and upper levels, act as significant resistance and support, while the smaller quartiles serve as minor levels. This initial approach is a strong starting point for automated analysis. We look forward to developing more tools as we dive deeper into this theory. If you have any suggestions or recommendations, please share them.
| Date | Tool Name | Description | Version | Updates | Notes |
|---|---|---|---|---|---|
| 01/10/24 | Chart Projector | Script to overlay the previous day's price action with ghost effect. | 1.0 | Initial Release | Tool number 1 |
| 18/11/24 | Analytical Comment | It provides previous day's information in a tabular format, as well as anticipates the future direction of the market. | 1.0 | Initial Release | Tool number 2 |
| 27/11/24 | Analytics Master | Regular Update of market metrics after every two hours | 1.01 | Second Release | Tool number 3 |
| 02/12/24 | Analytics Forecaster | Regular Update of market metrics after every two hours with telegram integration | 1.1 | Third Edition | Tool number 4 |
| 09/12/24 | Volatility Navigator | The EA analyzes market conditions using the Bollinger Bands, RSI and ATR indicators | 1.0 | Initial Release | Tool Number 5 |
| 19/12/24 | Mean Reversion Signal Reaper | Analyzes market using mean reversion strategy and provides signal | 1.0 | Initial Release | Tool number 6 |
| 9/01/25 | Signal Pulse | Multiple timeframe analyzer | 1.0 | Initial Release | Tool number 7 |
| 17/01/25 | Metrics Board | Panel with button for analysis | 1.0 | Initial Release | Tool number 8 |
| 21/01/25 | External Flow | Analytics through external libraries | 1.0 | Initial Release | Tool number 9 |
| 27/01/25 | VWAP | Volume Weighted Average Price | 1.3 | Initial Release | Tool number 10 |
| 02/02/25 | Heikin Ashi | Trend Smoothening and reversal signal identification | 1.0 | Initial Release | Tool number 11 |
| 04/02/25 | FibVWAP | Signal generation through python analysis | 1.0 | Initial Release | Tool number 12 |
| 14/02/25 | RSI DIVERGENCE | Price action versus RSI divergences | 1.0 | Initial Release | Tool number 13 |
| 17/02/25 | Parabolic Stop and Reverse (PSAR) | Automating PSAR strategy | 1.0 | Initial Release | Tool number 14 |
| 20/02/25 | Quarters Drawer Script | Drawing quarters levels on chart | 1.0 | Initial Release | Tool number 15 |
 From Basic to Intermediate: Operators
 Trading with the MQL5 Economic Calendar (Part 6): Automating Trade Entry with News Event Analysis and Countdown Timers
 William Gann methods (Part II): Creating Gann Square indicator
 Automating Trading Strategies in MQL5 (Part 9): Building an Expert Advisor for the Asian Breakout Strategy
- Free trading apps
- Over 8,000 signals for copying
- Economic news for exploring financial markets
You agree to website policy and terms of use