
Price Action Analysis Toolkit Development (Part 10): External Flow (II) VWAP
Introduction
In our previous article, we introduced the integration of market data with external libraries, showcasing the ability to analyze markets through various automated systems. Python's robust framework offers powerful tools for advanced data analysis, predictive modeling, and visualization, while MQL5 focuses on seamless trade execution and chart-based operations. By combining these strengths, we achieve a flexible, efficient, and sophisticated system for market analysis and trading.
This article presents a powerful tool built around the concept of Volume Weighted Average Price (VWAP) to deliver precise trading signals. Leveraging Python's advanced libraries for calculations enhances the accuracy of the analysis, resulting in highly actionable VWAP signals. We’ll start by exploring the strategy, then delve into the core logic of the MQL5 code and discuss the outcomes. Finally, we’ll wrap up with a conclusion. Let’s take a look at the table of contents below:
Understanding the Strategy
VWAP, or volume-weighted average price, is a technical analysis tool that reflects the ratio of an asset's price to its total trading volume. It gives traders and investors a sense of the average price at which a stock has been traded over a specific period. VWAP is often used as a benchmark by more passive investors, such as pension funds and mutual funds, who seek to evaluate the quality of their trades. It is also valuable for traders looking to determine whether an asset was bought or sold at an optimal price.To calculate VWAP, the formula is:
VWAP = ∑(quantity of asset traded × asset price) / total volume traded that day
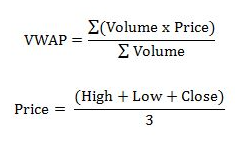
The VWAP is typically calculated using orders placed during a single trading day. However, it can also be applied across multiple timeframes for a broader market analysis. On a chart, VWAP appears as a line, and it serves as a dynamic reference point. When the price is above the VWAP, the market is generally in an uptrend. Conversely, when the price is below the VWAP, the market is typically considered to be in a downtrend. In the image below, I have visualized the VWAP strategy by highlighting key levels where price tends to react around the VWAP. These marked levels show how the market often interacts with the VWAP line.

Fig 1. VWAP Strategy
Let's explore the logic behind this system. First, we’ll examine the insights presented in the diagram below, followed by a detailed explanation.
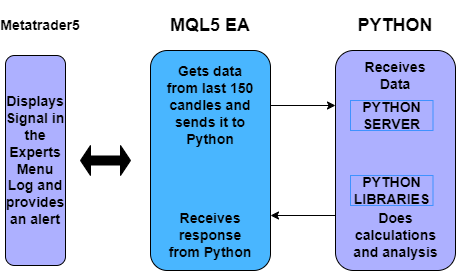
Fig 2. System Logic
The VWAP Expert Advisor (EA) is designed to monitor charts and interact seamlessly with Python for advanced market analysis. It sends market data to Python and logs the received trading signals in the MetaTrader 5 Experts tab. The strategy utilizes the Volume-Weighted Average Price (VWAP) as its core indicator to provide precise and actionable insights. Below is a detailed breakdown of the strategy:
1. Data Collection
The EA collects historical market data (price and volume) from the last 150 candles. It ensures the data is valid (e.g., no missing or zero values). The data is saved as a CSV file for traceability and sent to a Python server for analysis.
2. Python Analysis
The Python script calculates VWAP using the received data and leverages advanced libraries for precise computation. Two libraries handle the core calculations and analysis: Pandas and NumPy. Pandas facilitates data manipulation, rolling averages, and cumulative calculations, while NumPy manages numerical operations, including conditional logic and vectorized computations. Together, they provide efficient and accurate processing for time-series data analysis.
The analysis includes:
- VWAP Calculation: Determines the average price weighted by volume over the selected timeframe.
- Signal Generation: Provides trading signals (e.g., buy/sell) based on the relationship between current price and VWAP levels.
- Explanations: Each signal includes a textual explanation to clarify why it was generated.
3. Signal Confirmation
The EA introduces a confirmation mechanism:
Signals are only updated if they appear consistently over multiple intervals (e.g., 2 confirmation periods).
This reduces false positives and increases signal reliability.
4. Output and Alerts
Signals are displayed as:
- Alerts: Real-time notifications for immediate trader action.
- Log Messages: Printed in the EA's terminal for review.
Future versions may include graphical annotations on the chart for better visualization.
Python MQL5 Handles large datasets efficiently. Monitors the market and integrates with the chart in real-time Leverages robust libraries for advanced computation and modeling Offers immediate alerts and notifications Ensures better accuracy and flexibility in VWAP-based strategies Using VWAP on MQL5 helps highlight key levels of market support and resistance. This allows traders to make decisions based on the market's reaction to VWAP, which often acts as a strong pivot point for price movements.
Core Logic
1. MQL5 EA
Initialization: Setting Up the EA
When you first apply the Expert Advisor (EA) to a chart, the OnInit() function is executed. This function is responsible for initializing the EA, setting up necessary resources, and ensuring that everything is ready to run. It’s where we typically include setup tasks like printing messages, initializing variables, or setting parameters. In our case, we simply print a message that confirms the EA has been initialized. This step also returns INIT_SUCCEEDED to indicate that initialization was successful, which is crucial for the EA to function properly.
int OnInit()
{
   Print("VWAP Expert initialized.");
   return(INIT_SUCCEEDED);
}
Initialization is the first stage where the EA establishes its foundation. It’s vital to ensure any parameters or resources are properly set up. A simple confirmation message lets you know that the EA is good to go.
Deinitialization: Cleaning Up When EA Stops
Deinitialization happens when the EA is removed from the chart or when MetaTrader closes. The OnDeinit() function is called to clean up any resources that were allocated or initialized during OnInit(). Here, it simply prints a message indicating that the EA is being deinitialized. This is a good practice to ensure that any resources or processes the EA might have been using are closed properly to prevent memory leaks or unnecessary background processes from running.
void OnDeinit(const int reason)
{
   Print("VWAP Expert deinitialized.");
}
Proper deinitialization is crucial for maintaining system performance. Always clean up resources when an EA is removed to avoid leaving hanging processes. Deinitialization functions might include saving data, closing connections, or stopping timers.
Collecting Market Data (Candles)
The core of this EA involves collecting market data (candles) for analysis. This process starts within the OnTick() function, which is executed every time the market price updates. The EA is configured to gather data at set intervals, with each interval defined by signalIntervalMinutes. Once enough time has passed since the last signal, the EA begins collecting the market data (open, high, low, close, volume) for the last numCandles number of bars.
The data is then formatted as a CSV string, which is crucial because it will be sent to the Python server for further processing. The loop iterates backward from the most recent candle to ensure we capture the latest market data, and the data is formatted in a standardized way using StringFormat().
int totalBars = iBars(Symbol(), Period());
if (totalBars < numCandles)
{
   Print("Error: Not enough candles on the chart to collect ", numCandles, " candles.");
   return;
}

for (int i = numCandles - 1; i >= 0; i--)
{
   datetime currentTime = iTime(Symbol(), Period(), i);
   if (currentTime == 0) continue;

   double high = iHigh(Symbol(), Period(), i);
   double low = iLow(Symbol(), Period(), i);
   double close = iClose(Symbol(), Period(), i);
   double open = iOpen(Symbol(), Period(), i);
   long volume = iVolume(Symbol(), Period(), i);

   if (high == 0 || low == 0 || close == 0 || volume == 0)
   {
      Print("Skipping invalid data at ", TimeToString(currentTime, TIME_DATE | TIME_MINUTES));
      continue;
   }

   csvData += StringFormat("%s,%.5f,%.5f,%.5f,%.5f,%ld\n",
                           TimeToString(currentTime, TIME_DATE | TIME_MINUTES),
                           high, low, open, close, volume);
}
iBars():
iBars() retrieves the total number of bars (candles) available on the chart for the current symbol and timeframe. The EA checks if there are at least numCandles bars available. If not, it prints an error message and returns from the function, preventing further data collection.
for Loop:
The for loop iterates backward from the most recent bar (numCandles - 1) to the oldest bar (0), collecting the required number of candles.
iTime(), iHigh(), iLow(), iOpen(), iClose(), iVolume():
These functions fetch the relevant price data for each candle. iTime() gets the timestamp, iHigh() gets the high price, iLow() gets the low price, and so on.
Data Validation:
Before appending data to the CSV string, the EA checks for missing or invalid data (zero values). If any candle’s data is invalid, the iteration continues, and that candle is skipped.
String Formatting:
StringFormat() is used to format the candle data into a CSV row. Each field is separated by a comma, and the timestamp is formatted into a readable string using TimeToString().
Writing Data to a CSV File
Once we’ve collected the data, the next step is to write it to a CSV file. This is essential because we want to save the collected data locally before sending it to the Python server. The FileOpen() function opens the file in write mode, and FileWriteString() writes the formatted CSV data into it. After writing the data, the file is closed to finalize the process and ensure no data is lost.
The CSV file is saved in the MQL5\\Files directory, a special directory in MetaTrader used for storing files that the platform can access. This ensures that the file is easily retrievable if needed.
string fileName = StringFormat("%s_vwap_data.csv", Symbol());
string filePath = "MQL5\\Files\\" + fileName;
int fileHandle = FileOpen(filePath, FILE_WRITE | FILE_CSV | FILE_ANSI);
if (fileHandle != INVALID_HANDLE) {
    FileWriteString(fileHandle, csvData);
    FileClose(fileHandle);
} else {
    Print("Failed to open file for writing: ", filePath);
}
Writing the data to a CSV file is a way of storing the information locally for future analysis. Using FILE_CSV ensures the data is saved in a standardized format, making it compatible with other systems, like Python. Error handling here ensures that if the file can’t be opened, the EA gracefully handles the issue and prints an error message.
Sending Data to Python Server for VWAP Analysis
Now, the collected data is ready to be sent to a Python server for analysis. This is done using the WebRequest() function, which allows the EA to make HTTP requests. The CSV data is converted into a character array (StringToCharArray()) and sent to the server via a POST request. The headers specify that the content being sent is CSV, and the response from the server is captured in a result array.
The timeout parameter is set to 5000 milliseconds (5 seconds), ensuring the request doesn’t hang for too long if the server doesn’t respond.
char data[];
StringToCharArray(csvData, data);

string headers = "Content-Type: text/csv\r\n";
char result[];
string resultHeaders;
int timeout = 5000;

int responseCode = WebRequest("POST", pythonUrl, headers, timeout, data, result, resultHeaders);
HTTP POST is used here because it’s the best way to send data to a server without altering the URL. WebRequest() handles the communication with the Python server, where all the heavy lifting (i.e., VWAP calculations) happens. The timeout ensures the EA doesn’t hang if the server is unresponsive, maintaining smooth operation.
Handling the Response from the Python Server
After sending the data, we need to handle the response from the Python server. This is where the real magic happens, as the Python server analyzes the data and provides a trading signal based on the VWAP (Volume Weighted Average Price). The response is returned in JSON format, and we use a helper function, ExtractValueFromJSON(), to extract the relevant values (VWAP and explanation) from the response.
If the response is successful (HTTP code 200), we parse out the necessary information and proceed with the trading logic. If the response contains valid data, we can proceed with generating a new signal.
// Check if the request was successful
if (responseCode == 200) {
    string response = CharArrayToString(result); // Convert the result array to a string
    Print("Server response: ", response);  // Print the server's response

    // Validate if the required data is present in the response
    if (StringFind(response, "\"vwap\":") == -1 || StringFind(response, "\"signal_explanation\":") == -1) {
        Print("Error: Invalid response from server. Response: ", response);
        return;
    }

    // Extract individual data points from the JSON response
    string vwap = ExtractValueFromJSON(response, "vwap");
    string explanation = ExtractValueFromJSON(response, "signal_explanation");
    string majorSupport = ExtractValueFromJSON(response, "major_support");
    string majorResistance = ExtractValueFromJSON(response, "major_resistance");
    string minorSupport = ExtractValueFromJSON(response, "minor_support");
    string minorResistance = ExtractValueFromJSON(response, "minor_resistance");

    // If valid data is received, update the signal
    if (vwap != "" && explanation != "") {
        string newSignal = "VWAP: " + vwap + "\nExplanation: " + explanation
                           + "\nMajor Support: " + majorSupport + "\nMajor Resistance: " + majorResistance
                           + "\nMinor Support: " + minorSupport + "\nMinor Resistance: " + minorResistance;

        // Confirm the signal and handle the response further
        if (newSignal != lastSignal) {
            signalConfirmationCount++; // Increment confirmation count
        }

        if (signalConfirmationCount >= confirmationInterval) {
            lastSignal = newSignal;  // Set the new signal
            signalConfirmationCount = 0;  // Reset the count
            Print("New VWAP signal: ", newSignal);
            Alert("New VWAP Signal Received:\n" + newSignal); // Alert user of the new signal
        }
    }
} else {
    Print("Error: WebRequest failed with code ", responseCode, ". Response headers: ", resultHeaders);
}
Handling the response correctly is critical for interpreting the server’s analysis. The ExtractValueFromJSON() function ensures that we only retrieve the data we need (VWAP and signal explanation) from the potentially large JSON response. If the response is invalid or the expected data isn’t found, it’s important to handle errors and avoid acting on incorrect signals.
Signal Confirmation and Displaying the Trading Signal
The final step involves confirming the trading signal. After receiving the signal from the Python server, we don’t immediately act on it. Instead, we require confirmation over multiple intervals (configured by confirmationInterval). This ensures that the signal is consistent over a set period, which helps avoid reacting to short-term market noise.
Once the signal is confirmed, we update the lastSignal variable and display the signal to the user via Alert(). The EA then waits for the next valid signal before triggering again.
// Confirm the signal multiple times before updating
if (newSignal != lastSignal)
{
    signalConfirmationCount++;  // Increment the confirmation count
}

// Once the signal has been confirmed enough times
if (signalConfirmationCount >= confirmationInterval)
{
    // Update the last signal and reset confirmation count
    lastSignal = newSignal;
    signalConfirmationCount = 0;  // Reset the count after confirmation

    // Display the new signal in the log and via an alert
    Print("New VWAP signal: ", newSignal);  // Print to the log
    Alert("New VWAP Signal Received:\n" + newSignal);  // Display alert to the user
}
Signal confirmation helps avoid acting on fleeting or unreliable signals. By confirming the signal multiple times, we increase the accuracy and reliability of the trade decisions. Alerts provide immediate feedback to the trader, ensuring they are aware of important changes.
2. Python
The script's flow is designed to preprocess data, calculate VWAP and relevant metrics, generate signals, and return meaningful information to the EA for decision-making. This includes determining the major and minor support/resistance levels, along with the VWAP and signal explanations. Let's follow the steps below:
Data Preparation & Preprocessing
The first part of the script ensures that the incoming data is clean and ready for analysis by performing several preprocessing steps. These steps ensure that all necessary columns have valid data and handle edge cases like missing or invalid values.
# Ensure critical columns have no missing values
df = df.dropna(subset=['volume', 'high', 'low', 'open', 'close'])

# Convert 'date' column to datetime
df.loc[:, 'date'] = pd.to_datetime(df['date'])

# Handle zero volume by replacing with NaN and dropping invalid rows
df.loc[:, 'volume'] = df['volume'].replace(0, np.nan)
df = df.dropna(subset=['volume'])

# Check if data exists after filtering
if df.empty:
    print("No data to calculate VWAP.")
    return pd.DataFrame()
The script ensures that the essential columns (volume, high, low, open, close) do not contain missing values using dropna(). It also handles zero volumes by replacing them with NaN and dropping any rows with invalid volumes. The date column is converted to a datetime format for time series analysis.
VWAP Calculation & Additional Metrics
The script calculates the VWAP (Volume Weighted Average Price) and additional metrics like typical price, average price, average volume, and support/resistance levels.
# Calculate VWAP and additional metrics
df.loc[:, 'typical_price'] = (df['high'] + df['low'] + df['close']) / 3
df.loc[:, 'vwap'] = (df['typical_price'] * df['volume']).cumsum() / df['volume'].cumsum()
df.loc[:, 'avg_price'] = df[['high', 'low', 'open', 'close']].mean(axis=1)
df.loc[:, 'avg_volume'] = df['volume'].rolling(window=2, min_periods=1).mean()
df.loc[:, 'major_support'] = df['low'].min()
df.loc[:, 'major_resistance'] = df['high'].max()
df.loc[:, 'minor_support'] = df['low'].rolling(window=3, min_periods=1).mean()
df.loc[:, 'minor_resistance'] = df['high'].rolling(window=3, min_periods=1).mean()
- VWAP Calculation: The VWAP is calculated as a cumulative sum of the typical price weighted by the volume, divided by the cumulative volume.
- Typical Price: The typical price is calculated as the average of high, low, and close for each period.
Support and Resistance
- Major Support: The lowest value in the low prices (over the entire period).
- Major Resistance: The highest value in the high prices.
- Minor Support/Resistance: Rolling averages of low and high prices over a window of 3 periods.
Signal Generation and Analysis
This part calculates the market's tendency and generates trading signals based on the VWAP's position relative to the closing price. It also provides explanations of these signals.
# Calculate strength and generate signals
df.loc[:, 'strength'] = np.where(
    (df['high'] - df['low']) != 0,
    np.abs(df['close'] - df['open']) / (df['high'] - df['low']) * 100,
    0
)

# Generate Buy/Sell signals based on VWAP
df.loc[:, 'signal'] = np.where(
    df['close'] > df['vwap'], 'BUY',
    np.where(df['close'] < df['vwap'], 'SELL', 'NEUTRAL')
)

# Signal explanation
df.loc[:, 'signal_explanation'] = np.where(
    df['signal'] == 'BUY',
    'The price is trading above the VWAP, indicating bullish market tendencies.',
    np.where(
        df['signal'] == 'SELL',
        'The price is trading below the VWAP, indicating bearish market tendencies.',
        'The price is trading at the VWAP, indicating equilibrium in the market.'
    )
)
Strength Calculation: This calculates the market strength using the difference between the close and open prices relative to the high and low range. A higher value indicates a stronger move.
Signal Generation
- BUY: When the close price is greater than the VWAP.
- SELL: When the close price is less than the VWAP.
- NEUTRAL: When the close price equals the VWAP.
- Signal Explanation: Based on the signal, a text explanation is generated indicating the market's tendencies (bullish, bearish, or neutral).
Final Response & Output
After all calculations are done, the script prepares the final output, which includes the VWAP, trading signal, explanation, and key support/resistance levels.
# Return data with major and minor support/resistance levels included
return df[['date', 'vwap', 'signal', 'signal_explanation', 'entry_point', 'major_support', 'major_resistance', 'minor_support', 'minor_resistance']].iloc[-1]
- Final Output: The script returns the most recent (last row) data, including the VWAP, trading signal, its explanation, entry point (which is set to VWAP), and the major and minor support/resistance levels. Support/Resistance levels are calculated to help further identify market tendencies. The response sent back to the EA includes these values, allowing it to visualize or take actions based on them.
Outcomes
I will provide responses from both ends: the MQL5 side and the Python side. Before doing that, let me emphasize the importance of ensuring that the Python script runs first. To learn more about creating and running the Python script, be sure to check out my previous article. To ensure smooth communication between MetaTrader 5 and the server, add the HTTP address to your MetaTrader 5 settings. Navigate to Tools > Options, enable Allow WebRequest, and input the server address in the provided field. Refer to the GIF below for guidance.
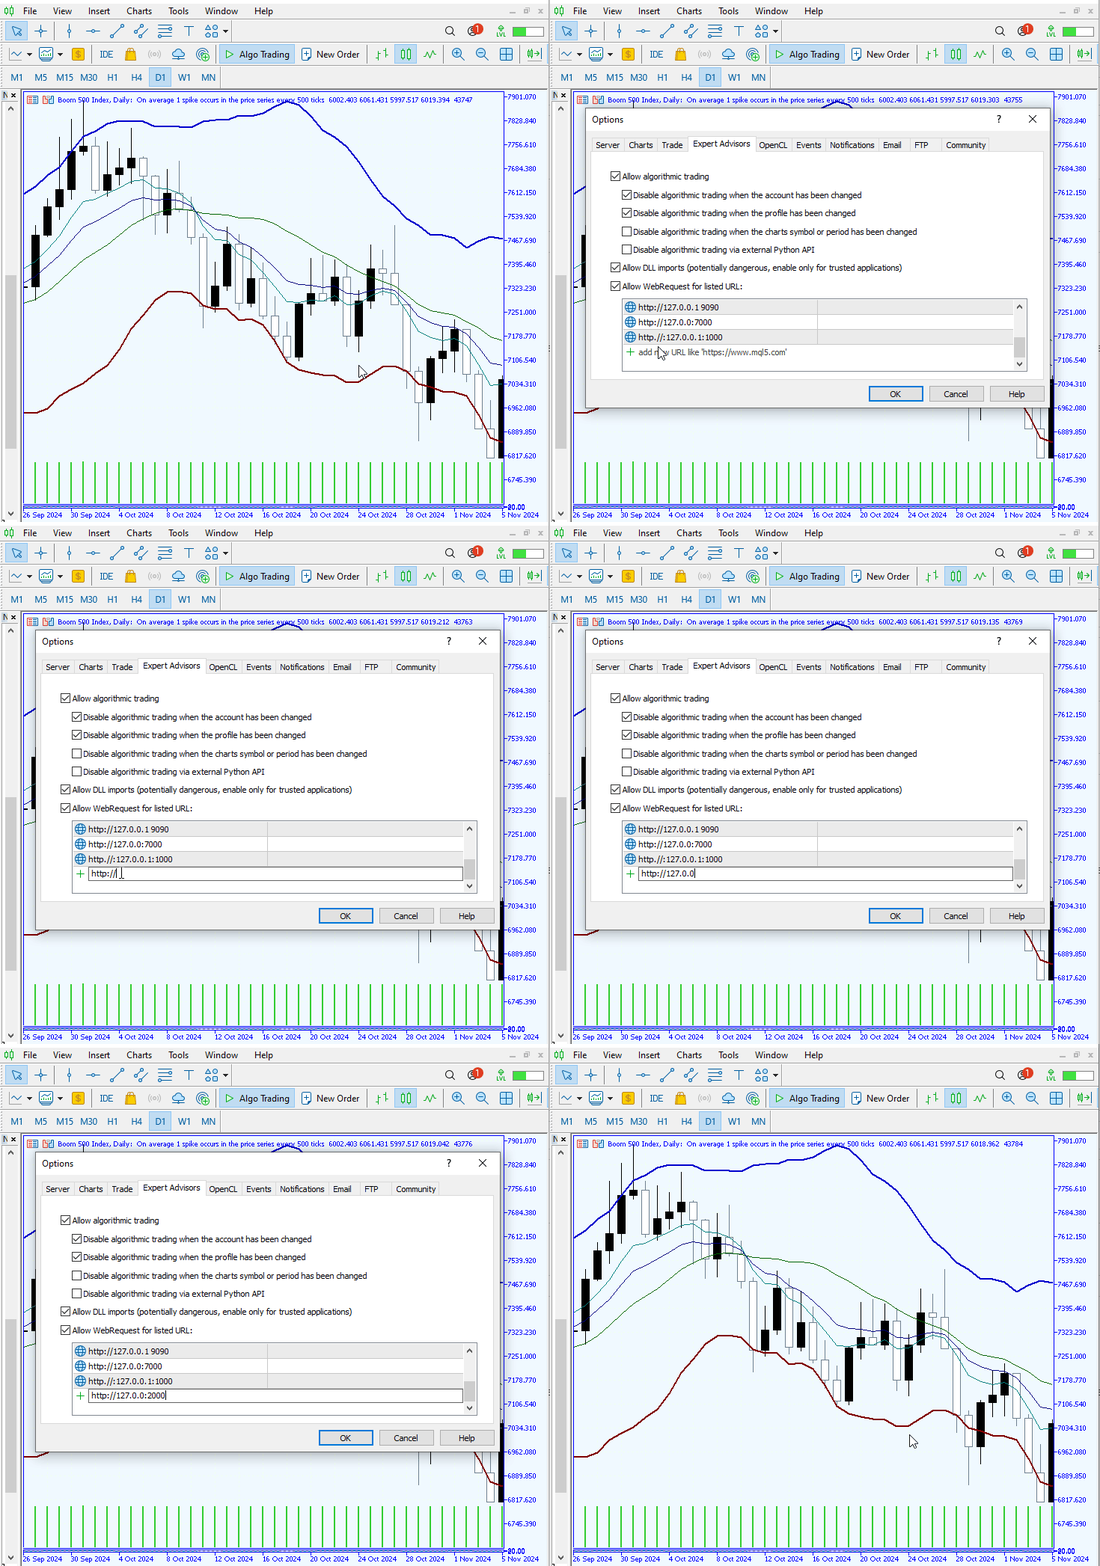
Fig 3. Webrequest Setting
Let's take a look at the responses from both Python and MQL5.
- Python Log in the Command Prompt
Received data: date,high,low,open,close,volume
2025.01.22 15:00,8372.10000,8365.60000,8368.90000,8367.80000,3600
2025.01.22 16:00,8369.00000,8356.60000,8367.90000,8356.80000,3600
2025.01.22 17:00,8359.00000,8347.800...
Calculating VWAP...
127.0.0.1 - - [28/Jan/2025 22:07:59] "POST /vwap HTTP/1.1" 200 -
The MQL5 EA successfully sent data for the last 150 candles, including the date, high, low, open, close, and volume. Python successfully received the data, as shown in the Command Prompt log above. While not all information is displayed due to the volume of data, we can still observe values for several candles.
- MetaTrader 5 Expert Advisor Log
2025.01.28 22:07:59.452 VWAP (Step Index,H1)    VWAP Expert initialized.
2025.01.28 22:07:59.513 VWAP (Step Index,H1)    CSV file created: MQL5\Files\Step Index_vwap_data.csv
2025.01.28 22:07:59.777 VWAP (Step Index,H1)    Server response: {
2025.01.28 22:07:59.777 VWAP (Step Index,H1)      "entry_point": 8356.202504986322,
2025.01.28 22:07:59.777 VWAP (Step Index,H1)      "major_resistance": 8404.5,
2025.01.28 22:07:59.777 VWAP (Step Index,H1)      "major_support": 8305.0,
2025.01.28 22:07:59.777 VWAP (Step Index,H1)      "minor_resistance": 8348.0,
2025.01.28 22:07:59.777 VWAP (Step Index,H1)      "minor_support": 8341.699999999999,
2025.01.28 22:07:59.777 VWAP (Step Index,H1)      "signal": "SELL",
2025.01.28 22:07:59.777 VWAP (Step Index,H1)      "signal_explanation": "The price is trading below the VWAP, indicating bearish market tendencies.",
2025.01.28 22:07:59.777 VWAP (Step Index,H1)      "vwap": 8356.202504986322
2025.01.28 22:07:59.777 VWAP (Step Index,H1)    }
The MQL5 EA successfully received the response from Python and logged it in the MetaTrader 5 Experts log. Let’s review the analysis response and see how it aligns with the MetaTrader 5 chart.
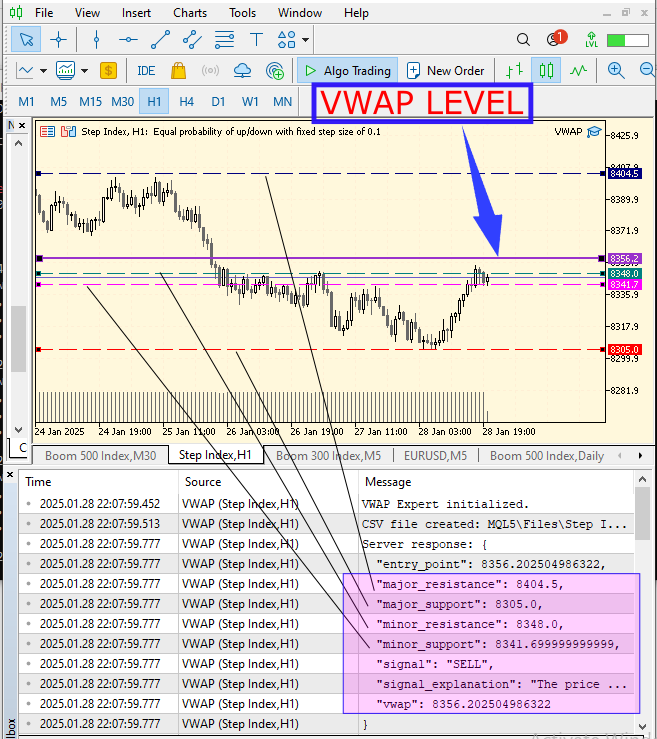
Fig 4. Signal Display
Lets review how the market responded after the signal was triggered, as illustrated in the diagram below.
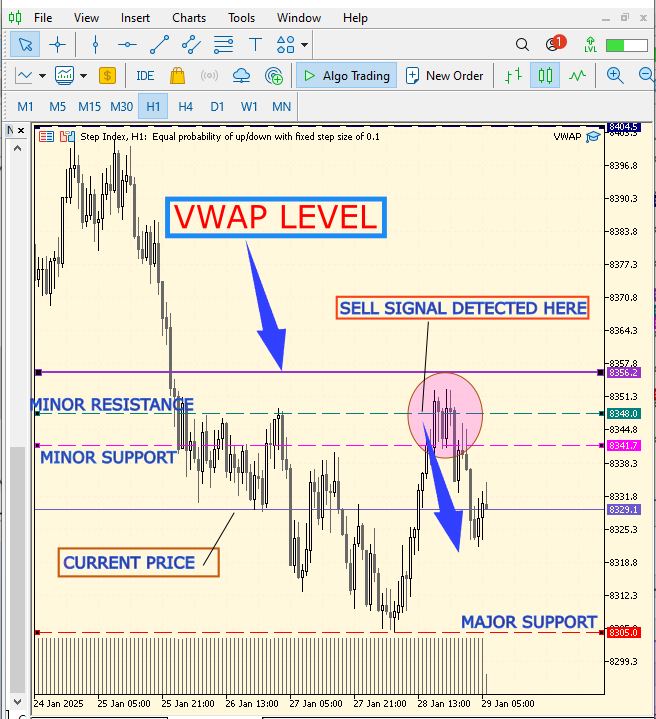
Fig 5. Market Response
Conclusion
Having successfully configured the VWAP system, it is crucial to monitor market direction and use VWAP levels for confirmation. The VWAP level is highly respected by the market, often acting as a key support or resistance zone. Additionally, selecting the right timeframe to suit your trading strategy is essential. Shorter timeframes like M1-M15 capture intraday movements, M30 balances precision with a broader perspective, H1-H4 reveal multi-day trends, and daily/weekly charts provide insights into long-term market dynamics. Tailoring your approach to the appropriate timeframe ensures better alignment with your trading goals.
| Date | Tool Name | Description | Version | Updates | Notes |
|---|---|---|---|---|---|
| 01/10/24 | Chart Projector | Script to overlay the previous day's price action with ghost effect. | 1.0 | Initial Release | First tool in Lynnchris Tool Chest |
| 18/11/24 | Analytical Comment | It provides previous day's information in a tabular format, as well as anticipates the future direction of the market. | 1.0 | Initial Release | Second tool in the Lynnchris Tool Chest |
| 27/11/24 | Analytics Master | Regular Update of market metrics after every two hours | 1.01 | Second Release | Third tool in the Lynnchris Tool Chest |
| 02/12/24 | Analytics Forecaster | Regular Update of market metrics after every two hours with telegram integration | 1.1 | Third Edition | Tool number 4 |
| 09/12/24 | Volatility Navigator | The EA analyzes market conditions using the Bollinger Bands, RSI and ATR indicators | 1.0 | Initial Release | Tool Number 5 |
| 19/12/24 | Mean Reversion Signal Reaper | Analyzes market using mean reversion strategy and provides signal | 1.0 | Initial Release | Tool number 6 |
| 9/01/2025 | Signal Pulse | Multiple timeframe analyzer | 1.0 | Initial Release | Tool number 7 |
| 17/01/2025 | Metrics Board | Panel with button for analysis | 1.0 | Initial Release | Tool number 8 |
| 21/01/2025 | External Flow | Analytics through external libraries | 1.0 | Initial Release | Tool number 9 |
| 27/01/2025 | VWAP | Volume Weighted Average Price | 1.3 | Initial Release | Tool number 10 |
Warning: All rights to these materials are reserved by MetaQuotes Ltd. Copying or reprinting of these materials in whole or in part is prohibited.
This article was written by a user of the site and reflects their personal views. MetaQuotes Ltd is not responsible for the accuracy of the information presented, nor for any consequences resulting from the use of the solutions, strategies or recommendations described.
 Data Science and ML (Part 33): Pandas Dataframe in MQL5, Data Collection for ML Usage made easier
 Developing a multi-currency Expert Advisor (Part 16): Impact of different quote histories on test results
 MQL5 Wizard Techniques you should know (Part 53): Market Facilitation Index
 Automating Trading Strategies in MQL5 (Part 4): Building a Multi-Level Zone Recovery System
- Free trading apps
- Over 8,000 signals for copying
- Economic news for exploring financial markets
You agree to website policy and terms of use
You showed that this code works in backtesting but i get this error HTTP Code: -1 | Error: 4014 . according to docs its "Function is not allowed for call"
Can we backtest(optimise) the "WebRequest enabled EA" on MetaTrader with cloud agents?
Thanks for the article.
Can we backtest(optimise) the "WebRequest enabled EA" on MetaTrader with cloud agents?
According to my findings:
- Using WebRequest() on Cloud Agents (remote MQL5.com network) is not allowed
- Unlike MetaTrader Cloud Agents (which block external communication), LAN agents are allowed