Price Action Analysis Toolkit Development (Part 8): Metrics Board
Contents
- Introduction
- System Overview
- MQL5 Code
- Code Breakdown and Implementation
- Including Libraries
- Outcomes
- Conclusion
Introduction
In the early stages of our series, we released an article titled "Analytics Master," which explored methods for retrieving and visualizing the previous day's market metrics. This foundational work set the stage for the development of more sophisticated tools. We are excited to introduce the Metrics Board EA, an innovative and premium-quality solution that revolutionizes market analysis within MetaTrader 5. This tool functions as a seamlessly integrated application, offering a streamlined and simple interface equipped with dedicated buttons for advanced analyses, including:
- High/Low Analysis: Effortlessly detect critical price levels to assess market trends and identify potential reversals.
- Volume Analysis: Analyze trading volumes to gauge market engagement and liquidity conditions.
- Trend Analysis: Evaluate directional strength and sustainability through precise metrics.
- Volatility Analysis: Quantify market fluctuations to formulate strategies tailored to varying trading environments.
- Moving Average Analysis: Monitor dynamic price trends for a clearer understanding of market behavior.
- Support/Resistance Analysis: Identify pivotal price levels to optimize entries, exits, and risk management strategies.
Each button offers live data delivery with a simple click, transforming complex market data into actionable insights instantly. The Metrics Board EA is powered by advanced algorithms, ensuring high-speed and accurate computations that cater to the needs of professional traders. By utilizing this tool, traders can transform intricate market data into straightforward and actionable insights. This EA serves as a key resource for those aiming to refine their trading strategies.
System Overview
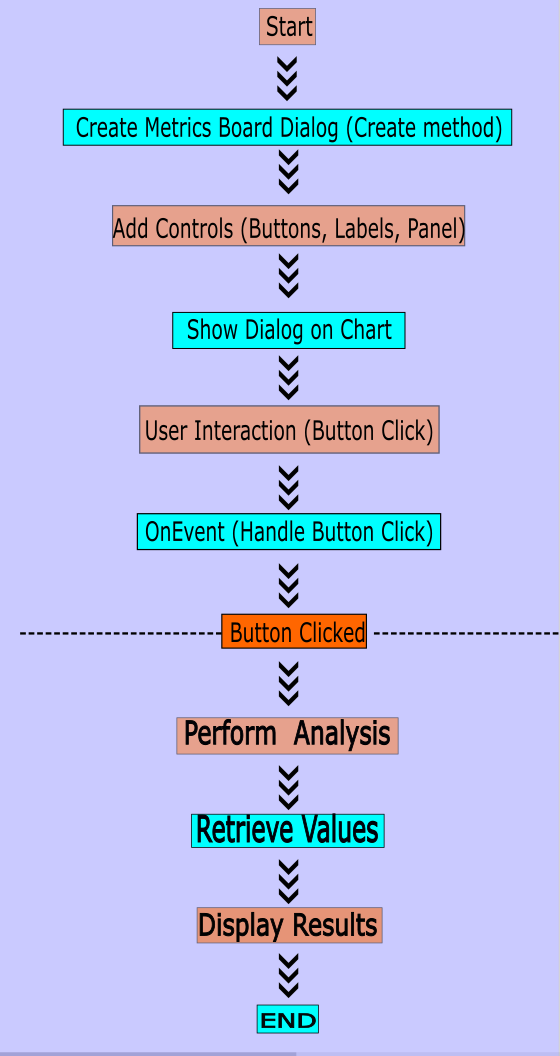
In this section, I will provide a brief overview of the system logic. A detailed explanation of the steps is in the Code Breakdown and Implementation section. Let’s go through the steps below:
- Class Setup: The class creates a dialog with buttons for different analyses.
- Event Handling: Button clicks trigger respective analysis methods.
- Analysis and Display: Market data is processed and displayed in the panel.
- Closing: A "Close" button allows the user to close the metrics board.

Fig 1. EA Logic Summary
MQL5 Code
//+------------------------------------------------------------------+
//|                                                Metrics Board.mql5|
//|                                Copyright 2025, Christian Benjamin|
//|                                              https://www.mql5.com|
//+------------------------------------------------------------------+
#property copyright "2025, MetaQuotes Software Corp."
#property link      "https://www.mql5.com/en/users/lynnchris"
#property version   "1.0"
#property strict

#include <Trade\Trade.mqh>
#include <Controls\Dialog.mqh>
#include <Controls\Button.mqh>
#include <Controls\Label.mqh>
#include <Controls\Panel.mqh>

// Metrics Board Class
class CMetricsBoard : public CAppDialog
  {
private:
   CButton           m_btnClose; // Close Button
   CButton           m_btnHighLowAnalysis;
   CButton           m_btnVolumeAnalysis;
   CButton           m_btnTrendAnalysis;
   CButton           m_btnVolatilityAnalysis;
   CButton           m_btnMovingAverage;
   CButton           m_btnSupportResistance;
   CPanel            m_panelResults;
   CLabel            m_lblResults;

public:
                     CMetricsBoard(void);
                    ~CMetricsBoard(void);
   virtual bool      Create(const long chart, const string name, const int subwin, const int x1, const int y1, const int x2, const int y2);
   virtual void      Minimize();
   virtual bool      Run(); // Declaration of Run method
   virtual bool      OnEvent(const int id, const long &lparam, const double &dparam, const string &sparam);
   virtual bool      ChartEvent(const int id, const long &lparam, const double &dparam, const string &sparam);
   virtual void      Destroy(const int reason = REASON_PROGRAM); // Override Destroy method

private:
   bool              CreateButtons(void);
   bool              CreateResultsPanel(void);
   void              OnClickButtonClose(); // New close button handler
   void              PerformHighLowAnalysis(void);
   void              PerformVolumeAnalysis(void);
   void              PerformTrendAnalysis(void);
   void              PerformVolatilityAnalysis(void);
   void              PerformMovingAverageAnalysis(void);
   void              PerformSupportResistanceAnalysis(void);
   double            CalculateMovingAverage(int period);
  };

CMetricsBoard::CMetricsBoard(void) {}

CMetricsBoard::~CMetricsBoard(void) {}

// Override Destroy method
void CMetricsBoard::Destroy(const int reason)
  {
// Call base class Destroy method to release resources
   CAppDialog::Destroy(reason);
  }

//+------------------------------------------------------------------+
//| Create a control dialog                                          |
//+------------------------------------------------------------------+
bool CMetricsBoard::Create(const long chart, const string name, const int subwin, const int x1, const int y1, const int x2, const int y2)
  {
   if(!CAppDialog::Create(chart, name, subwin, x1, y1, x2, y2))
     {
      Print("Failed to create CAppDialog instance.");
      return false; // Failed to create the dialog
     }

   if(!CreateResultsPanel())
     {
      Print("Failed to create results panel.");
      return false; // Failed to create the results panel
     }

   if(!CreateButtons())
     {
      Print("Failed to create buttons.");
      return false; // Failed to create buttons
     }

   Show(); // Show the dialog after creation
   return true; // Successfully created the dialog
  }

//+------------------------------------------------------------------+
//| Minimize the control window                                      |
//+------------------------------------------------------------------+
void CMetricsBoard::Minimize()
  {
   CAppDialog::Minimize();
  }

//+------------------------------------------------------------------+
//| Run the control.                                                 |
//+------------------------------------------------------------------+
bool CMetricsBoard::Run()
  {
// Assuming Run makes the dialog functional
   if(!Show())
     {
      Print("Failed to show the control.");
      return false; // Could not show the control
     }
// Additional initialization or starting logic can be added here
   return true; // Successfully run the control
  }

//+------------------------------------------------------------------+
//| Create the results panel                                         |
//+------------------------------------------------------------------+
bool CMetricsBoard::CreateResultsPanel(void)
  {
   if(!m_panelResults.Create(0, "ResultsPanel", 0, 10, 10, 330, 60))
      return false;

   m_panelResults.Color(clrLightGray);
   Add(m_panelResults);

   if(!m_lblResults.Create(0, "ResultsLabel", 0, 15, 15, 315, 30))
      return false;

   m_lblResults.Text("Results will be displayed here.");
   m_lblResults.Color(clrBlack);
   m_lblResults.FontSize(12);
   Add(m_lblResults);

   return true;
  }

//+------------------------------------------------------------------+
//| Create buttons for the panel                                     |
//+------------------------------------------------------------------+
bool CMetricsBoard::CreateButtons(void)
  {
   int x = 20;
   int y = 80;
   int buttonWidth = 300;
   int buttonHeight = 30;
   int spacing = 15;

// Create Close Button
   if(!m_btnClose.Create(0, "CloseButton", 0, x, y, x + buttonWidth, y + buttonHeight))
      return false;

   m_btnClose.Text("Close Panel");
   Add(m_btnClose);
   y += buttonHeight + spacing;

   struct ButtonData
     {
      CButton        *button;
      string         name;
      string         text;
     };

   ButtonData buttons[] =
     {
        {&m_btnHighLowAnalysis, "HighLowButton", "High/Low Analysis"},
        {&m_btnVolumeAnalysis, "VolumeButton", "Volume Analysis"},
        {&m_btnTrendAnalysis, "TrendButton", "Trend Analysis"},
        {&m_btnVolatilityAnalysis, "VolatilityButton", "Volatility Analysis"},
        {&m_btnMovingAverage, "MovingAverageButton", "Moving Average"},
        {&m_btnSupportResistance, "SupportResistanceButton", "Support/Resistance"}
     };

   for(int i = 0; i < ArraySize(buttons); i++)
     {
      if(!buttons[i].button.Create(0, buttons[i].name, 0, x, y, x + buttonWidth, y + buttonHeight))
         return false;

      buttons[i].button.Text(buttons[i].text);
      Add(buttons[i].button);
      y += buttonHeight + spacing;
     }

   return true;
  }

//+------------------------------------------------------------------+
//| Handle events for button clicks                                  |
//+------------------------------------------------------------------+
bool CMetricsBoard::OnEvent(const int id, const long &lparam, const double &dparam, const string &sparam)
  {
   if(id == CHARTEVENT_OBJECT_CLICK)
     {
      Print("Event ID: ", id, ", Event parameter (sparam): ", sparam);

      if(sparam == "CloseButton") // Handle close button click
        {
         OnClickButtonClose(); // Call to new close button handler
         return true; // Event processed
        }
      else
         if(sparam == "HighLowButton")
           {
            Print("High/Low Analysis Button Clicked");
            m_lblResults.Text("Performing High/Low Analysis...");
            PerformHighLowAnalysis();
            return true; // Event processed
           }
         else
            if(sparam == "VolumeButton")
              {
               Print("Volume Analysis Button Clicked");
               m_lblResults.Text("Performing Volume Analysis...");
               PerformVolumeAnalysis();
               return true; // Event processed
              }
            else
               if(sparam == "TrendButton")
                 {
                  Print("Trend Analysis Button Clicked");
                  m_lblResults.Text("Performing Trend Analysis...");
                  PerformTrendAnalysis();
                  return true; // Event processed
                 }
               else
                  if(sparam == "VolatilityButton")
                    {
                     Print("Volatility Analysis Button Clicked");
                     m_lblResults.Text("Performing Volatility Analysis...");
                     PerformVolatilityAnalysis();
                     return true; // Event processed
                    }
                  else
                     if(sparam == "MovingAverageButton")
                       {
                        Print("Moving Average Analysis Button Clicked");
                        m_lblResults.Text("Calculating Moving Average...");
                        PerformMovingAverageAnalysis();
                        return true; // Event processed
                       }
                     else
                        if(sparam == "SupportResistanceButton")
                          {
                           Print("Support/Resistance Analysis Button Clicked");
                           m_lblResults.Text("Calculating Support/Resistance...");
                           PerformSupportResistanceAnalysis();
                           return true; // Event processed
                          }
     }

   return false; // If we reach here, the event was not processed
  }

//+------------------------------------------------------------------+
//| Handle chart events                                              |
//+------------------------------------------------------------------+
bool CMetricsBoard::ChartEvent(const int id, const long &lparam, const double &dparam, const string &sparam)
  {
   Print("ChartEvent ID: ", id, ", lparam: ", lparam, ", dparam: ", dparam, ", sparam: ", sparam);

   if(id == CHARTEVENT_OBJECT_CLICK)
     {
      return OnEvent(id, lparam, dparam, sparam);
     }

   return false;
  }

//+------------------------------------------------------------------+
//| Analysis operations                                              |
//+------------------------------------------------------------------+
void CMetricsBoard::PerformHighLowAnalysis(void)
  {
   double high = iHigh(Symbol(), PERIOD_H1, 0);
   double low = iLow(Symbol(), PERIOD_H1, 0);

   Print("Retrieved High: ", high, ", Low: ", low);

   if(high == 0 || low == 0)
     {
      m_lblResults.Text("Failed to retrieve high/low values.");
      return;
     }

   string result = StringFormat("High: %.5f, Low: %.5f", high, low);
   m_lblResults.Text(result);
  }

//+------------------------------------------------------------------+
//|                                                                  |
//+------------------------------------------------------------------+
void CMetricsBoard::PerformVolumeAnalysis(void)
  {
   double volume = iVolume(Symbol(), PERIOD_H1, 0);
   Print("Retrieved Volume: ", volume);

   if(volume < 0)
     {
      m_lblResults.Text("Failed to retrieve volume.");
      return;
     }

   string result = StringFormat("Volume (Last Hour): %.1f", volume);
   m_lblResults.Text(result);
  }

//+------------------------------------------------------------------+
//|                                                                  |
//+------------------------------------------------------------------+
void CMetricsBoard::PerformTrendAnalysis(void)
  {
   double ma = CalculateMovingAverage(14);
   Print("Calculated 14-period MA: ", ma);

   if(ma <= 0)
     {
      m_lblResults.Text("Not enough data for moving average calculation.");
      return;
     }

   string result = StringFormat("14-period MA: %.5f", ma);
   m_lblResults.Text(result);
  }

//+------------------------------------------------------------------+
//|                                                                  |
//+------------------------------------------------------------------+
void CMetricsBoard::PerformVolatilityAnalysis(void)
  {
   int atr_period = 14;
   int atr_handle = iATR(Symbol(), PERIOD_H1, atr_period);

   if(atr_handle == INVALID_HANDLE)
     {
      m_lblResults.Text("Failed to get ATR handle.");
      return;
     }

   double atr_value[];
   if(CopyBuffer(atr_handle, 0, 0, 1, atr_value) < 0)
     {
      m_lblResults.Text("Failed to copy ATR value.");
      IndicatorRelease(atr_handle);
      return;
     }

   string result = StringFormat("ATR (14): %.5f", atr_value[0]);
   m_lblResults.Text(result);
   IndicatorRelease(atr_handle);
  }

//+------------------------------------------------------------------+
//|                                                                  |
//+------------------------------------------------------------------+
void CMetricsBoard::PerformMovingAverageAnalysis(void)
  {
   double ma = CalculateMovingAverage(50);
   Print("Calculated 50-period MA: ", ma);

   if(ma <= 0)
     {
      m_lblResults.Text("Not enough data for moving average calculation.");
      return;
     }

   string result = StringFormat("50-period MA: %.5f", ma);
   m_lblResults.Text(result);
  }

//+------------------------------------------------------------------+
//|                                                                  |
//+------------------------------------------------------------------+
void CMetricsBoard::PerformSupportResistanceAnalysis(void)
  {
   double support = iLow(Symbol(), PERIOD_H1, 1);
   double resistance = iHigh(Symbol(), PERIOD_H1, 1);
   Print("Retrieved Support: ", support, ", Resistance: ", resistance);

   if(support == 0 || resistance == 0)
     {
      m_lblResults.Text("Failed to retrieve support/resistance levels.");
      return;
     }

   string result = StringFormat("Support: %.5f, Resistance: %.5f", support, resistance);
   m_lblResults.Text(result);
  }

//+------------------------------------------------------------------+
//| Calculate moving average                                         |
//+------------------------------------------------------------------+
double CMetricsBoard::CalculateMovingAverage(int period)
  {
   if(period <= 0)
      return 0;

   double sum = 0.0;
   int bars = Bars(Symbol(), PERIOD_H1);

   if(bars < period)
     {
      return 0;
     }

   for(int i = 0; i < period; i++)
     {
      sum += iClose(Symbol(), PERIOD_H1, i);
     }
   return sum / period;
  }

// Implementation of OnClickButtonClose
void CMetricsBoard::OnClickButtonClose()
  {
   Print("Close button clicked. Closing the Metrics Board...");
   Destroy();  // This method destroys the panel
  }

CMetricsBoard ExtDialog;

//+------------------------------------------------------------------+
//| Initialize the application                                       |
//+------------------------------------------------------------------+
int OnInit()
  {
   if(!ExtDialog.Create(0, "Metrics Board", 0, 10, 10, 350, 500))
     {
      Print("Failed to create Metrics Board.");
      return INIT_FAILED;
     }

   if(!ExtDialog.Run()) // Call Run to make the dialog functional
     {
      Print("Failed to run Metrics Board.");
      return INIT_FAILED; // Call to Run failed
     }

   return INIT_SUCCEEDED;
  }

//+------------------------------------------------------------------+
//| Deinitialize the application                                     |
//+------------------------------------------------------------------+
void OnDeinit(const int reason)
  {
   ExtDialog.Destroy(reason); // Properly call Destroy method
  }

//+------------------------------------------------------------------+
//| Handle chart events                                              |
//+------------------------------------------------------------------+
void OnChartEvent(const int id, const long &lparam, const double &dparam, const string &sparam)
  {
   ExtDialog.ChartEvent(id, lparam, dparam, sparam);
  }
//+------------------------------------------------------------------+
//+------------------------------------------------------------------+
Code Breakdown and Implementation
- Header and Metadata
//+------------------------------------------------------------------+
//|                                                Metrics Board.mql5|
//|                                Copyright 2025, Christian Benjamin|
//|                                              https://www.mql5.com|
//+------------------------------------------------------------------+
#property copyright "2025, MetaQuotes Software Corp."
#property link      "https://www.mql5.com/en/users/lynnchris"
#property version   "1.0"
#property strict
The comment block delineates the purpose of the script and gives credits, which is essential for identifying authorship and ensuring proper attribution for future users. The #property directives serve to define various characteristics of the script, such as copyright information, a link to the author or documentation, the version number, and setting the strict mode, which helps catch potential issues during compilation.
- Including Necessary Libraries
Next, we include libraries necessary for our application. These libraries provide pre-defined functionalities that simplify coding.
#include <Trade\Trade.mqh>
#include <Controls\Dialog.mqh>
#include <Controls\Button.mqh>
#include <Controls\Label.mqh>
#include <Controls\Panel.mqh>
Here, we incorporate the libraries related to trade operations and user interface controls. For instance, Trade.mqh is vital for executing trade functions, while Dialog.mqh, Button.mqh, Label.mqh, and Panel.mqh are used to create and manage the user interface components of the Metrics Board.
- Class Definition
class CMetricsBoard : public CAppDialog
{
private:
   CButton           m_btnClose;
   CButton           m_btnHighLowAnalysis;
   CButton           m_btnVolumeAnalysis;
   CButton           m_btnTrendAnalysis;
   CButton           m_btnVolatilityAnalysis;
   CButton           m_btnMovingAverage;
   CButton           m_btnSupportResistance;
   CPanel            m_panelResults;
   CLabel            m_lblResults;
The class also includes a constructor and a destructor.
public:
                     CMetricsBoard(void);
                    ~CMetricsBoard(void);

CMetricsBoard::CMetricsBoard(void) {}

CMetricsBoard::~CMetricsBoard(void) {}
The constructor initializes the class, and the destructor is defined (though empty in this case) to ensure any necessary cleanup occurs when an instance of CMetricsBoard is destroyed. This is essential for managing resources efficiently.
- Creating the Dialog
The Create method is responsible for constructing the entire control dialog. In this method, we first attempt to create the dialog through the base class (CAppDialog::Create). If it fails, we log an error and return false. Next, we create a results panel and buttons, again checking for potential failures. Finally, if all steps are successful, we display the dialog and return true.
bool CMetricsBoard::Create(const long chart, const string name, const int subwin, const int x1, const int y1, const int x2, const int y2)
{
   if(!CAppDialog::Create(chart, name, subwin, x1, y1, x2, y2))
   {
      Print("Failed to create CAppDialog instance.");
      return false;
   }

   if(!CreateResultsPanel())
   {
      Print("Failed to create results panel.");
      return false;
   }

   if(!CreateButtons())
   {
      Print("Failed to create buttons.");
      return false;
   }

   Show();
   return true;
}
Now, the Run dialog appears. The Run method is essential for making the dialog functional.
bool CMetricsBoard::Run()
{
   if(!Show())
   {
      Print("Failed to show the control.");
      return false;
   }
   return true;
}
Here, we display the dialog using the Show method. If displaying the dialog fails, an error message is printed, returning false.
- Creating the Results Panel
The CreateResultsPanel method constructs the panel where analysis results will be displayed. Initially, we create the results panel and set its properties, such as color and dimensions. Subsequently, we add this panel to the dialog. We also create a label within the panel to display results and customize its appearance before adding it to the panel. This method returns true upon successful creation.
bool CMetricsBoard::CreateResultsPanel(void)
{
   if(!m_panelResults.Create(0, "ResultsPanel", 0, 10, 10, 330, 60))
      return false;

   m_panelResults.Color(clrLightGray);
   Add(m_panelResults);

   if(!m_lblResults.Create(0, "ResultsLabel", 0, 15, 15, 315, 30))
      return false;

   m_lblResults.Text("Results will be displayed here.");
   m_lblResults.Color(clrBlack);
   m_lblResults.FontSize(12);
   Add(m_lblResults);

   return true;
}
- Creating Buttons
The CreateButtons method is responsible for initializing the interactive buttons in the dialog.
bool CMetricsBoard::CreateButtons(void)
{
   int x = 20;
   int y = 80;
   int buttonWidth = 300;
   int buttonHeight = 30;
   int spacing = 15;

   if(!m_btnClose.Create(0, "CloseButton", 0, x, y, x + buttonWidth, y + buttonHeight))
      return false;

   m_btnClose.Text("Close Panel");
   Add(m_btnClose);
   y += buttonHeight + spacing;

   struct ButtonData
   {
      CButton        *button;
      string         name;
      string         text;
   };

   ButtonData buttons[] =
   {
      {&m_btnHighLowAnalysis, "HighLowButton", "High/Low Analysis"},
      {&m_btnVolumeAnalysis, "VolumeButton", "Volume Analysis"},
      {&m_btnTrendAnalysis, "TrendButton", "Trend Analysis"},
      {&m_btnVolatilityAnalysis, "VolatilityButton", "Volatility Analysis"},
      {&m_btnMovingAverage, "MovingAverageButton", "Moving Average"},
      {&m_btnSupportResistance, "SupportResistanceButton", "Support/Resistance"}
   };

   for(int i = 0; i < ArraySize(buttons); i++)
   {
      if(!buttons[i].button.Create(0, buttons[i].name, 0, x, y, x + buttonWidth, y + buttonHeight))
         return false;

      buttons[i].button.Text(buttons[i].text);
      Add(buttons[i].button);
      y += buttonHeight + spacing;
   }

   return true;
}
In this implementation, we define initial coordinates, dimensions, and spacing for our buttons. We create each button, first for closing the panel, adding it to the dialog. We then use an array of ButtonData structures, which allows us to effectively loop through the button definitions. Each button is set with corresponding text and added to the dialog. The method concludes by returning true if all buttons are successfully created.
- Handling Events
1. Button Clicks
The OnEvent method processes events generated by user interaction, such as button clicks.
bool CMetricsBoard::OnEvent(const int id, const long &lparam, const double &dparam, const string &sparam)
{
   if(id == CHARTEVENT_OBJECT_CLICK)
   {
      Print("Event ID: ", id, ", Event parameter (sparam): ", sparam);

      if(sparam == "CloseButton")
      {
         OnClickButtonClose();
         return true;
      }
      // ... Handling for other button clicks
   }

   return false;
}
When an event occurs, we first check if it is a button click event. We print the event details for debugging purposes and react to specific button clicks by calling the corresponding handling functions. If the button clicked is the close button, we invoke the OnClickButtonClose() method.
2. Chart Events
The ChartEvent method serves a similar purpose but focuses specifically on chart-related events.
bool CMetricsBoard::ChartEvent(const int id, const long &lparam, const double &dparam, const string &sparam)
{
   Print("ChartEvent ID: ", id, ", lparam: ", lparam, ", dparam: ", dparam, ", sparam: ", sparam);

   if(id == CHARTEVENT_OBJECT_CLICK)
   {
      return OnEvent(id, lparam, dparam, sparam);
   }

   return false;
}
This method captures any clicks on chart objects and passes the event to the OnEvent method for further processing.
- Analysis Operations
The following methods implement the various market analysis types that our Metrics Board can perform. For instance, the PerformHighLowAnalysis retrieves the high and low prices for a defined period:
void CMetricsBoard::PerformHighLowAnalysis(void)
{
   double high = iHigh(Symbol(), PERIOD_H1, 0);
   double low = iLow(Symbol(), PERIOD_H1, 0);

   Print("Retrieved High: ", high, ", Low: ", low);

   if(high == 0 || low == 0)
   {
      m_lblResults.Text("Failed to retrieve high/low values.");
      return;
   }

   string result = StringFormat("High: %.5f, Low: %.5f", high, low);
   m_lblResults.Text(result);
}
In this method, we use built-in functions to retrieve the highest and lowest prices for the last hour. If successful, the results are displayed on the label. If not, an error message is shown.
Similar logic is applied to other analysis functions, such as PerformVolumeAnalysis, PerformTrendAnalysis, PerformVolatilityAnalysis, PerformMovingAverageAnalysis, and PerformSupportResistanceAnalysis. Each method retrieves data specific to its analysis type and updates the user interface accordingly.
- Calculate Moving Average
One of the utility methods included is CalculateMovingAverage, which computes the moving average over a specified period. This method sums the closing prices over the specified period and divides by that number to determine the average. It checks for valid input and sufficient data before performing the calculation.
double CMetricsBoard::CalculateMovingAverage(int period)
{
   if(period <= 0)
      return 0;

   double sum = 0.0;
   int bars = Bars(Symbol(), PERIOD_H1);

   if(bars < period)
   {
      return 0;
   }

   for(int i = 0; i < period; i++)
   {
      sum += iClose(Symbol(), PERIOD_H1, i);
   }
   return sum / period;
}
- Global Instance and Initialization
An instance of the CMetricsBoard class is created globally, followed by the initialization and deinitialization processes for the application.
CMetricsBoard ExtDialog;

int OnInit()
{
   if(!ExtDialog.Create(0, "Metrics Board", 0, 10, 10, 350, 500))
   {
      Print("Failed to create Metrics Board.");
      return INIT_FAILED;
   }

   if(!ExtDialog.Run())
   {
      Print("Failed to run Metrics Board.");
      return INIT_FAILED;
   }

   return INIT_SUCCEEDED;
}
In the OnInit function, we initialize the Metrics Board by calling the Create method. If successful, we proceed to run it. Errors are logged accordingly, with the function indicating success or failure.
The deinitialization process ensures that resources are released correctly when the EA is removed.
void OnDeinit(const int reason)
{
   ExtDialog.Destroy(reason); // Properly call Destroy method
}
- Chart Event Handling
Finally, we define the OnChartEvent function to manage chart-related events. This integrates user interactions directly into the application’s functionality. This method captures chart events and passes them to the ChartEvent method of our CMetricsBoard instance.
void OnChartEvent(const int id, const long &lparam, const double &dparam, const string &sparam)
{
   ExtDialog.ChartEvent(id, lparam, dparam, sparam);
}
Including Libraries
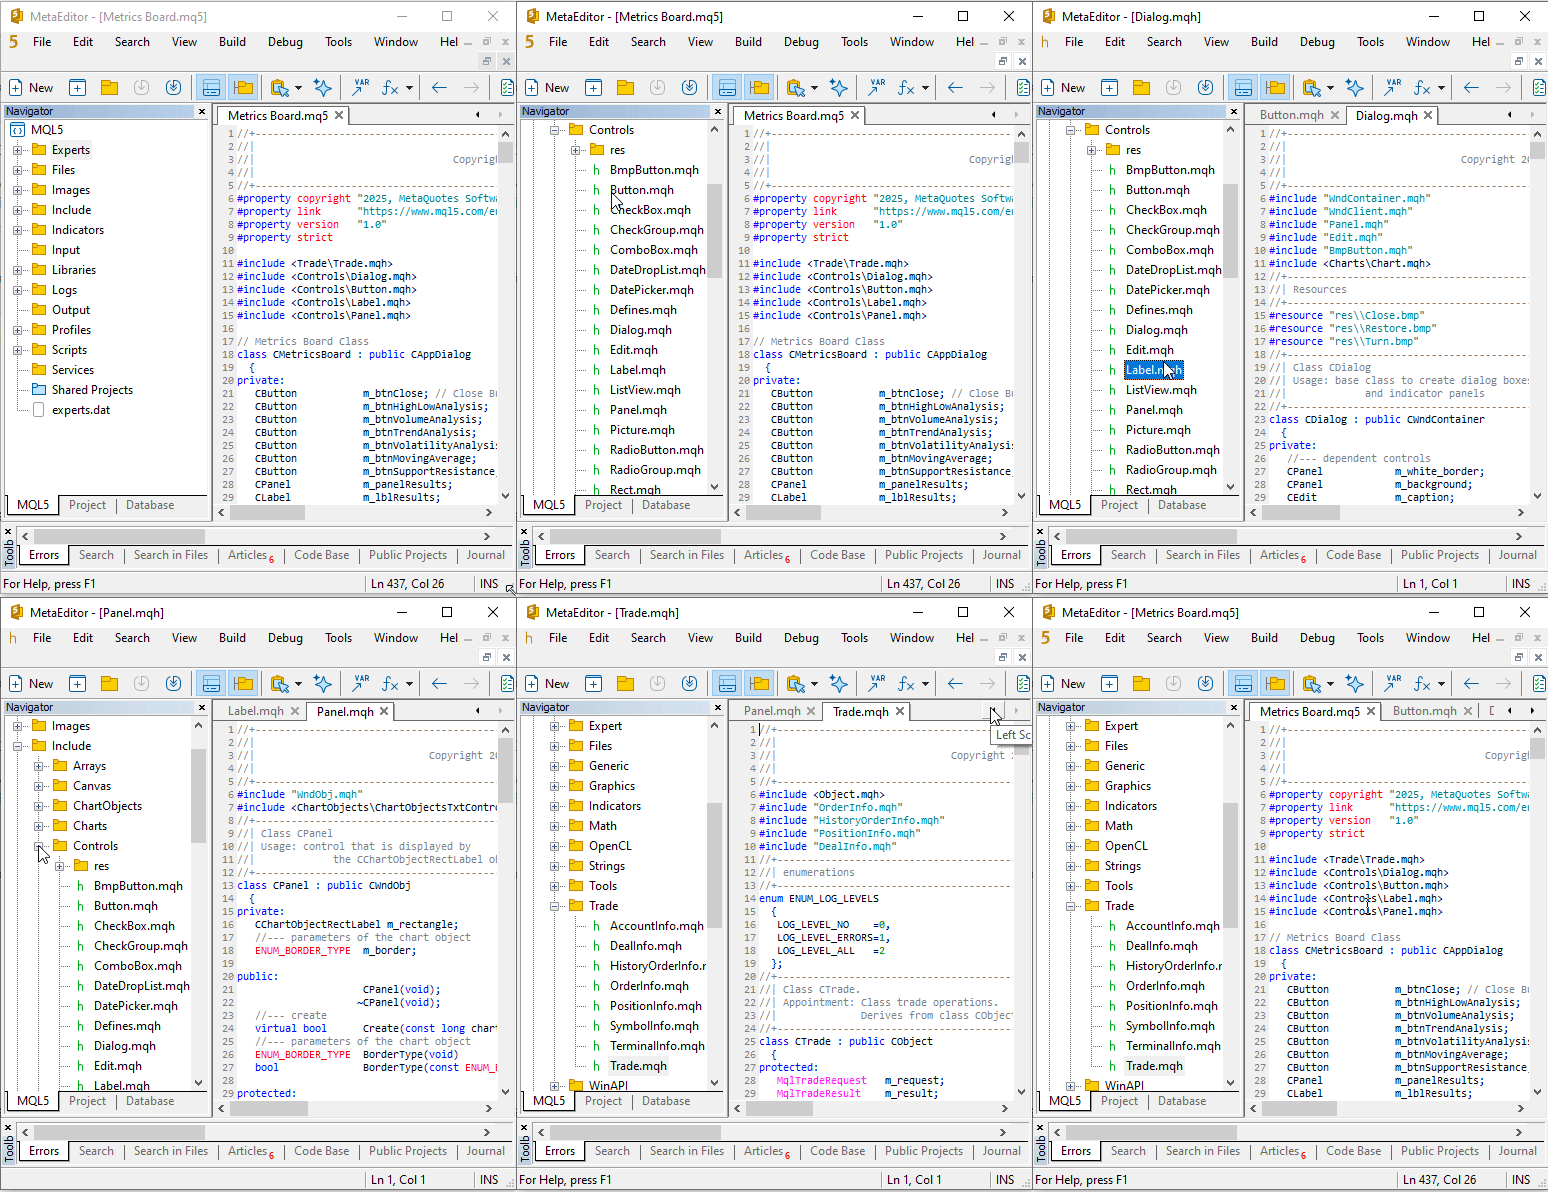
If you compile your code without including the libraries mentioned in the previous section, you may encounter errors. To resolve this, open MetaEditor and navigate to the Navigator panel. Scroll down to the 'Include' section, where you can access the required libraries. Open the necessary subfolders, select the relevant files, and compile them individually. Ensure the libraries are properly referenced in your code by using the #include directive at the beginning of your script. This step ensures all dependencies are loaded correctly, avoiding potential compilation errors. The GIF below illustrates how to access and include libraries in MetaEditor.

Fig 2. Including Libraries
In MQL5, an include library allows you to integrate external code, functions, or classes into your program, enhancing its functionality and enabling code reuse from various sources. By including a library, you gain access to the functions, classes, or variables defined within it, making them available for use in your script, expert advisor (EA), or indicator. Most libraries in MQL5 are built-in, providing ready-made solutions for common tasks like trading functions, technical indicators, and more.
Outcomes
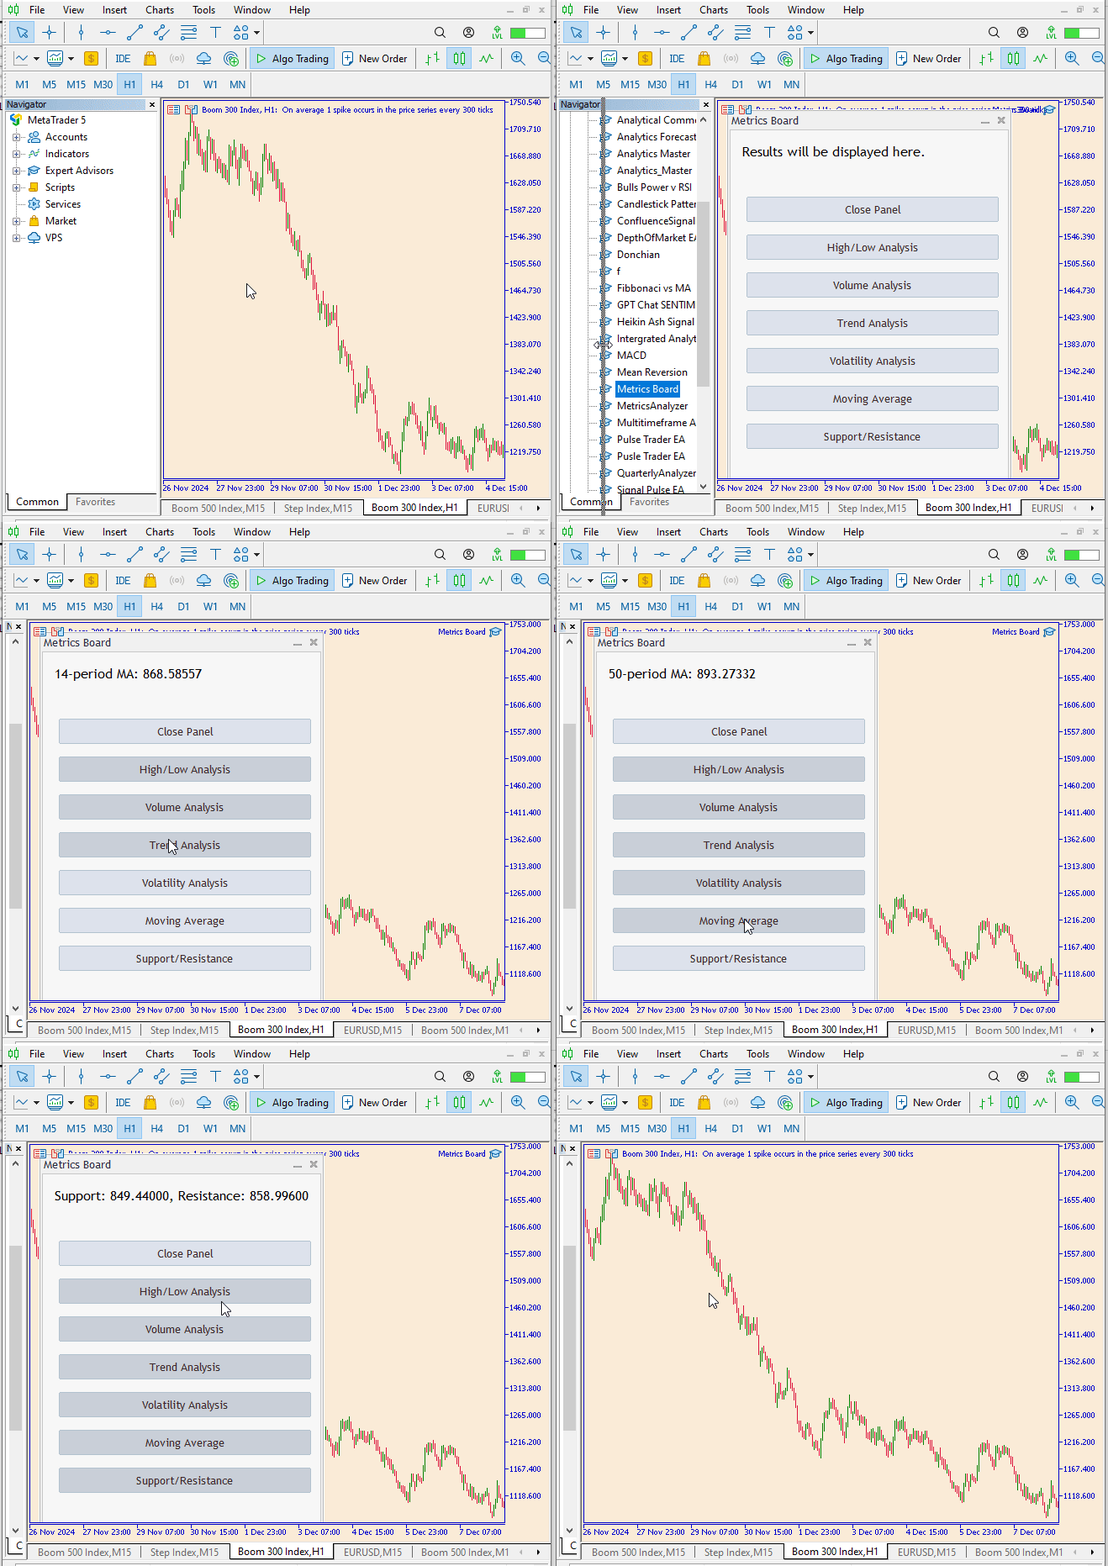
After successfully compiling the EA, you can now go to MetaTrader 5 and attach the EA to a chart. Let’s review the outcomes we obtained during testing.

Fig 3. Outcomes
In accordance with the diagram above, it is evident that the Metrics Board EA offers optimal functionality, responding effectively to each button press. This capability ensures that the EA provides the required metrics in real-time, enhancing user interaction and performance.
- EA logging
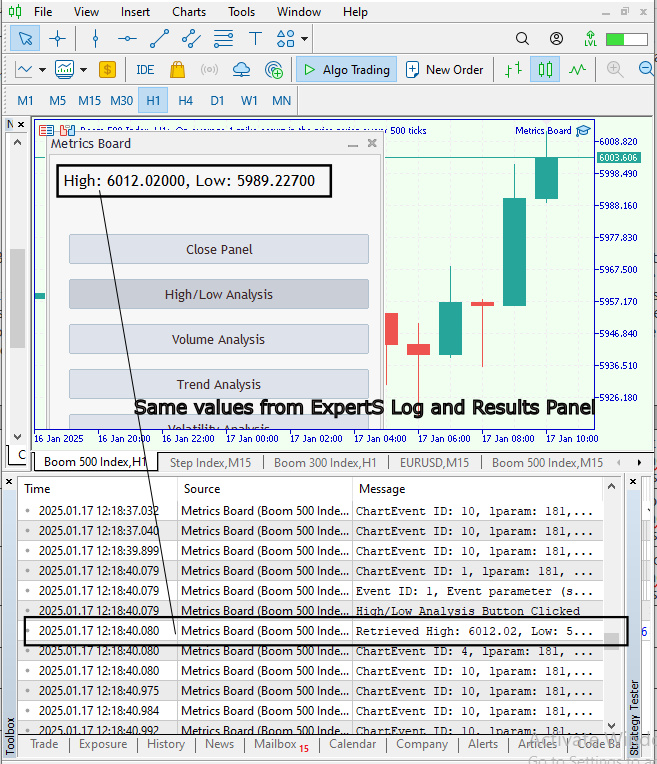
We can also review the Experts log in MetaTrader 5 to observe the interaction between the pressed buttons and the on-chart events. Since our EA includes a built-in logging function, it will capture these interactions. Let's take a look at the logged information and analyze what has been recorded.

Fig 4. Experts Logging
Conclusion
The Metrics Board EA features a dynamic and user-friendly panel interface embedded directly within MetaTrader 5, incorporating the draw object function. Its smooth integration gives the impression of working with native MetaTrader 5 controls, offering an experience comparable to using an inbuilt application. In my view, it marks a significant advancement in trading tools, delivering functionality and ease of use that exceed the capabilities of some analytics scripts I previously developed. By allowing users to focus on specific information with a single button click, it ensures that only the required data is displayed, streamlining the analysis process. While those earlier scripts effectively fulfilled their purposes, the Metrics Board EA takes market analysis to a superior level of efficiency and accessibility.
Key features of the Metrics Board EA include:
| Feature | Advantage |
|---|---|
| High/Low Analysis | Quickly identifies significant market levels to aid traders. |
| Volume Tracking | Provides up-to-date updates on trading volume for better market context. |
| Trend Identification | Simplifies the process of recognizing current market trends. |
| Support/Resistance Levels | Accurately pinpoints crucial price zones for strategic trading. |
This tool empowers traders to analyze markets effectively and make better choices. Its straightforward design simplifies complex analytics, allowing users to focus on refining their strategies. Looking ahead, there’s potential to expand its capabilities by adding new features and further improving the interface.
| Date | Tool Name | Description | Version | Updates | Notes |
|---|---|---|---|---|---|
| 01/10/24 | Chart Projector | Script to overlay the previous day's price action with ghost effect. | 1.0 | Initial Release | First tool in Lynnchris Tool Chest |
| 18/11/24 | Analytical Comment | It provides previous day's information in a tabular format, as well as anticipates the future direction of the market. | 1.0 | Initial Release | Second tool in the Lynnchris Tool Chest |
| 27/11/24 | Analytics Master | Regular Update of market metrics after every two hours | 1.01 | Second Release | Third tool in the Lynnchris Tool Chest |
| 02/12/24 | Analytics Forecaster | Regular Update of market metrics after every two hours with telegram integration | 1.1 | Third Edition | Tool number 4 |
| 09/12/24 | Volatility Navigator | The EA analyzes market conditions using the Bollinger Bands, RSI and ATR indicators | 1.0 | Initial Release | Tool Number 5 |
| 19/12/24 | Mean Reversion Signal Reaper | Analyzes market using mean reversion strategy and provides signal | 1.0 | Initial Release | Tool number 6 |
| 9/01/2025 | Signal Pulse | Multiple timeframe analyzer | 1.0 | Initial Release | Tool number 7 |
| 17/01/2025 | Metrics Board | Panel with button for analysis | 1.0 | Initial Release | Tool number 8 |
Warning: All rights to these materials are reserved by MetaQuotes Ltd. Copying or reprinting of these materials in whole or in part is prohibited.
This article was written by a user of the site and reflects their personal views. MetaQuotes Ltd is not responsible for the accuracy of the information presented, nor for any consequences resulting from the use of the solutions, strategies or recommendations described.
 MQL5 Trading Toolkit (Part 7): Expanding the History Management EX5 Library with the Last Canceled Pending Order Functions
 Developing a Calendar-Based News Event Breakout Expert Advisor in MQL5
 Master MQL5 from Beginner to Pro (Part III): Complex Data Types and Include Files
 Introduction to MQL5 (Part 11): A Beginner's Guide to Working with Built-in Indicators in MQL5 (II)
- Free trading apps
- Over 8,000 signals for copying
- Economic news for exploring financial markets
You agree to website policy and terms of use