
Price Action Analysis Toolkit Development (Part 17): TrendLoom EA Tool

Contents
Introduction
Market analysis and entry confirmation methods differ among trend analysts. Many traders review multiple timeframes such as M1, M5 and M15 or H1, H4 and W1 to validate their entries and boost signal reliability. Instead of changing timeframes to gauge the overall trend, you simply press a button and get an on-time update or get updated automatically. Have you ever seen a lower timeframe selling, entered a trade, and then opened a higher timeframe chart only to discover a buying trend?
TrendLoom EA is designed to prevent that mistake. It features a panel with seven buttons representing various trading styles. Each button shows three timeframes that are analyzed together using moving averages to generate signals like BUY, SELL or NEUTRAL. This robust tool provides quick confirmation updates and continuously refreshes with relevant signals as they are detected.
Strategy Overview
The TrendLoom EA is structured as a graphical interface (panel). The panel contains seven buttons, each corresponding to a specific trading strategy- Short-Term Focus (M1, M5, M15)
- Scalping/Intraday (M5, M15, H1)
- Swing Trading (M15, H1, H4)
- Trend Trading (H1, H4, D1)
- MTF Trend Confirmation (H1, H4, W1)
- Short Scalper/Mid-Trend (M5, H1, D1)
- Long-Term Trend (H1, D1, W1)
Let's walk through how the EA generates a BUY, SELL, or NEUTRAL signal when a button is pressed.
- Gathering Data: For each of the three timeframes (for example, M1, M5, and M15), the EA retrieves the closing price of the last fully completed candle.
- Calculating the SMA: For each timeframe, the EA calculates a 50-period Simple Moving Average (SMA). This SMA acts as a benchmark for the current price.
- If the price is above the SMA, it considers this a bullish sign and assigns a value of +1.
- If the price is below the SMA, it considers this a bearish sign and assigns a value of -1.
- When the price equals the SMA, the signal is neutral (0).
Combining the Signals
- The three individual signals (one from each timeframe) are added together.
- Determining the Final Signal:
- If the sum is 2 or more, it indicates strong bullish momentum. The EA returns a "BUY" signal.
- If the sum is -2 or less, it indicates strong bearish momentum. The EA returns a "SELL" signal.
- Otherwise, the signals are mixed or neutral, so the EA returns "NEUTRAL".
Let's review the following diagram to better understand the process.

Fig 1. Flow Chart
MQL5 Implementation
At the very top, you’ll notice the header comments and the EA’s property definitions. These lines serve as metadata for the EA, specifying its copyright, version, and linking it to its source. The #property strict directive is used to enforce stricter compilation rules, helping prevent common coding mistakes.
//+------------------------------------------------------------------+
//|                                                 TrendLoom EA.mq5 |
//|                                  Copyright 2025, MetaQuotes Ltd. |
//|                                             https://www.mql5.com |
//+------------------------------------------------------------------+
#property copyright "Copyright 2025, MetaQuotes Ltd."
#property link      "https://www.mql5.com/en/users/lynnchris"
#property version   "1.00"
#property strict
Next, the code includes several header files that supply dialog, button, label and panel controls. It also brings in chart object controls to display text on the chart. This modular inclusion allows the EA to use prebuilt classes for the user interface.
These include directives reference libraries in your MetaEditor's include folder. Files in the Controls subfolder offer built-in classes for dialogs and buttons. They also provide classes for labels and panels. This design simplifies building an interactive interface without rewriting code. The file in the ChartObjects subfolder (ChartObjectsTxtControls.mqh) lets you display dynamic text on the chart.
#include <Controls/Dialog.mqh>
#include <Controls/Button.mqh>
#include <Controls/Label.mqh>
#include <Controls/Panel.mqh>
#include <ChartObjects/ChartObjectsTxtControls.mqh>  // Adjusted include path (singular folder)
Constants for text alignment and a color value are then defined. This practice enhances code clarity and maintainability.
#ifndef ALIGN_LEFT
  #define ALIGN_LEFT   0
#endif
#ifndef ALIGN_CENTER
  #define ALIGN_CENTER 1
#endif
#ifndef ALIGN_RIGHT
  #define ALIGN_RIGHT  2
#endif

#define clrSilver 0xC0C0C0
The EA declares input parameters that adjust the appearance and position of the panel and its buttons. PanelX, PanelY, and PanelWidth set the panel's geometry, while the color inputs define the visual theme. Button dimensions are controlled with btnWidth, btnHeight, and btnSpacing and the EA lets you customize both the layout and colors. This configuration offers flexibility to tailor the user interface to your needs.
//---- Input parameters -----------------------------------------------
input int    PanelX               = 10;
input int    PanelY               = 10;
input int    PanelWidth           = 250;
input int    btnWidth             = 220;
input int    btnHeight            = 30;
input int    btnSpacing           = 5;

input color  PanelBackgroundColor = clrDimGray;
input color  PanelHeaderColor     = clrBlueViolet;
input color  ButtonBgColor        = clrBlack;
input color  ButtonTextColor      = clrBlueViolet;
input color  AnalysisTextColor    = clrLime;
Arrays store the button names and texts which makes updating or adding new buttons quick and simple. This design centralizes all button-related information in one place so modifications require only minor adjustments. It also improves consistency across the user interface and reduces the chance of errors. The method offers flexibility for future enhancements and keeps the code clean and organized.
//---- Button Names and Texts (7 analysis options) --------------------
string buttonNames[7] =
  {
   "btnShortTerm",
   "btnScalping",
   "btnSwing",
   "btnTrend",
   "btnMTFTrend",
   "btnShortScalper",
   "btnLongTerm"
  };

string buttonTexts[7] =
  {
   "Short Term Focus\n(M1, M5, M15)",
   "Scalping/Intraday\n(M5, M15, H1)",
   "Swing Trading\n(M15, H1, H4)",
   "Trend Trading\n(H1, H4, D1)",
   "MTF Trend Confirm\n(H1, H4, W1)",
   "Short Scalper/Mid Trend\n(M5, H1, D1)",
   "Long Term Trend\n(H1, D1, W1)"
  };
Global macros define the names for the panel header and analysis label. These macros ensure consistency throughout the code and act as a single source for these identifiers. By centralizing these names, updates to the panel's components become easier and reduce the risk of typos. This approach simplifies maintenance and ensures consistent, clear code.
// Global object names for panel header and analysis label
#define PANEL_BG "PanelBG"
#define PANEL_HEADER "PanelHeader"
#define ANALYSIS_LABEL "AnalysisResult"
The code then declares two helper functions: GetSMA calculates the simple moving average and AnalyzeTimeframes performs market analysis across multiple timeframes. These functions form the core logic for market analysis.
//--- Helper function declarations
double GetSMA(string symbol, ENUM_TIMEFRAMES timeframe, int period, int shift);
string AnalyzeTimeframes(ENUM_TIMEFRAMES tf1, ENUM_TIMEFRAMES tf2, ENUM_TIMEFRAMES tf3);
The custom class CTrendLoomPanel inherits from CAppDialog. It groups all user interface elements such as the header label, main panel, buttons, and result label. This design creates a modular interface that is easier to manage and extend.
Creating the Panel
The CreateTrendPanel method first creates a dialog window. It then sets up a header label with custom text, color, font size, and font style. Alignment is set using the ObjectSetInteger function.
bool CreateTrendPanel(const long chart, const string name, const int x1, const int y1, const int x2, const int y2)
{
   if(!CAppDialog::Create(chart, name, 0, x1, y1, x2, y2))
   {
      Print("Failed to create TrendLoom dialog.");
      return false;
   }
   if(!m_lblHeader.Create(0, "TrendLoomHeader", 0, 10, 10, x2 - x1 - 20, 30))
   {
      Print("Failed to create header label.");
      return false;
   }
   m_lblHeader.Text("TrendLoom EA");
   m_lblHeader.Color(PanelHeaderColor);
   m_lblHeader.FontSize(14);
   m_lblHeader.Font("Segoe UI");
   Add(m_lblHeader);
   if(!ObjectSetInteger(0L, m_lblHeader.Name(), OBJPROP_ALIGN, (long)ALIGN_CENTER))
      Print("Failed to set header alignment");
The method continues by creating the main panel and dynamically calculates its dimensions. It then creates each button and positions them one after the other. Finally, a results label is added below the buttons to show analysis output.
Handling Events
The OnEvent method processes user interactions. When a button is clicked, it calls AnalyzeTimeframes with the appropriate timeframe parameters. The analysis result is updated on the panel and an alert is shown.
bool OnEvent(const int id, const long &lparam, const double &dparam, const string &sparam)
{
   if(sparam == "btnShortTerm")
   {
      string res = AnalyzeTimeframes(PERIOD_M1, PERIOD_M5, PERIOD_M15);
      string out = "Short Term Focus: " + res;
      UpdateResults(out);
      Alert(out);
      return true;
   }
   else if(sparam == "btnScalping")
   {
      string res = AnalyzeTimeframes(PERIOD_M5, PERIOD_M15, PERIOD_H1);
      string out = "Scalping/Intraday: " + res;
      UpdateResults(out);
      Alert(out);
      return true;
   }
   // Additional conditions for other buttons
   return false;
}
Updating the UI
The UpdateResults method refreshes the results label with new analysis data. It then calls ChartRedraw so the updated information appears immediately.
void UpdateResults(const string &result)
{
   m_lblResults.Text("Analysis Result: " + result);
   ChartRedraw();
}
Core Analysis Functions
Calculating the Simple Moving Average (SMA)
The GetSMA function calculates the SMA by creating an indicator handle with the iMA function. It copies the SMA values from the indicator buffer and then releases the handle to free resources.
double GetSMA(string symbol, ENUM_TIMEFRAMES timeframe, int period, int shift)
{
   int handle = iMA(symbol, timeframe, period, 0, MODE_SMA, PRICE_CLOSE);
   if(handle == INVALID_HANDLE)
   {
      Print("Failed to create iMA handle for timeframe ", timeframe);
      return 0.0;
   }
   double sma[];
   if(CopyBuffer(handle, 0, shift, 1, sma) <= 0)
   {
      Print("Failed to copy buffer for timeframe ", timeframe);
      IndicatorRelease(handle);
      return 0.0;
   }
   double result = sma[0];
   IndicatorRelease(handle);
   return result;
}
Analyzing Multiple Timeframes
The AnalyzeTimeframes function retrieves the closing price and the SMA for three timeframes and assigns a bullish signal when the price exceeds the SMA or a bearish signal when it falls below. It sums the individual signals to produce a final recommendation: BUY when the sum is 2 or greater, SELL when it is -2 or lower and NEUTRAL otherwise. Each timeframe is evaluated independently to capture a balanced view of market trends while the shift parameter ensures only the last completed candle is used for analysis. Combining signals from multiple timeframes reduces the impact of transient market noise and adjusting the SMA period further refines the sensitivity of the trading signals.
string AnalyzeTimeframes(ENUM_TIMEFRAMES tf1, ENUM_TIMEFRAMES tf2, ENUM_TIMEFRAMES tf3)
{
   int period = 50;
   int shift  = 1; // last completed candle

   double price1 = iClose(_Symbol, tf1, shift);
   double sma1   = GetSMA(_Symbol, tf1, period, shift);
   int signal1   = (price1 > sma1) ? 1 : (price1 < sma1 ? -1 : 0);

   double price2 = iClose(_Symbol, tf2, shift);
   double sma2   = GetSMA(_Symbol, tf2, period, shift);
   int signal2   = (price2 > sma2) ? 1 : (price2 < sma2 ? -1 : 0);

   double price3 = iClose(_Symbol, tf3, shift);
   double sma3   = GetSMA(_Symbol, tf3, period, shift);
   int signal3   = (price3 > sma3) ? 1 : (price3 < sma3 ? -1 : 0);

   int sum = signal1 + signal2 + signal3;
   if(sum >= 2)
      return "BUY";
   else if(sum <= -2)
      return "SELL";
   else
      return "NEUTRAL";
}
The EA's lifecycle functions handle initialization, cleanup, and event processing. The OnInit function creates the TrendLoom panel using the input parameters. If panel creation fails the EA returns an initialization error.
int OnInit()
{
   if(!TrendPanel.CreateTrendPanel(0, "TrendLoom Panel", PanelX, PanelY, PanelX + PanelWidth + 20, PanelY + 400))
   {
      Print("Failed to create TrendLoom Panel.");
      return INIT_FAILED;
   }
   return INIT_SUCCEEDED;
}
The OnDeinit function cleans up by destroying the panel when the EA is removed or the chart is closed.
void OnDeinit(const int reason)
{
   TrendPanel.Destroy(reason);
}
Lastly, the OnChartEvent function forwards chart events to the panel's event handler so that the interface remains responsive.
void OnChartEvent(const int id, const long &lparam, const double &dparam, const string &sparam)
{
   TrendPanel.ChartEvent(id, lparam, dparam, sparam);
}
In your MetaEditor, the required files are stored in the include folder. To access the specified files as shown in the snippet, refer to the subfolders as depicted in the diagrams below. This organization ensures that the compiler finds the dialog, button, label, and panel control files in the include/Controls folder and the chart object controls in the include/ChartObjects folder.
#include <Controls/Dialog.mqh>
#include <Controls/Button.mqh>
#include <Controls/Label.mqh>
#include <Controls/Panel.mqh>
#include <ChartObjects/ChartObjectsTxtControls.mqh>  // Adjusted include path (singular folder)
Step 1
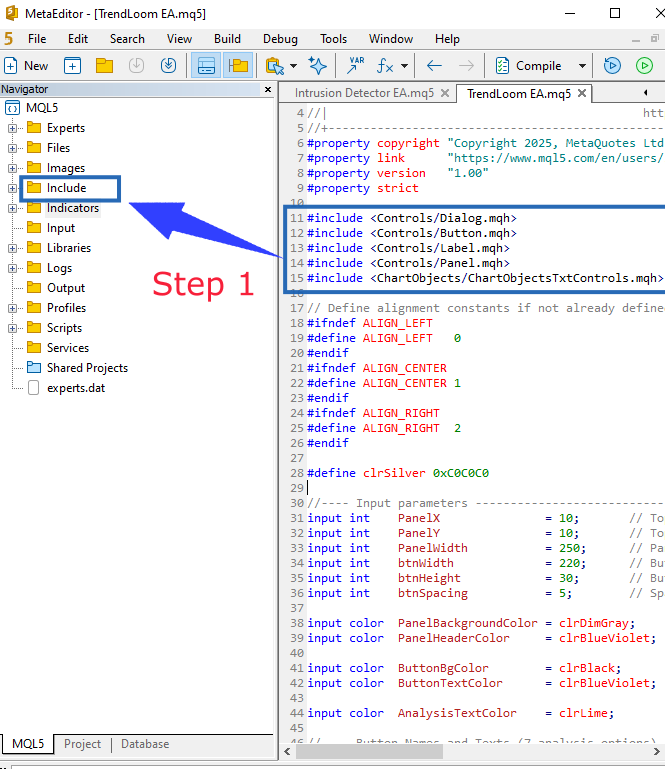
Fig 2. Step 1
Step 2
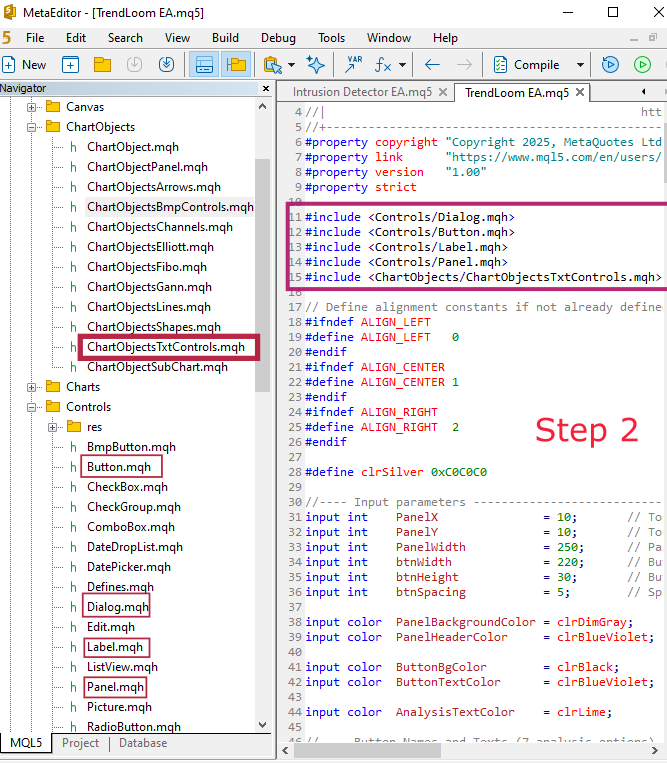
Fig 3. Step 2
MQL5 Code
//+------------------------------------------------------------------+
//|                                                 TrendLoom EA.mq5 |
//|                                  Copyright 2025, MetaQuotes Ltd. |
//|                                             https://www.mql5.com |
//+------------------------------------------------------------------+
#property copyright "Copyright 2025, MetaQuotes Ltd."
#property link      "https://www.mql5.com/en/users/lynnchris"
#property version   "1.00"
#property strict

#include <Controls/Dialog.mqh>
#include <Controls/Button.mqh>
#include <Controls/Label.mqh>
#include <Controls/Panel.mqh>
#include <ChartObjects/ChartObjectsTxtControls.mqh>  // Adjusted include path (singular folder)

// Define alignment constants if not already defined
#ifndef ALIGN_LEFT
#define ALIGN_LEFT   0
#endif
#ifndef ALIGN_CENTER
#define ALIGN_CENTER 1
#endif
#ifndef ALIGN_RIGHT
#define ALIGN_RIGHT  2
#endif

#define clrSilver 0xC0C0C0

//---- Input parameters -----------------------------------------------
input int    PanelX               = 10;       // Top-left X coordinate of panel
input int    PanelY               = 10;       // Top-left Y coordinate of panel
input int    PanelWidth           = 250;      // Panel width (for longer text)
input int    btnWidth             = 220;      // Button width
input int    btnHeight            = 30;       // Button height
input int    btnSpacing           = 5;        // Spacing between buttons

input color  PanelBackgroundColor = clrDimGray;     // Panel background color
input color  PanelHeaderColor     = clrBlueViolet;  // Panel header text color

input color  ButtonBgColor        = clrBlack;       // Button background color
input color  ButtonTextColor      = clrBlueViolet;  // Button text color

input color  AnalysisTextColor    = clrLime;        // Analysis result text color

//---- Button Names and Texts (7 analysis options) --------------------
string buttonNames[7] =
  {
   "btnShortTerm",
   "btnScalping",
   "btnSwing",
   "btnTrend",
   "btnMTFTrend",
   "btnShortScalper",
   "btnLongTerm"
  };

string buttonTexts[7] =
  {
   "Short Term Focus\n(M1, M5, M15)",
   "Scalping/Intraday\n(M5, M15, H1)",
   "Swing Trading\n(M15, H1, H4)",
   "Trend Trading\n(H1, H4, D1)",
   "MTF Trend Confirm\n(H1, H4, W1)",
   "Short Scalper/Mid Trend\n(M5, H1, D1)",
   "Long Term Trend\n(H1, D1, W1)"
  };

// Global object names for panel header and analysis label
#define PANEL_BG "PanelBG"
#define PANEL_HEADER "PanelHeader"
#define ANALYSIS_LABEL "AnalysisResult"

//--- Helper function declarations
double GetSMA(string symbol, ENUM_TIMEFRAMES timeframe, int period, int shift);
string AnalyzeTimeframes(ENUM_TIMEFRAMES tf1, ENUM_TIMEFRAMES tf2, ENUM_TIMEFRAMES tf3);

//------------------------------------------------------------------------------
// CTrendLoomPanel class - A modern, modular panel for TrendLoom EA
//------------------------------------------------------------------------------
class CTrendLoomPanel : public CAppDialog
  {
private:
   CLabel            m_lblHeader;
   CPanel            m_panelMain;
   CButton           m_btnShortTerm;
   CButton           m_btnScalping;
   CButton           m_btnSwing;
   CButton           m_btnTrend;
   CButton           m_btnMTFTrend;
   CButton           m_btnShortScalper;
   CButton           m_btnLongTerm;
   CLabel            m_lblResults;

public:
   // Create the TrendLoom Panel dialog
   bool              CreateTrendPanel(const long chart, const string name, const int x1, const int y1, const int x2, const int y2)
     {
      if(!CAppDialog::Create(chart, name, 0, x1, y1, x2, y2))
        {
         Print("Failed to create TrendLoom dialog.");
         return false;
        }
      // Create header label
      if(!m_lblHeader.Create(0, "TrendLoomHeader", 0, 10, 10, x2 - x1 - 20, 30))
        {
         Print("Failed to create header label.");
         return false;
        }
      m_lblHeader.Text("TrendLoom EA");
      m_lblHeader.Color(PanelHeaderColor);
      m_lblHeader.FontSize(14);
      m_lblHeader.Font("Segoe UI");
      Add(m_lblHeader);
      // Set header text alignment to center using ObjectSetInteger
      if(!ObjectSetInteger(0L, m_lblHeader.Name(), OBJPROP_ALIGN, (long)ALIGN_CENTER))
         Print("Failed to set header alignment");

      // Create main panel background
      int panelBottom = 50 + (btnHeight + btnSpacing) * 7 + btnSpacing;
      if(!m_panelMain.Create(0, "TrendLoomPanel", 0, 10, 50, x2 - x1 - 10, panelBottom))
        {
         Print("Failed to create main panel.");
         return false;
        }
      m_panelMain.Color(PanelBackgroundColor);
      m_panelMain.BorderType(BORDER_RAISED);
      m_panelMain.ColorBorder(clrSilver);
      Add(m_panelMain);

      // Starting coordinates for buttons
      int btnX = 20; // relative to dialog
      int btnY = 60;
      int buttonWidth = btnWidth;
      int buttonHeight = btnHeight;

      // Create each button with a modern look
      if(!m_btnShortTerm.Create(0, buttonNames[0], 0, btnX, btnY, btnX + buttonWidth, btnY + buttonHeight))
         return false;
      m_btnShortTerm.Text(buttonTexts[0]);
      m_btnShortTerm.Font("Segoe UI");
      m_btnShortTerm.FontSize(12);
      m_btnShortTerm.Color(ButtonBgColor);
      Add(m_btnShortTerm);
      btnY += buttonHeight + btnSpacing;

      if(!m_btnScalping.Create(0, buttonNames[1], 0, btnX, btnY, btnX + buttonWidth, btnY + buttonHeight))
         return false;
      m_btnScalping.Text(buttonTexts[1]);
      m_btnScalping.Font("Segoe UI");
      m_btnScalping.FontSize(12);
      m_btnScalping.Color(ButtonBgColor);
      Add(m_btnScalping);
      btnY += buttonHeight + btnSpacing;

      if(!m_btnSwing.Create(0, buttonNames[2], 0, btnX, btnY, btnX + buttonWidth, btnY + buttonHeight))
         return false;
      m_btnSwing.Text(buttonTexts[2]);
      m_btnSwing.Font("Segoe UI");
      m_btnSwing.FontSize(12);
      m_btnSwing.Color(ButtonBgColor);
      Add(m_btnSwing);
      btnY += buttonHeight + btnSpacing;

      if(!m_btnTrend.Create(0, buttonNames[3], 0, btnX, btnY, btnX + buttonWidth, btnY + buttonHeight))
         return false;
      m_btnTrend.Text(buttonTexts[3]);
      m_btnTrend.Font("Segoe UI");
      m_btnTrend.FontSize(12);
      m_btnTrend.Color(ButtonBgColor);
      Add(m_btnTrend);
      btnY += buttonHeight + btnSpacing;

      if(!m_btnMTFTrend.Create(0, buttonNames[4], 0, btnX, btnY, btnX + buttonWidth, btnY + buttonHeight))
         return false;
      m_btnMTFTrend.Text(buttonTexts[4]);
      m_btnMTFTrend.Font("Segoe UI");
      m_btnMTFTrend.FontSize(12);
      m_btnMTFTrend.Color(ButtonBgColor);
      Add(m_btnMTFTrend);
      btnY += buttonHeight + btnSpacing;

      if(!m_btnShortScalper.Create(0, buttonNames[5], 0, btnX, btnY, btnX + buttonWidth, btnY + buttonHeight))
         return false;
      m_btnShortScalper.Text(buttonTexts[5]);
      m_btnShortScalper.Font("Segoe UI");
      m_btnShortScalper.FontSize(12);
      m_btnShortScalper.Color(ButtonBgColor);
      Add(m_btnShortScalper);
      btnY += buttonHeight + btnSpacing;

      if(!m_btnLongTerm.Create(0, buttonNames[6], 0, btnX, btnY, btnX + buttonWidth, btnY + buttonHeight))
         return false;
      m_btnLongTerm.Text(buttonTexts[6]);
      m_btnLongTerm.Font("Segoe UI");
      m_btnLongTerm.FontSize(12);
      m_btnLongTerm.Color(ButtonBgColor);
      Add(m_btnLongTerm);
      btnY += buttonHeight + btnSpacing;

      // Create results label below the buttons
      if(!m_lblResults.Create(0, "TrendResults", 0, btnX, btnY, btnX + buttonWidth, btnY + 30))
         return false;
      m_lblResults.Text("Analysis Result: [Waiting for Input]");
      m_lblResults.Font("Segoe UI");
      m_lblResults.FontSize(12);
      m_lblResults.Color(AnalysisTextColor);
      Add(m_lblResults);
      // Set results text alignment to left using ObjectSetInteger
      if(!ObjectSetInteger(0L, m_lblResults.Name(), OBJPROP_ALIGN, (long)ALIGN_LEFT))
         Print("Failed to set results alignment");

      Show();
      return true;
     }

   // Process events (button clicks)
   bool              OnEvent(const int id, const long &lparam, const double &dparam, const string &sparam)
     {
      if(sparam == "btnShortTerm")
        {
         string res = AnalyzeTimeframes(PERIOD_M1, PERIOD_M5, PERIOD_M15);
         string out = "Short Term Focus: " + res;
         UpdateResults(out);
         Alert(out);
         return true;
        }
      else
         if(sparam == "btnScalping")
           {
            string res = AnalyzeTimeframes(PERIOD_M5, PERIOD_M15, PERIOD_H1);
            string out = "Scalping/Intraday: " + res;
            UpdateResults(out);
            Alert(out);
            return true;
           }
         else
            if(sparam == "btnSwing")
              {
               string res = AnalyzeTimeframes(PERIOD_M15, PERIOD_H1, PERIOD_H4);
               string out = "Swing Trading: " + res;
               UpdateResults(out);
               Alert(out);
               return true;
              }
            else
               if(sparam == "btnTrend")
                 {
                  string res = AnalyzeTimeframes(PERIOD_H1, PERIOD_H4, PERIOD_D1);
                  string out = "Trend Trading: " + res;
                  UpdateResults(out);
                  Alert(out);
                  return true;
                 }
               else
                  if(sparam == "btnMTFTrend")
                    {
                     string res = AnalyzeTimeframes(PERIOD_H1, PERIOD_H4, PERIOD_W1);
                     string out = "MTF Trend Confirm: " + res;
                     UpdateResults(out);
                     Alert(out);
                     return true;
                    }
                  else
                     if(sparam == "btnShortScalper")
                       {
                        string res = AnalyzeTimeframes(PERIOD_M5, PERIOD_H1, PERIOD_D1);
                        string out = "Short Scalper/Mid Trend: " + res;
                        UpdateResults(out);
                        Alert(out);
                        return true;
                       }
                     else
                        if(sparam == "btnLongTerm")
                          {
                           string res = AnalyzeTimeframes(PERIOD_H1, PERIOD_D1, PERIOD_W1);
                           string out = "Long Term Trend: " + res;
                           UpdateResults(out);
                           Alert(out);
                           return true;
                          }
      return false;
     }

   bool              ChartEvent(const int id, const long &lparam, const double &dparam, const string &sparam)
     {
      return OnEvent(id, lparam, dparam, sparam);
     }

   // Update the results label and refresh the chart
   void              UpdateResults(const string &result)
     {
      m_lblResults.Text("Analysis Result: " + result);
      ChartRedraw();
     }
  };

// Global instance of the TrendLoom Panel
CTrendLoomPanel TrendPanel;

//------------------------------------------------------------------------------
// Helper functions (core analysis logic)
//------------------------------------------------------------------------------
double GetSMA(string symbol, ENUM_TIMEFRAMES timeframe, int period, int shift)
  {
   int handle = iMA(symbol, timeframe, period, 0, MODE_SMA, PRICE_CLOSE);
   if(handle == INVALID_HANDLE)
     {
      Print("Failed to create iMA handle for timeframe ", timeframe);
      return 0.0;
     }
   double sma[];  // dynamic array to store SMA values
   if(CopyBuffer(handle, 0, shift, 1, sma) <= 0)
     {
      Print("Failed to copy buffer for timeframe ", timeframe);
      IndicatorRelease(handle);
      return 0.0;
     }
   double result = sma[0];
   IndicatorRelease(handle);
   return result;
  }

//+------------------------------------------------------------------+
//|                                                                  |
//+------------------------------------------------------------------+
string AnalyzeTimeframes(ENUM_TIMEFRAMES tf1, ENUM_TIMEFRAMES tf2, ENUM_TIMEFRAMES tf3)
  {
   int period = 50;
   int shift  = 1; // last completed candle

   double price1 = iClose(_Symbol, tf1, shift);
   double sma1   = GetSMA(_Symbol, tf1, period, shift);
   int signal1   = (price1 > sma1) ? 1 : (price1 < sma1 ? -1 : 0);

   double price2 = iClose(_Symbol, tf2, shift);
   double sma2   = GetSMA(_Symbol, tf2, period, shift);
   int signal2   = (price2 > sma2) ? 1 : (price2 < sma2 ? -1 : 0);

   double price3 = iClose(_Symbol, tf3, shift);
   double sma3   = GetSMA(_Symbol, tf3, period, shift);
   int signal3   = (price3 > sma3) ? 1 : (price3 < sma3 ? -1 : 0);

   int sum = signal1 + signal2 + signal3;
   if(sum >= 2)
      return "BUY";
   else
      if(sum <= -2)
         return "SELL";
      else
         return "NEUTRAL";
  }

//+------------------------------------------------------------------+
//| Expert initialization function                                   |
//+------------------------------------------------------------------+
int OnInit()
  {
   if(!TrendPanel.CreateTrendPanel(0, "TrendLoom Panel", PanelX, PanelY, PanelX + PanelWidth + 20, PanelY + 400))
     {
      Print("Failed to create TrendLoom Panel.");
      return INIT_FAILED;
     }
   return INIT_SUCCEEDED;
  }

//+------------------------------------------------------------------+
//| Expert deinitialization function                                 |
//+------------------------------------------------------------------+
void OnDeinit(const int reason)
  {
   TrendPanel.Destroy(reason);
  }

//+------------------------------------------------------------------+
//| Chart Event Handler                                              |
//+------------------------------------------------------------------+
void OnChartEvent(const int id, const long &lparam, const double &dparam, const string &sparam)
  {
   TrendPanel.ChartEvent(id, lparam, dparam, sparam);
  }
//+------------------------------------------------------------------+
Outcomes
It is critically important for every trader to thoroughly test their systems before using them in live trades. Testing involves backtesting on historical data to see how the system would have performed without risking any funds. You can also use demo live accounts to observe actual performance in real time. This process helps you fine-tune and develop a more reliable tool that you can confidently use on a live account. Personally, I prefer to spend significant time testing and refining the EA for more robust results.
In this section, I present the test results of the EA running on the chart. I tested it on Volatility 75 (1s) and it produced wonderful and profitable outcomes. Every button works as intended and the analytics update almost instantly when you press a button. Let's review the first test below.
Fig 4. Volatility 75 (1s) Test
Below is a diagram that illustrates how the market behaved after executing a trade based on the provided signal. This diagram continues the trade shown in the GIF above. I used the M1 timeframe to offer a broader view of the trades.
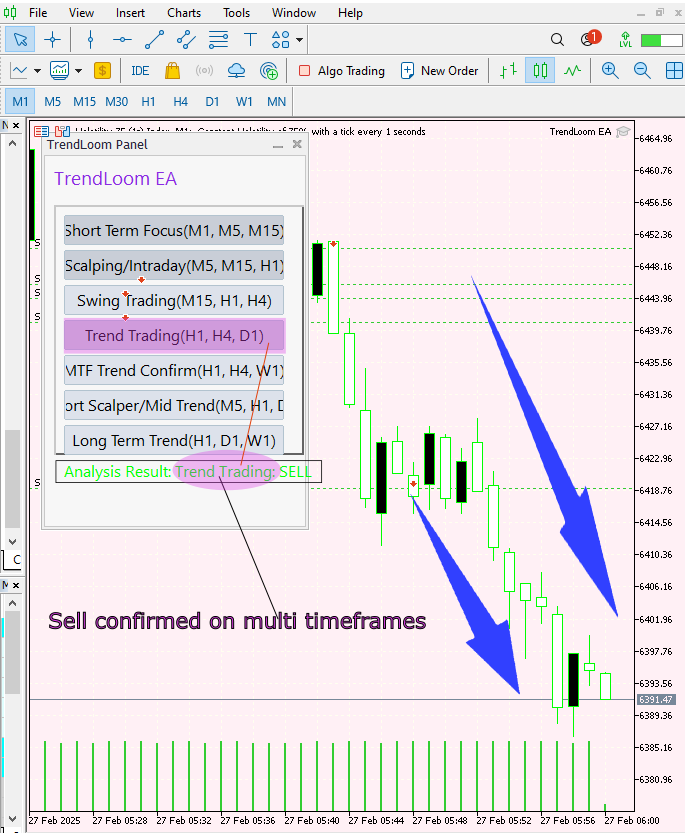
Fig 5. V 75 (1s) Test
Conclusion
Having created and tested the EA, I can confidently confirm that it has a positive impact on market analysis. Its quick signal processing and overall trend evaluation have produced powerful results on volatility indices. However, this tool serves as a supplemental aid rather than the final signal provider. I encourage you to thoroughly test it and adjust the parameters to your preferences. You can also modify it further to customize the appearance of the buttons. Use it to confirm your overall strategy, I have seen it be effective in that way.
| Date | Tool Name | Description | Version | Updates | Notes |
|---|---|---|---|---|---|
| 01/10/24 | Chart Projector | Script to overlay the previous day's price action with ghost effect. | 1.0 | Initial Release | Tool number 1 |
| 18/11/24 | Analytical Comment | It provides previous day's information in a tabular format, as well as anticipates the future direction of the market. | 1.0 | Initial Release | Tool number 2 |
| 27/11/24 | Analytics Master | Regular Update of market metrics after every two hours | 1.01 | Second Release | Tool number 3 |
| 02/12/24 | Analytics Forecaster | Regular Update of market metrics after every two hours with telegram integration | 1.1 | Third Edition | Tool number 4 |
| 09/12/24 | Volatility Navigator | The EA analyzes market conditions using the Bollinger Bands, RSI and ATR indicators | 1.0 | Initial Release | Tool Number 5 |
| 19/12/24 | Mean Reversion Signal Reaper | Analyzes market using mean reversion strategy and provides signal | 1.0 | Initial Release | Tool number 6 |
| 9/01/25 | Signal Pulse | Multiple timeframe analyzer | 1.0 | Initial Release | Tool number 7 |
| 17/01/25 | Metrics Board | Panel with button for analysis | 1.0 | Initial Release | Tool number 8 |
| 21/01/25 | External Flow | Analytics through external libraries | 1.0 | Initial Release | Tool number 9 |
| 27/01/25 | VWAP | Volume Weighted Average Price | 1.3 | Initial Release | Tool number 10 |
| 02/02/25 | Heikin Ashi | Trend Smoothening and reversal signal identification | 1.0 | Initial Release | Tool number 11 |
| 04/02/25 | FibVWAP | Signal generation through python analysis | 1.0 | Initial Release | Tool number 12 |
| 14/02/25 | RSI DIVERGENCE | Price action versus RSI divergences | 1.0 | Initial Release | Tool number 13 |
| 17/02/25 | Parabolic Stop and Reverse (PSAR) | Automating PSAR strategy | 1.0 | Initial Release | Tool number 14 |
| 20/02/25 | Quarters Drawer Script | Drawing quarters levels on chart | 1.0 | Initial Release | Tool number 15 |
| 27/02/25 | Intrusion Detector | Detect and alert when price reaches quarters levels | 1.0 | Initial Release | Tool number 16 |
| 27/02/25 | TrendLoom Tool | Multi timeframe analytics panel | 1.0 | Initial Release | Tool number 17 |
- Free trading apps
- Over 8,000 signals for copying
- Economic news for exploring financial markets
You agree to website policy and terms of use
Wow Fantastic ,I can see there is a lot of effort put into this , Thank you for sharing you approach and code