
Automating Trading Strategies in MQL5 (Part 15): Price Action Harmonic Cypher Pattern with Visualization
Introduction
In our previous article (Part 14), we developed a trade layering strategy using Moving Average Convergence Divergence (MACD) and Relative Strength Indicator (RSI) with statistical methods to scale positions in trending markets dynamically. Now, in Part 15, we focus on automating the Cypher harmonic pattern, a Fibonacci-based reversal pattern, with an Expert Advisor (EA) that detects, visualizes and trades this structure in MetaQuotes Language 5 (MQL5). We will cover the following topics:
- Understanding the Cypher Pattern Architecture
- Implementation in MQL5
- Backtesting and Optimization
- Conclusion
By the end of this article, you’ll have a fully functional program that identifies Cypher patterns, annotates charts with clear visuals, and executes trades with precision—let’s dive in!
Understanding the Cypher Pattern Architecture
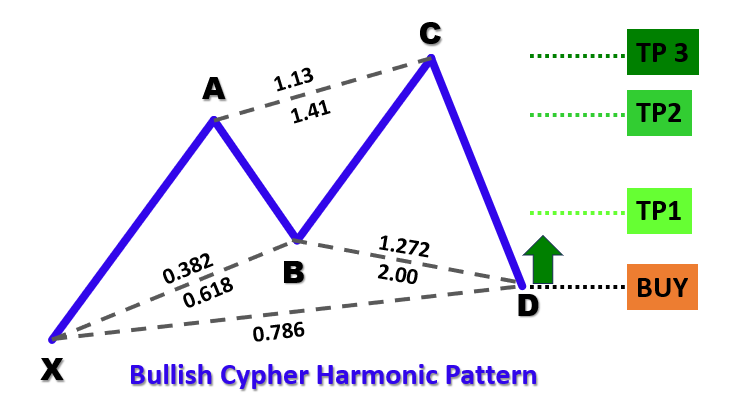
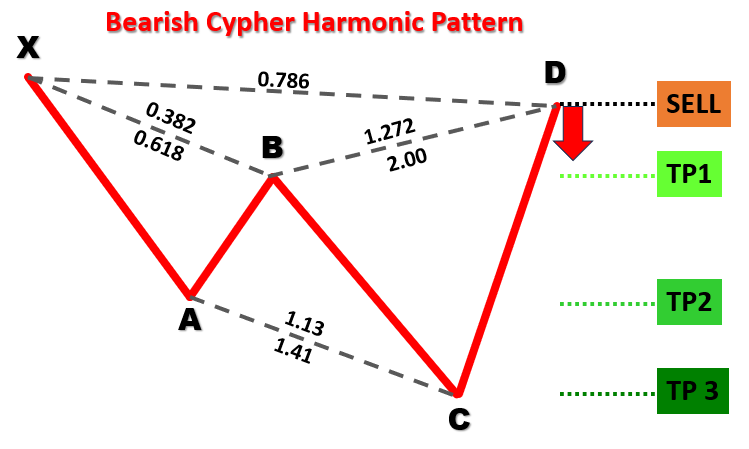
The Cypher pattern is a harmonic trading formation defined by five key swing points—X, A, B, C, and D—and exists in two forms: a bullish pattern and a bearish pattern. In a bullish Cypher, the structure forms a low-high-low-high-low sequence where point X is a swing low, point A a swing high, point B a swing low, point C a swing high, and point D a swing low (with D positioned below X). Conversely, a bearish Cypher forms a high-low-high-low-high sequence, with point X as a swing high and point D positioned above X. Below are the visualized pattern types.
Bullish Cypher Harmonic Pattern:
Bearish Cypher Harmonic Pattern:
To identify the patterns, below is our structured approach:
- Defining the XA Leg: The initial move from point X to point A establishes the reference distance for the pattern, setting the direction (upward for bearish, downward for bullish).
- Establishing the AB Leg: For both pattern types, point B should retrace between 38.2% and 61.8% of the XA move, confirming a moderate correction of the initial movement.
- Analyzing the BC Leg: This leg should extend between 127.2% and 141.4% of the AB leg, ensuring a strong counter-movement before the final leg.
- Setting the CD Leg: The final leg should retrace approximately 78.6% of the XC move (from X to C), marking the potential reversal zone.
By applying these geometric and Fibonacci-based criteria, our trading system will systematically detect valid Cypher patterns in historical price data. Once a pattern is confirmed, the program will visualize the formation on the chart with annotated triangles, trend lines, and labels for points X, A, B, C, and D, as well as trade levels. This setup enables automated trade execution based on the calculated entry, stop-loss, and take-profit levels, leveraging the pattern’s predictive power for market reversals.
Implementation in MQL5
To create the program in MQL5, open the MetaEditor, go to the Navigator, locate the Indicators folder, click on the "New" tab, and follow the prompts to create the file. Once it is made, in the coding environment, we will need to declare some global variables that we will use throughout the program.
//+------------------------------------------------------------------+
//|                        Copyright 2025, Forex Algo-Trader, Allan. |
//|                                 "https://t.me/Forex_Algo_Trader" |
//+------------------------------------------------------------------+
#property copyright "Forex Algo-Trader, Allan"
#property link      "https://t.me/Forex_Algo_Trader"
#property version   "1.00"
#property description "This EA trades based on Cypher Strategy with visualization"
#property strict //--- Forces strict coding rules to catch errors early

//--- Include the Trade library from MQL5 to handle trading operations like buying and selling
#include <Trade\Trade.mqh>
//--- Create an instance (object) of the CTrade class to use for placing trades
CTrade obj_Trade;

//--- Input parameters let the user customize the EA without editing the code
input int    SwingHighCount    = 5;      // How many bars to check on the left to find a swing point (high or low)
input int    SwingLowCount     = 5;      // How many bars to check on the right to confirm a swing point
input double FibonacciTolerance = 0.10;  // Allowed error margin (10%) for Fibonacci ratios in the pattern
input double TradeVolume       = 0.01;   // Size of the trade (e.g., 0.01 lots is small for testing)
input bool   TradingEnabled    = true;   // True = EA can trade; False = only visualize patterns

//--- Define the Cypher pattern rules as a comment for reference
//--- Bullish Cypher: X (low), A (high), B (low), C (high), D (low)
//---   XA > 0; AB = 0.382-0.618 XA; BC = 1.272-1.414 AB; CD = 0.786 XC; D < X
//--- Bearish Cypher: X (high), A (low), B (high), C (low), D (high)
//---   XA > 0; AB = 0.382-0.618 XA; BC = 1.272-1.414 AB; CD = 0.786 XC; D > X

//--- Define a structure (like a custom data type) to store swing point info
struct SwingPoint {
   datetime TimeOfSwing;    //--- When the swing happened (date and time of the bar)
   double   PriceAtSwing;   //--- Price at the swing (high or low)
   bool     IsSwingHigh;    //--- True = swing high; False = swing low
};

//--- Create a dynamic array to hold all detected swing points
SwingPoint SwingPoints[];
Here, we initiate the MetaQuotes Language 5 implementation of the Cypher pattern trading system by including the "Trade.mqh" library to enable trading operations and creating an instance of the "CTrade" class, named "obj_Trade", for trade execution.
We define input parameters—"SwingHighCount" and "SwingLowCount" (both 5) for swing point detection, "FibonacciTolerance" (0.10) for Fibonacci ratio flexibility, "TradeVolume" (0.01 lots) for trade size, and "TradingEnabled" (true) to toggle trading—allowing user customization.
The "SwingPoint" structure is defined with "TimeOfSwing" (datetime), "PriceAtSwing" (double), and "IsSwingHigh" (boolean) to store swing point details, and a dynamic "SwingPoints" array holds all detected swing points for pattern analysis.
Next, we can define functions that will help us to visualize the patterns in the chart.
//+------------------------------------------------------------------+
//| Helper: Draw a filled triangle                                   |
//+------------------------------------------------------------------+
//--- Function to draw a triangle on the chart to highlight pattern segments
void DrawTriangle(string TriangleName, datetime Time1, double Price1, datetime Time2, double Price2, datetime Time3, double Price3, color LineColor, int LineWidth, bool FillTriangle, bool DrawBehind) {
   //--- Create a triangle object using three points (time, price) on the chart
   if(ObjectCreate(0, TriangleName, OBJ_TRIANGLE, 0, Time1, Price1, Time2, Price2, Time3, Price3)) {
      ObjectSetInteger(0, TriangleName, OBJPROP_COLOR, LineColor);      //--- Set the triangle’s color (e.g., blue or red)
      ObjectSetInteger(0, TriangleName, OBJPROP_STYLE, STYLE_SOLID);    //--- Use a solid line style
      ObjectSetInteger(0, TriangleName, OBJPROP_WIDTH, LineWidth);      //--- Set the line thickness
      ObjectSetInteger(0, TriangleName, OBJPROP_FILL, FillTriangle);    //--- Fill the triangle with color if true
      ObjectSetInteger(0, TriangleName, OBJPROP_BACK, DrawBehind);      //--- Draw behind candles if true
   }
}
Here, we implement the "DrawTriangle" function to enhance the visualization of the Cypher pattern by drawing a filled triangle on the MetaTrader 5 chart, highlighting specific segments of the pattern for better trader comprehension. The function accepts multiple parameters to define the triangle’s appearance and position: "TriangleName" (string) provides a unique identifier for the object, "Time1", "Time2", and "Time3" (datetime) specify the time coordinates of the triangle’s three vertices, while "Price1", "Price2", and "Price3" (double) set the corresponding price levels.
Additional parameters include "LineColor" (color) to determine the outline color (e.g., blue for bullish patterns, red for bearish), "LineWidth" (int) to set the thickness of the triangle’s borders, "FillTriangle" (bool) to decide whether the triangle is filled with color, and "DrawBehind" (bool) to control whether the triangle is rendered behind chart candles to avoid obstructing price data.
Within the function, we use the ObjectCreate function to create a triangle object on the chart, specifying the object type as OBJ_TRIANGLE and passing the provided time and price coordinates for the three points. The function checks if the object creation is successful before proceeding to configure its properties.
If creation succeeds, we call the ObjectSetInteger function multiple times to set the triangle’s attributes: OBJPROP_COLOR assigns the "LineColor" value, "OBJPROP_STYLE" is set to "STYLE_SOLID" for a solid outline, "OBJPROP_WIDTH" applies the "LineWidth" value, "OBJPROP_FILL" uses the "FillTriangle" boolean to enable or disable filling, and OBJPROP_BACK uses the "DrawBehind" boolean to ensure the triangle appears behind candles when true.
We can now define the rest of the helper functions via the same logic.
//+------------------------------------------------------------------+
//| Helper: Draw a trend line                                        |
//+------------------------------------------------------------------+
//--- Function to draw a straight line between two points on the chart
void DrawTrendLine(string LineName, datetime StartTime, double StartPrice, datetime EndTime, double EndPrice, color LineColor, int LineWidth, int LineStyle) {
   //--- Create a trend line object connecting two points (start time/price to end time/price)
   if(ObjectCreate(0, LineName, OBJ_TREND, 0, StartTime, StartPrice, EndTime, EndPrice)) {
      ObjectSetInteger(0, LineName, OBJPROP_COLOR, LineColor);      //--- Set the line color
      ObjectSetInteger(0, LineName, OBJPROP_STYLE, LineStyle);      //--- Set line style (e.g., solid or dashed)
      ObjectSetInteger(0, LineName, OBJPROP_WIDTH, LineWidth);      //--- Set line thickness
      ObjectSetInteger(0, LineName, OBJPROP_BACK, true);
   }
}

//+------------------------------------------------------------------+
//| Helper: Draw a dotted trend line                                 |
//+------------------------------------------------------------------+
//--- Function to draw a horizontal dotted line (e.g., for entry or take-profit levels)
void DrawDottedLine(string LineName, datetime StartTime, double LinePrice, datetime EndTime, color LineColor) {
   //--- Create a horizontal line from start time to end time at a fixed price
   if(ObjectCreate(0, LineName, OBJ_TREND, 0, StartTime, LinePrice, EndTime, LinePrice)) {
      ObjectSetInteger(0, LineName, OBJPROP_COLOR, LineColor);      //--- Set the line color
      ObjectSetInteger(0, LineName, OBJPROP_STYLE, STYLE_DOT);      //--- Use dotted style
      ObjectSetInteger(0, LineName, OBJPROP_WIDTH, 1);              //--- Thin line
   }
}

//+------------------------------------------------------------------+
//| Helper: Draw anchored text label (for pivots and levels)         |
//+------------------------------------------------------------------+
//--- Function to place text labels (e.g., "X" or "TP1") on the chart
void DrawTextLabel(string LabelName, string LabelText, datetime LabelTime, double LabelPrice, color TextColor, int FontSize, bool IsAbove) {
   //--- Create a text object at a specific time and price
   if(ObjectCreate(0, LabelName, OBJ_TEXT, 0, LabelTime, LabelPrice)) {
      ObjectSetString(0, LabelName, OBJPROP_TEXT, LabelText);          //--- Set the text to display
      ObjectSetInteger(0, LabelName, OBJPROP_COLOR, TextColor);        //--- Set text color
      ObjectSetInteger(0, LabelName, OBJPROP_FONTSIZE, FontSize);      //--- Set text size
      ObjectSetString(0, LabelName, OBJPROP_FONT, "Arial Bold");       //--- Use bold Arial font
      //--- Position text below if it’s a high point, above if it’s a low point
      ObjectSetInteger(0, LabelName, OBJPROP_ANCHOR, IsAbove ? ANCHOR_BOTTOM : ANCHOR_TOP);
      ObjectSetInteger(0, LabelName, OBJPROP_ALIGN, ALIGN_CENTER);     //--- Center the text
   }
}
Here, we implement the "DrawTrendLine" function to draw a straight line connecting Cypher pattern swing points on the chart, using parameters "LineName" (string), "StartTime", "EndTime" (datetime), "StartPrice", "EndPrice" (double), "LineColor" (color), "LineWidth" (int), and "LineStyle" (int). We use the ObjectCreate function to create an "OBJ_TREND" line and, if successful, set "OBJPROP_COLOR", "OBJPROP_STYLE", "OBJPROP_WIDTH", and "OBJPROP_BACK" (true) with "ObjectSetInteger" for visibility behind candles.
The "DrawDottedLine" function draws a horizontal dotted line for trade levels, using "LineName" (string), "StartTime", "EndTime" (datetime), "LinePrice" (double), and "LineColor" (color). We create an OBJ_TREND object with "ObjectCreate" at a fixed price and set "OBJPROP_COLOR", "OBJPROP_STYLE" to "STYLE_DOT", and "OBJPROP_WIDTH" to 1 using ObjectSetInteger for a subtle marker.
The "DrawTextLabel" function places text labels for swing points or trade levels, taking "LabelName", "LabelText" (string), "LabelTime" (datetime), "LabelPrice" (double), "TextColor" (color), "FontSize" (int), and "IsAbove" (bool). We create an OBJ_TEXT object with "ObjectCreate" and use "ObjectSetString" for "OBJPROP_TEXT" and "OBJPROP_FONT" ("Arial Bold"), and "ObjectSetInteger" for "OBJPROP_COLOR", "OBJPROP_FONTSIZE", "OBJPROP_ANCHOR" ("ANCHOR_BOTTOM" or "ANCHOR_TOP"), and "OBJPROP_ALIGN" (ALIGN_CENTER) to ensure clear annotations.
Armed with these variables and functions, we can graduate to the OnTick event handler and begin the pattern recognition. However, since we won't need to process anything on every tick, we need to define a logic that we can use to process the identification once per bar.
//+------------------------------------------------------------------+
//| Expert tick function                                             |
//+------------------------------------------------------------------+
//--- Main function that runs every time a new price tick arrives
void OnTick() {
   //--- Use a static variable to track the last bar’s time so we only process new bars
   static datetime LastProcessedBarTime = 0;
   //--- Get the time of the second-to-last bar (latest complete bar)
   datetime CurrentBarTime = iTime(_Symbol, _Period, 1);
   //--- If no new bar has formed, exit to avoid over-processing
   if(CurrentBarTime == LastProcessedBarTime)
      return;
   LastProcessedBarTime = CurrentBarTime;  //--- Update to the current bar
}
On the OnTick event handler, which serves as the main event handler that executes every time a new price tick arrives in the MetaTrader 5 platform, we declare a static variable "LastProcessedBarTime" to track the timestamp of the last processed bar, ensuring the function processes only new bars to optimize performance.
Using the iTime function, we retrieve the time of the second-to-last bar (the latest complete bar) and store it in "CurrentBarTime". We then compare "CurrentBarTime" with "LastProcessedBarTime" to check if a new bar has formed; if they are equal, we exit the function with a return statement to avoid redundant processing.
If a new bar is detected, we update "LastProcessedBarTime" to "CurrentBarTime", allowing the function to proceed with subsequent logic for analyzing price data and detecting Cypher patterns. Next, we need to define variables that will help define swing point levels.
//--- Clear the SwingPoints array to start fresh each time
ArrayResize(SwingPoints, 0);
//--- Get the total number of bars on the chart
int TotalBars = Bars(_Symbol, _Period);
int StartBarIndex = SwingHighCount;         //--- Start checking swings after SwingHighCount bars
int EndBarIndex = TotalBars - SwingLowCount; //--- Stop before the last SwingLowCount bars
We use the ArrayResize function to clear the "SwingPoints" array by setting its size to 0, ensuring a fresh start for storing new swing points on each new bar. We then retrieve the total number of bars on the chart using the Bars function, storing the result in "TotalBars", which defines the scope of historical data to analyze.
To focus on relevant bars for swing detection, we set "StartBarIndex" to the value of "SwingHighCount", marking the earliest bar to check for swings, and calculate "EndBarIndex" as "TotalBars" minus "SwingLowCount", ensuring we stop before the last few bars to allow sufficient data for confirming swing points.
With these, we can loop and gather swing point data.
//--- Loop through bars to find swing highs and lows (swing points)
for(int BarIndex = EndBarIndex - 1; BarIndex >= StartBarIndex; BarIndex--) {
   bool IsSwingHigh = true;   //--- Assume it’s a high until proven otherwise
   bool IsSwingLow = true;    //--- Assume it’s a low until proven otherwise
   double CurrentBarHigh = iHigh(_Symbol, _Period, BarIndex); //--- Get the high of this bar
   double CurrentBarLow = iLow(_Symbol, _Period, BarIndex);   //--- Get the low of this bar
   //--- Check bars to the left and right to confirm it’s a swing point
   for(int NeighborIndex = BarIndex - SwingHighCount; NeighborIndex <= BarIndex + SwingLowCount; NeighborIndex++) {
      if(NeighborIndex < 0 || NeighborIndex >= TotalBars || NeighborIndex == BarIndex) //--- Skip invalid bars or current bar
         continue;
      if(iHigh(_Symbol, _Period, NeighborIndex) > CurrentBarHigh) //--- If any bar is higher, not a high
         IsSwingHigh = false;
      if(iLow(_Symbol, _Period, NeighborIndex) < CurrentBarLow)   //--- If any bar is lower, not a low
         IsSwingLow = false;
   }
   //--- If it’s a high or low, store it in the SwingPoints array
   if(IsSwingHigh || IsSwingLow) {
      SwingPoint NewSwing;
      NewSwing.TimeOfSwing = iTime(_Symbol, _Period, BarIndex); //--- Store the bar’s time
      NewSwing.PriceAtSwing = IsSwingHigh ? CurrentBarHigh : CurrentBarLow; //--- Store high or low price
      NewSwing.IsSwingHigh = IsSwingHigh;              //--- Mark as high or low
      int CurrentArraySize = ArraySize(SwingPoints);   //--- Get current array size
      ArrayResize(SwingPoints, CurrentArraySize + 1);  //--- Add one more slot
      SwingPoints[CurrentArraySize] = NewSwing;        //--- Add the swing to the array
   }
}
Here, we implement the swing point detection logic to identify swing highs and lows for the Cypher pattern. We use a for loop to iterate through bars from "EndBarIndex - 1" to "StartBarIndex" in descending order, with "BarIndex" tracking the current bar. For each bar, we initialize "IsSwingHigh" and "IsSwingLow" as true, assuming the bar is a swing point until disproven, and retrieve the bar’s high and low prices using the iHigh and iLow functions, storing them in "CurrentBarHigh" and "CurrentBarLow". A nested for loop checks neighboring bars from "BarIndex - SwingHighCount" to "BarIndex + SwingLowCount", using "NeighborIndex" to skip invalid indices or the current bar itself with a continue statement.
If any neighboring bar’s high exceeds "CurrentBarHigh" or low falls below "CurrentBarLow" (via iHigh and iLow), we set "IsSwingHigh" or "IsSwingLow" to false, respectively. If either remains true, we create a "SwingPoint" instance named "NewSwing", assigning "TimeOfSwing" with the bar’s time from iTime, "PriceAtSwing" as "CurrentBarHigh" or "CurrentBarLow" based on "IsSwingHigh", and "IsSwingHigh" accordingly.
We then use the "ArraySize" function to get the current size of "SwingPoints", expand it by one with ArrayResize, and store "NewSwing" in the "SwingPoints" array at the new index, building the collection of swing points for pattern analysis. When we print the data using the ArrayPrint(SwingPoints) function, we have the following outcome.
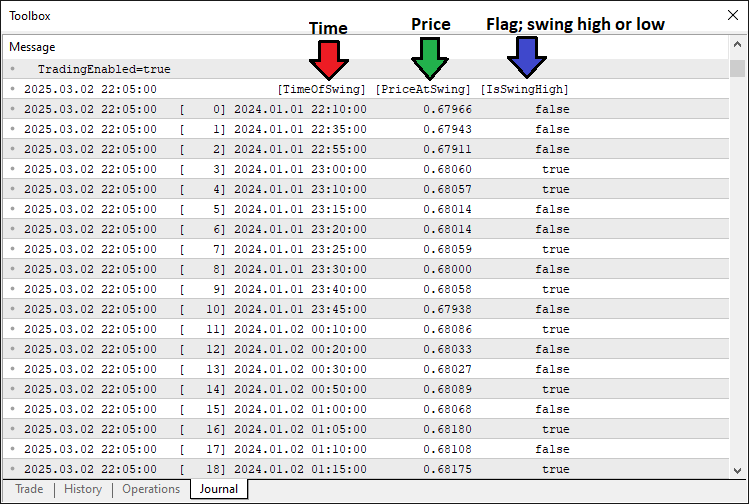
With the data, we can extract the pivot points and if we have enough pivots, we can analyze and detect the patterns. Here is the logic we implement to achieve that.
//--- Check if we have enough swing points (need 5 for Cypher: X, A, B, C, D)
int TotalSwingPoints = ArraySize(SwingPoints);
if(TotalSwingPoints < 5)
   return;  //--- Exit if not enough swing points

//--- Assign the last 5 swing points to X, A, B, C, D (most recent is D)
SwingPoint PointX = SwingPoints[TotalSwingPoints - 5];
SwingPoint PointA = SwingPoints[TotalSwingPoints - 4];
SwingPoint PointB = SwingPoints[TotalSwingPoints - 3];
SwingPoint PointC = SwingPoints[TotalSwingPoints - 2];
SwingPoint PointD = SwingPoints[TotalSwingPoints - 1];

//--- Variables to track if we found a pattern and its type
bool PatternFound = false;
string PatternDirection = "";

//--- Check for Bearish Cypher pattern
if(PointX.IsSwingHigh && !PointA.IsSwingHigh && PointB.IsSwingHigh && !PointC.IsSwingHigh && PointD.IsSwingHigh) {
   double LegXA = PointX.PriceAtSwing - PointA.PriceAtSwing;  //--- Calculate XA leg (should be positive)
   if(LegXA > 0) {
      double LegAB = PointB.PriceAtSwing - PointA.PriceAtSwing; //--- AB leg
      double LegBC = PointB.PriceAtSwing - PointC.PriceAtSwing; //--- BC leg
      double LegXC = PointX.PriceAtSwing - PointC.PriceAtSwing; //--- XC leg
      double LegCD = PointD.PriceAtSwing - PointC.PriceAtSwing; //--- CD leg
      //--- Check Fibonacci rules and D > X for bearish
      if(LegAB >= 0.382 * LegXA && LegAB <= 0.618 * LegXA &&
         LegBC >= 1.272 * LegAB && LegBC <= 1.414 * LegAB &&
         MathAbs(LegCD - 0.786 * LegXC) <= FibonacciTolerance * LegXC && PointD.PriceAtSwing > PointX.PriceAtSwing) {
         PatternFound = true;
         PatternDirection = "Bearish";
      }
   }
}
//--- Check for Bullish Cypher pattern
else if(!PointX.IsSwingHigh && PointA.IsSwingHigh && !PointB.IsSwingHigh && PointC.IsSwingHigh && !PointD.IsSwingHigh) {
   double LegXA = PointA.PriceAtSwing - PointX.PriceAtSwing;  //--- Calculate XA leg (should be positive)
   if(LegXA > 0) {
      double LegAB = PointA.PriceAtSwing - PointB.PriceAtSwing; //--- AB leg
      double LegBC = PointC.PriceAtSwing - PointB.PriceAtSwing; //--- BC leg
      double LegXC = PointC.PriceAtSwing - PointX.PriceAtSwing; //--- XC leg
      double LegCD = PointC.PriceAtSwing - PointD.PriceAtSwing; //--- CD leg
      //--- Check Fibonacci rules and D < X for bullish
      if(LegAB >= 0.382 * LegXA && LegAB <= 0.618 * LegXA &&
         LegBC >= 1.272 * LegAB && LegBC <= 1.414 * LegAB &&
         MathAbs(LegCD - 0.786 * LegXC) <= FibonacciTolerance * LegXC && PointD.PriceAtSwing < PointX.PriceAtSwing) {
         PatternFound = true;
         PatternDirection = "Bullish";
      }
   }
}
Here, we continue to validate the Cypher pattern by checking for sufficient swing points and analyzing the last five for pattern formation. We use the ArraySize function to determine the number of elements in the "SwingPoints" array, storing it in "TotalSwingPoints", and exit with a return statement if "TotalSwingPoints" is less than 5, as the Cypher pattern requires five points (X, A, B, C, D). If enough points exist, we assign the last five swing points to "PointX", "PointA", "PointB", "PointC", and "PointD" from the "SwingPoints" array, with indices from "TotalSwingPoints - 5" to "TotalSwingPoints - 1", where "PointD" is the most recent.
We then initialize "PatternFound" as false to track whether a valid pattern is detected and "PatternDirection" as an empty string to store the pattern type. To check for a bearish Cypher, we verify that "PointX.IsSwingHigh" is true, "PointA.IsSwingHigh" is false, "PointB.IsSwingHigh" is true, "PointC.IsSwingHigh" is false, and "PointD.IsSwingHigh" is true, ensuring the high-low-high-low-high sequence.
If true, we calculate leg lengths: "LegXA" as "PointX.PriceAtSwing" minus "PointA.PriceAtSwing" (positive for bearish), "LegAB" as "PointB.PriceAtSwing" minus "PointA.PriceAtSwing", "LegBC" as "PointB.PriceAtSwing" minus "PointC.PriceAtSwing", "LegXC" as "PointX.PriceAtSwing" minus "PointC.PriceAtSwing", and "LegCD" as "PointD.PriceAtSwing" minus "PointC.PriceAtSwing".
We validate Fibonacci ratios—ensuring "LegAB" is 38.2% to 61.8% of "LegXA", "LegBC" is 127.2% to 141.4% of "LegAB", "LegCD" is within "FibonacciTolerance" of 78.6% of "LegXC" using the "MathAbs" function, and "PointD.PriceAtSwing" exceeds "PointX.PriceAtSwing"—setting "PatternFound" to true and "PatternDirection" to "Bearish" if all conditions are met.
For a bullish Cypher, we check the opposite sequence: "PointX.IsSwingHigh" false, "PointA.IsSwingHigh" true, "PointB.IsSwingHigh" false, "PointC.IsSwingHigh" true, and "PointD.IsSwingHigh" false.
We compute "LegXA" as "PointA.PriceAtSwing" minus "PointX.PriceAtSwing" (positive for bullish), "LegAB" as "PointA.PriceAtSwing" minus "PointB.PriceAtSwing", "LegBC" as "PointC.PriceAtSwing" minus "PointB.PriceAtSwing", "LegXC" as "PointC.PriceAtSwing" minus "PointX.PriceAtSwing", and "LegCD" as "PointC.PriceAtSwing" minus "PointD.PriceAtSwing".
The same Fibonacci checks apply, with "PointD.PriceAtSwing" less than "PointX.PriceAtSwing", updating "PatternFound" to true and "PatternDirection" to "Bullish" if valid, enabling subsequent visualization and trading logic. If the pattern is found, we can proceed to visualize it on the chart.
//--- If a pattern is found, visualize it and trade
if(PatternFound) {
   //--- Log the pattern detection in the Experts tab
   Print(PatternDirection, " Cypher pattern detected at ", TimeToString(PointD.TimeOfSwing, TIME_DATE|TIME_MINUTES));

   //--- Create a unique prefix for all chart objects using D’s time
   string ObjectPrefix = "CY_" + IntegerToString(PointD.TimeOfSwing);
   //--- Set triangle color: blue for bullish, red for bearish
   color TriangleColor = (PatternDirection == "Bullish") ? clrBlue : clrRed;

   //--- **Visualization Steps**
   //--- 1. Draw two filled triangles to highlight the pattern
   DrawTriangle(ObjectPrefix + "_Triangle1", PointX.TimeOfSwing, PointX.PriceAtSwing, PointA.TimeOfSwing, PointA.PriceAtSwing, PointB.TimeOfSwing, PointB.PriceAtSwing, TriangleColor, 2, true, true);
   DrawTriangle(ObjectPrefix + "_Triangle2", PointB.TimeOfSwing, PointB.PriceAtSwing, PointC.TimeOfSwing, PointC.PriceAtSwing, PointD.TimeOfSwing, PointD.PriceAtSwing, TriangleColor, 2, true, true);
}
We proceed to handle visualization of a detected Cypher pattern when "PatternFound" is true. We use the Print function to log the pattern detection in the Experts tab, outputting "PatternDirection" followed by a message indicating a Cypher pattern was detected, with the time formatted by the TimeToString function using "PointD.TimeOfSwing" and the "TIME_DATE|TIME_MINUTES" flags for readability.
To organize chart objects, we create a unique prefix "ObjectPrefix" by concatenating "CY_" with the string representation of "PointD.TimeOfSwing" obtained via the IntegerToString function, ensuring each pattern’s objects are distinctly named. We then set "TriangleColor" using a ternary operator, assigning "clrBlue" for a "Bullish" pattern or "clrRed" for a "Bearish" pattern based on "PatternDirection".
For visualization, we call the "DrawTriangle" function twice: first to draw a triangle named "ObjectPrefix + '_Triangle1'" connecting "PointX", "PointA", and "PointB" using their "TimeOfSwing" and "PriceAtSwing" values, and second for "ObjectPrefix + '_Triangle2'" connecting "PointB", "PointC", and "PointD", both with "TriangleColor", a line width of 2, and "true" for filling and drawing behind candles, highlighting the pattern’s structure on the chart. Here is what we have achieved so far.
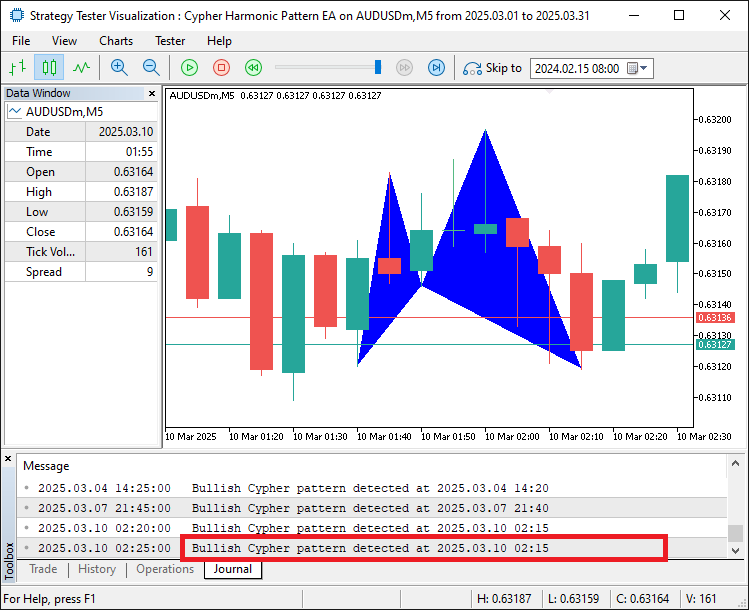
From the image, we can see that we can map and visualize the detected pattern correctly. We now need to continue mapping the trendlines to fully make it visible within boundaries and adding label to it for easier identification of the levels.
//--- 2. Draw six trend lines connecting the swing points
DrawTrendLine(ObjectPrefix + "_Line_XA", PointX.TimeOfSwing, PointX.PriceAtSwing, PointA.TimeOfSwing, PointA.PriceAtSwing, clrBlack, 2, STYLE_SOLID);
DrawTrendLine(ObjectPrefix + "_Line_AB", PointA.TimeOfSwing, PointA.PriceAtSwing, PointB.TimeOfSwing, PointB.PriceAtSwing, clrBlack, 2, STYLE_SOLID);
DrawTrendLine(ObjectPrefix + "_Line_BC", PointB.TimeOfSwing, PointB.PriceAtSwing, PointC.TimeOfSwing, PointC.PriceAtSwing, clrBlack, 2, STYLE_SOLID);
DrawTrendLine(ObjectPrefix + "_Line_CD", PointC.TimeOfSwing, PointC.PriceAtSwing, PointD.TimeOfSwing, PointD.PriceAtSwing, clrBlack, 2, STYLE_SOLID);
DrawTrendLine(ObjectPrefix + "_Line_XB", PointX.TimeOfSwing, PointX.PriceAtSwing, PointB.TimeOfSwing, PointB.PriceAtSwing, clrBlack, 2, STYLE_SOLID);
DrawTrendLine(ObjectPrefix + "_Line_BD", PointB.TimeOfSwing, PointB.PriceAtSwing, PointD.TimeOfSwing, PointD.PriceAtSwing, clrBlack, 2, STYLE_SOLID);

//--- 3. Draw labels for each swing point (X, A, B, C, D)
double LabelOffset = 15 * SymbolInfoDouble(_Symbol, SYMBOL_POINT); //--- Offset in points for label placement
DrawTextLabel(ObjectPrefix + "_Label_X", "X", PointX.TimeOfSwing, PointX.PriceAtSwing + (PointX.IsSwingHigh ? LabelOffset : -LabelOffset), clrBlack, 11, PointX.IsSwingHigh);
DrawTextLabel(ObjectPrefix + "_Label_A", "A", PointA.TimeOfSwing, PointA.PriceAtSwing + (PointA.IsSwingHigh ? LabelOffset : -LabelOffset), clrBlack, 11, PointA.IsSwingHigh);
DrawTextLabel(ObjectPrefix + "_Label_B", "B", PointB.TimeOfSwing, PointB.PriceAtSwing + (PointB.IsSwingHigh ? LabelOffset : -LabelOffset), clrBlack, 11, PointB.IsSwingHigh);
DrawTextLabel(ObjectPrefix + "_Label_C", "C", PointC.TimeOfSwing, PointC.PriceAtSwing + (PointC.IsSwingHigh ? LabelOffset : -LabelOffset), clrBlack, 11, PointC.IsSwingHigh);
DrawTextLabel(ObjectPrefix + "_Label_D", "D", PointD.TimeOfSwing, PointD.PriceAtSwing + (PointD.IsSwingHigh ? LabelOffset : -LabelOffset), clrBlack, 11, PointD.IsSwingHigh);

//--- 4. Draw a central label to identify the pattern
datetime CenterTime = (PointX.TimeOfSwing + PointB.TimeOfSwing) / 2;  //--- Middle time between X and B
double CenterPrice = PointD.PriceAtSwing;                            //--- Place it at D’s price level
if(ObjectCreate(0, ObjectPrefix + "_Label_Center", OBJ_TEXT, 0, CenterTime, CenterPrice)) {
   ObjectSetString(0, ObjectPrefix + "_Label_Center", OBJPROP_TEXT, "Cypher"); //--- Label as "Cypher"
   ObjectSetInteger(0, ObjectPrefix + "_Label_Center", OBJPROP_COLOR, clrBlack);
   ObjectSetInteger(0, ObjectPrefix + "_Label_Center", OBJPROP_FONTSIZE, 11);
   ObjectSetString(0, ObjectPrefix + "_Label_Center", OBJPROP_FONT, "Arial Bold");
   ObjectSetInteger(0, ObjectPrefix + "_Label_Center", OBJPROP_ALIGN, ALIGN_CENTER);
}
We continue the visualization process to further illustrate the Cypher pattern on the chart. We call the "DrawTrendLine" function six times to draw solid black lines connecting the swing points, each named with "ObjectPrefix" plus a unique suffix (e.g., "_Line_XA"). These lines link "PointX" to "PointA", "PointA" to "PointB", "PointB" to "PointC", "PointC" to "PointD", "PointX" to "PointB", and "PointB" to "PointD" using their respective "TimeOfSwing" and "PriceAtSwing" values, with a line width of 2 and STYLE_SOLID for clear delineation of the pattern’s structure.
Next, we add text labels for each swing point by calculating "LabelOffset" as 15 times the symbol’s point size, retrieved via the SymbolInfoDouble function with SYMBOL_POINT, to position labels appropriately. We call the "DrawTextLabel" function five times to label "PointX", "PointA", "PointB", "PointC", and "PointD" with names like "ObjectPrefix + '_Label_X'" and text "X", "A", "B", "C", "D". Each label uses the point’s "TimeOfSwing" and "PriceAtSwing" adjusted by "LabelOffset" (added if "IsSwingHigh" is true, subtracted if false), with "clrBlack" color, font size 11, and "IsSwingHigh" determining placement above or below the point.
Finally, we create a central label to identify the pattern by calculating "CenterTime" as the average of "PointX.TimeOfSwing" and "PointB.TimeOfSwing" and setting "CenterPrice" to "PointD.PriceAtSwing". We use the ObjectCreate function to create a text object named "ObjectPrefix + '_Label_Center'" of type "OBJ_TEXT" at these coordinates. If successful, we configure it with "ObjectSetString" to set "OBJPROP_TEXT" to "Cypher" and "OBJPROP_FONT" to "Arial Bold", and with ObjectSetInteger to set "OBJPROP_COLOR" to "clrBlack", "OBJPROP_FONTSIZE" to 11, and "OBJPROP_ALIGN" to "ALIGN_CENTER", clearly marking the pattern on the chart. On compilation, we have the following outcome.
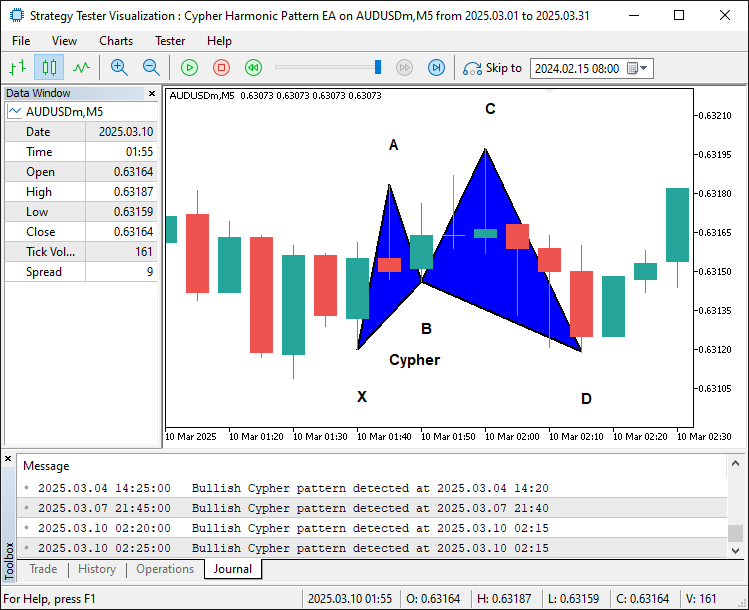
From the image, we can see that we have added the edges and the labels to the pattern, making it more revealing and illustrative. What we need to do next is determine the trade levels for the pattern.
//--- 5. Draw trade levels (entry, take-profits) as dotted lines
datetime LineStartTime = PointD.TimeOfSwing;                    //--- Start at D’s time
datetime LineEndTime = PointD.TimeOfSwing + PeriodSeconds(_Period) * 2; //--- Extend 2 bars to the right
double EntryPrice, StopLossPrice, TakeProfitPrice, TakeProfit1Level, TakeProfit2Level, TakeProfit3Level, TradeDistance;
if(PatternDirection == "Bullish") {
   EntryPrice = SymbolInfoDouble(_Symbol, SYMBOL_ASK); //--- Buy at current ask price
   StopLossPrice = PointX.PriceAtSwing;                //--- Stop-loss at X (below entry for bullish)
   TakeProfitPrice = PointC.PriceAtSwing;              //--- Take-profit at C (target level)
   TakeProfit3Level = PointC.PriceAtSwing;             //--- Highest TP at C
   TradeDistance = TakeProfit3Level - EntryPrice;      //--- Distance to TP3
   TakeProfit1Level = EntryPrice + TradeDistance / 3;  //--- First TP at 1/3 of the distance
   TakeProfit2Level = EntryPrice + 2 * TradeDistance / 3; //--- Second TP at 2/3
} else {
   EntryPrice = SymbolInfoDouble(_Symbol, SYMBOL_BID); //--- Sell at current bid price
   StopLossPrice = PointX.PriceAtSwing;                //--- Stop-loss at X (above entry for bearish)
   TakeProfitPrice = PointC.PriceAtSwing;              //--- Take-profit at C
   TakeProfit3Level = PointC.PriceAtSwing;             //--- Lowest TP at C
   TradeDistance = EntryPrice - TakeProfit3Level;      //--- Distance to TP3
   TakeProfit1Level = EntryPrice - TradeDistance / 3;  //--- First TP at 1/3
   TakeProfit2Level = EntryPrice - 2 * TradeDistance / 3; //--- Second TP at 2/3
}

DrawDottedLine(ObjectPrefix + "_EntryLine", LineStartTime, EntryPrice, LineEndTime, clrMagenta); //--- Entry line
DrawDottedLine(ObjectPrefix + "_TP1Line", LineStartTime, TakeProfit1Level, LineEndTime, clrForestGreen); //--- TP1 line
DrawDottedLine(ObjectPrefix + "_TP2Line", LineStartTime, TakeProfit2Level, LineEndTime, clrGreen);      //--- TP2 line
DrawDottedLine(ObjectPrefix + "_TP3Line", LineStartTime, TakeProfit3Level, LineEndTime, clrDarkGreen);  //--- TP3 line

//--- 6. Draw labels for trade levels
datetime LabelTime = LineEndTime + PeriodSeconds(_Period) / 2; //--- Place labels further right
string EntryLabelText = (PatternDirection == "Bullish") ? "BUY (" : "SELL (";
EntryLabelText += DoubleToString(EntryPrice, _Digits) + ")"; //--- Add price to label
DrawTextLabel(ObjectPrefix + "_EntryLabel", EntryLabelText, LabelTime, EntryPrice, clrMagenta, 11, true);

string TP1LabelText = "TP1 (" + DoubleToString(TakeProfit1Level, _Digits) + ")";
DrawTextLabel(ObjectPrefix + "_TP1Label", TP1LabelText, LabelTime, TakeProfit1Level, clrForestGreen, 11, true);

string TP2LabelText = "TP2 (" + DoubleToString(TakeProfit2Level, _Digits) + ")";
DrawTextLabel(ObjectPrefix + "_TP2Label", TP2LabelText, LabelTime, TakeProfit2Level, clrGreen, 11, true);

string TP3LabelText = "TP3 (" + DoubleToString(TakeProfit3Level, _Digits) + ")";
DrawTextLabel(ObjectPrefix + "_TP3Label", TP3LabelText, LabelTime, TakeProfit3Level, clrDarkGreen, 11, true);
Here, we continue to visualize trade levels for the Cypher pattern by drawing dotted lines and labels. We set "LineStartTime" to "PointD.TimeOfSwing" and "LineEndTime" to two bars beyond it using the PeriodSeconds function multiplied by 2, defining the time range for horizontal lines.
For a "Bullish" pattern (when "PatternDirection" is "Bullish"), we set "EntryPrice" to the current ask price via SymbolInfoDouble with SYMBOL_ASK, "StopLossPrice" to "PointX.PriceAtSwing", "TakeProfitPrice" and "TakeProfit3Level" to "PointC.PriceAtSwing", calculate "TradeDistance" as "TakeProfit3Level" minus "EntryPrice", and compute "TakeProfit1Level" and "TakeProfit2Level" as one-third and two-thirds of "TradeDistance" added to "EntryPrice".
For a bearish pattern, we use SYMBOL_BID for "EntryPrice", set "StopLossPrice" and "TakeProfit3Level" similarly, calculate "TradeDistance" as "EntryPrice" minus "TakeProfit3Level", and subtract one-third and two-thirds of "TradeDistance" from "EntryPrice" for "TakeProfit1Level" and "TakeProfit2Level".
We then call the "DrawDottedLine" function four times to draw horizontal lines: "ObjectPrefix + '_EntryLine'" at "EntryPrice" in "clrMagenta", and "ObjectPrefix + '_TP1Line'", "ObjectPrefix + '_TP2Line'", "ObjectPrefix + '_TP3Line'" at "TakeProfit1Level", "TakeProfit2Level", and "TakeProfit3Level" in "clrForestGreen", "clrGreen", and "clrDarkGreen", respectively, from "LineStartTime" to "LineEndTime".
For labeling, we set "LabelTime" to "LineEndTime" plus half a bar’s duration using "PeriodSeconds". We create "EntryLabelText" as "BUY (" or "SELL (" based on "PatternDirection", appending "EntryPrice" formatted by "DoubleToString" with "_Digits", and call "DrawTextLabel" for "ObjectPrefix + '_EntryLabel'" at "EntryPrice" in "clrMagenta".
Similarly, we define "TP1LabelText", "TP2LabelText", and "TP3LabelText" with "TakeProfit1Level", "TakeProfit2Level", and "TakeProfit3Level" formatted prices, calling "DrawTextLabel" for each at their respective levels in "clrForestGreen", "clrGreen", and "clrDarkGreen", all with font size 11 and placed above the price, enhancing trade level clarity. Here is the outcome.
Bearish pattern:
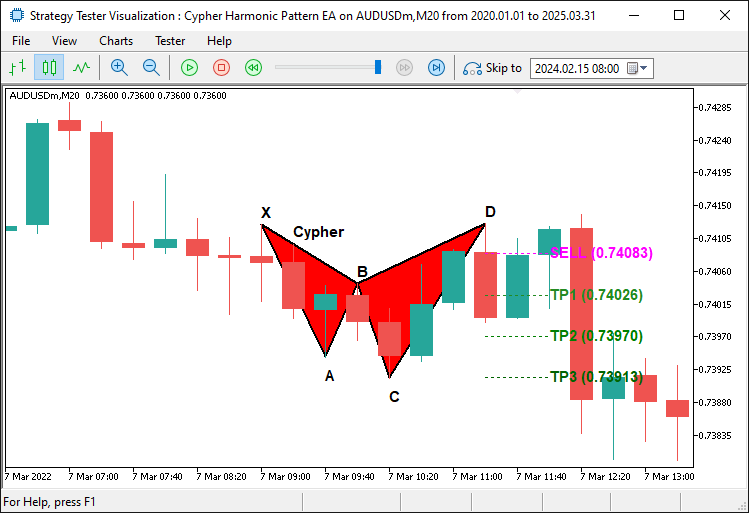
Bullish pattern:
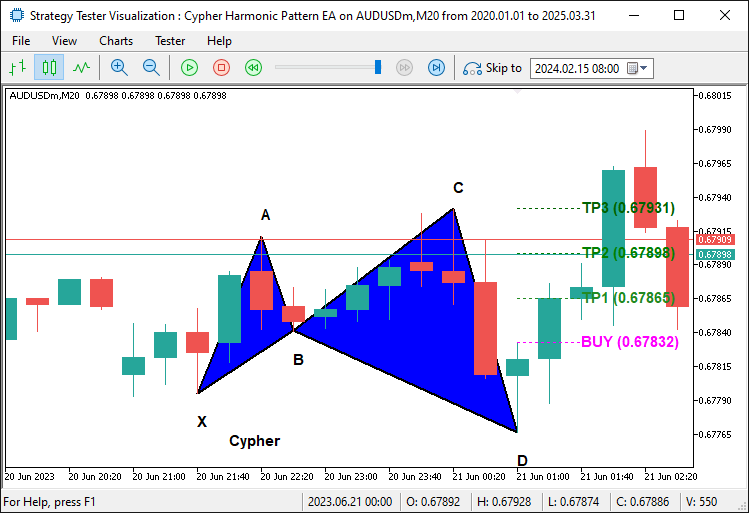
From the images, we can see that we have correctly mapped the trade levels. What we need to do now is initiate the actual trade positions and that is all.
//--- **Trading Logic**
//--- Check if trading is allowed and no position is already open
if(TradingEnabled && !PositionSelect(_Symbol)) {
   //--- Place a buy or sell order based on pattern type
   bool TradeSuccessful = (PatternDirection == "Bullish") ?
      obj_Trade.Buy(TradeVolume, _Symbol, EntryPrice, StopLossPrice, TakeProfitPrice, "Cypher Buy") :
      obj_Trade.Sell(TradeVolume, _Symbol, EntryPrice, StopLossPrice, TakeProfitPrice, "Cypher Sell");
   //--- Log the result of the trade attempt
   if(TradeSuccessful)
      Print(PatternDirection, " order opened successfully.");
   else
      Print(PatternDirection, " order failed: ", obj_Trade.ResultRetcodeDescription());
}

//--- Force the chart to update and show all drawn objects
ChartRedraw();
Here, we implement the trading logic to execute trades for the Cypher pattern when conditions are met. We check if "TradingEnabled" is true and no existing position is open for the current symbol using the PositionSelect function with _Symbol, ensuring trades are only placed when allowed and no conflicting positions exist. If both conditions are satisfied, we use a ternary operator to place a trade based on "PatternDirection": for a "Bullish" pattern, we call the "obj_Trade.Buy" function with parameters "TradeVolume", _Symbol, "EntryPrice", "StopLossPrice", "TakeProfitPrice", and a comment "Cypher Buy", while for a bearish pattern, we call "obj_Trade.Sell" with the same parameters but a comment "Cypher Sell", storing the result in "TradeSuccessful".
We then log the outcome using the Print function, outputting "PatternDirection" and "order opened successfully" if "TradeSuccessful" is true, or "order failed" with the error description from "obj_Trade.ResultRetcodeDescription" if false. Finally, we call the ChartRedraw function to force the MetaTrader 5 chart to update, ensuring all drawn objects, such as triangles, lines, and labels, are immediately visible to the user.
Lastly, we just need to delete the patterns from the chart when we remove the program.
//+------------------------------------------------------------------+
//| Expert deinitialization function                                 |
//+------------------------------------------------------------------+
//--- Runs when the EA stops (e.g., removed from chart)
void OnDeinit(const int reason) {
   //--- Remove all objects starting with "CY_" (our Cypher pattern objects)
   ObjectsDeleteAll(0, "CY_");
}
Within the OnDeinit event handler, we use the ObjectsDeleteAll function to remove all chart objects with names starting with the prefix "CY_", ensuring that all Cypher pattern-related visualizations, such as triangles, trend lines, and labels, are cleared from the chart, maintaining a clean workspace when the system is no longer active. Upon compilation, we have the following outcome.
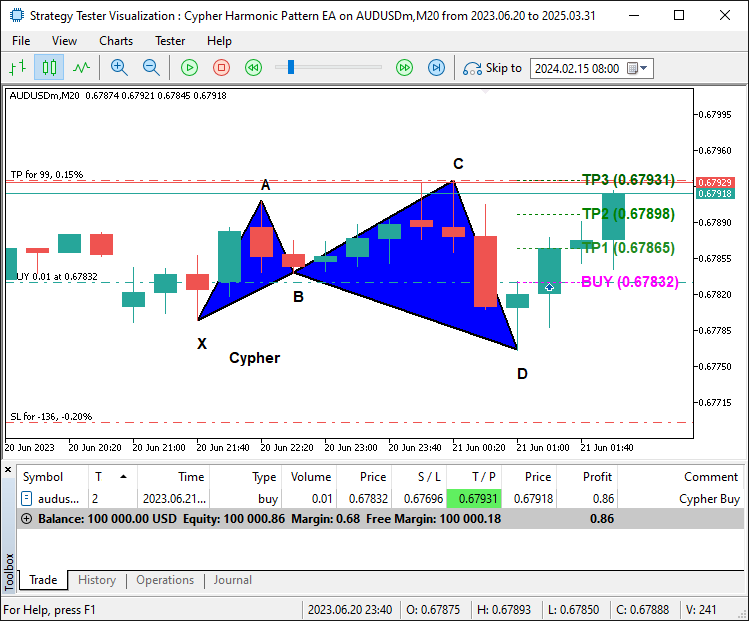
From the image, we can see that we plot the Cypher pattern and are still able to trade it accordingly once it is confirmed, hence achieving our objective of identifying, plotting, and trading the pattern. The thing that remains is backtesting the program, and that is handled in the next section.
Backtesting and Optimization
During initial backtesting, we identified a critical issue: the system was prone to repainting patterns. Repainting occurred when a Cypher pattern appeared valid on one bar but changed or disappeared as new price data arrived, leading to unreliable trade signals. This issue caused false positives, where trades were executed based on patterns that later proved invalid, negatively impacting performance. Here is an example of what we mean.
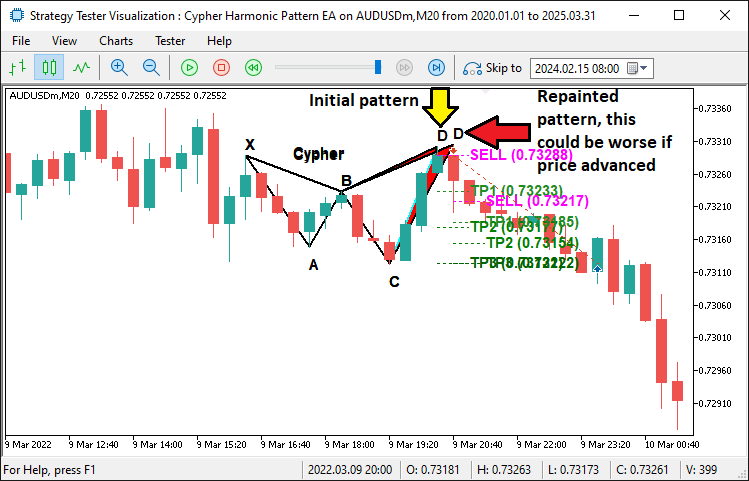
To address this, we implemented a pattern-locking mechanism, using global variables "g_patternFormationBar" and "g_lockedPatternX" to lock the pattern on detection and confirm it on the next bar, ensuring the X swing point remains consistent. This fix significantly reduced repainting, as confirmed by subsequent tests showing more stable pattern detection and fewer invalid trades. Here is a sample code snippet to lock the pattern to ensure we wait until the pattern is stable before trading it.
//--- If the pattern has changed, update the lock
g_patternFormationBar = CurrentBarIndex;
g_lockedPatternX = PointX.TimeOfSwing;
Print("Cypher pattern has changed; updating lock on bar ", CurrentBarIndex, ". Waiting for confirmation.");
return;
We add a confirmation logic to always wait until the pattern is confirmed and stable for an extra bar so that we don't enter the position early only to realize it is the start of the pattern formation. After adding the lock pattern, we can see the issue is now settled.
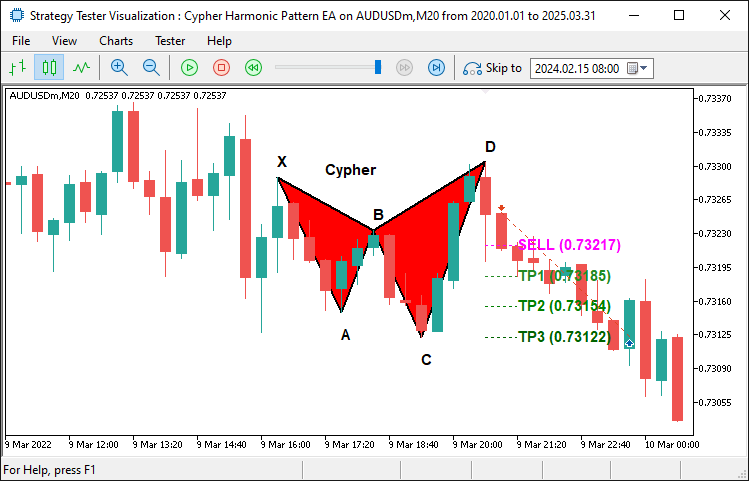
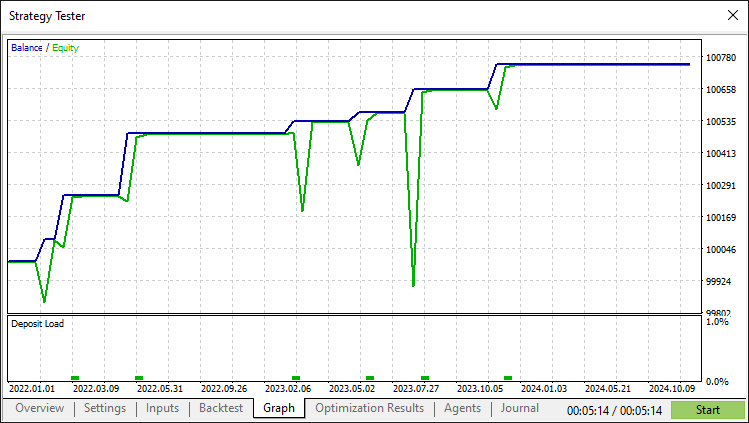
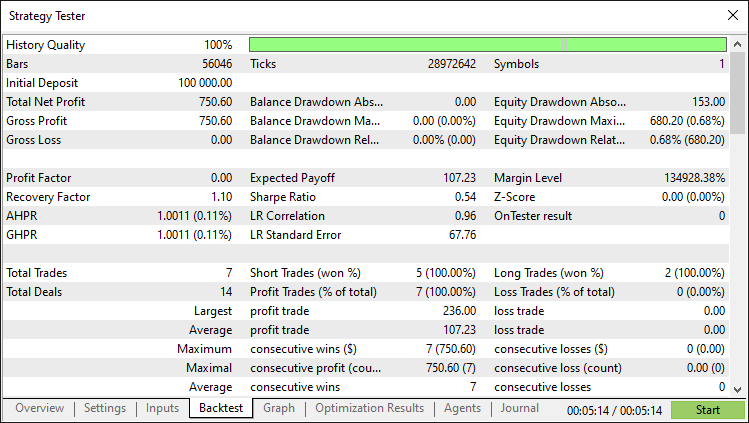
After the correction and thorough backtesting, we have the following results.
Backtest graph:
Backtest report:
Conclusion
In conclusion, we have successfully developed a MetaQuotes Language 5 Expert Advisor that detects and trades the Cypher Harmonic Pattern with precision. By integrating swing point detection, Fibonacci-based validation, comprehensive visualization, and a pattern-locking mechanism to prevent repainting, we created a robust system that dynamically adapts to market conditions.
Disclaimer: This article is for educational purposes only. Trading involves significant financial risk, and market conditions can be unpredictable. While the strategy outlined provides a structured approach to harmonic trading, it does not guarantee profitability. Comprehensive backtesting and proper risk management are essential before deploying this program in a live environment.
By implementing these techniques, you can refine your harmonic pattern trading skills, enhance your technical analysis, and advance your algorithmic trading strategies. Best of luck on your trading journey!
 Websockets for MetaTrader 5: Asynchronous client connections with the Windows API
 Atmosphere Clouds Model Optimization (ACMO): Practice
 Building a Custom Market Regime Detection System in MQL5 (Part 2): Expert Advisor
 Neural Networks in Trading: Exploring the Local Structure of Data
- Free trading apps
- Over 8,000 signals for copying
- Economic news for exploring financial markets
You agree to website policy and terms of use