
Price Action Analysis Toolkit Development (Part 13): RSI Sentinel Tool
Contents
Introduction
Divergence is a concept in technical analysis where the movement of an indicator, such as momentum or oscillators, deviates from the movement of price. Essentially, when the price forms new highs or lows that aren’t reflected by the indicator, it can signal a weakening trend and potentially foreshadow a reversal or a change in momentum. RSI divergence is a simple way to spot potential market reversals. When price moves in one direction while the RSI goes in another, it could signal a change in trend. However, scanning your charts by hand for these signals can be slow and prone to errors. That's where automation comes in.
In this article, we'll build an MQL5 Expert Advisor that automatically detects RSI divergence signals. The EA will mark these signals with clear arrows on your chart and provide a brief summary so you can quickly see what’s happening. Whether you're a beginner or a seasoned trader, this tool helps you spot trading opportunities that you can validate before executing trades, all without spending hours on manual analysis. Let’s dive in and see how this RSI Divergence EA can simplify your trading process.
Strategy Overview
Understanding RSI Divergence
RSI divergence occurs when the Relative Strength Index (RSI) moves in a different direction than the asset’s price, signaling a potential shift in price momentum. This contrast between RSI and price action is a key indicator that traders use to anticipate market reversals or trend continuations. Typically, the RSI follows the price’s momentum, thereby confirming prevailing trends. However, when divergence appears, it reveals a discrepancy that often precedes a significant price movement. Recognizing these signals early can be crucial for timing market entries and exits.
In the context of RSI divergence, there are two main types
1. Regular RSI Divergence
Regular RSI divergence is generally seen as a reversal signal. It indicates that the current trend is losing strength and may be about to reverse.
- Regular Bullish RSI Divergence
Occurs when the price forms a lower low while the RSI forms a higher low. This suggests that, although the price is declining, the momentum is beginning to shift upward, hinting at a potential reversal to an uptrend.

Fig 1. Bullish Divergence
- Regular Bearish RSI Divergence
Happens when the price forms a higher high while the RSI forms a lower high. Despite the rising price, the weakening momentum (as shown by the RSI) signals that a downturn could be on the horizon.
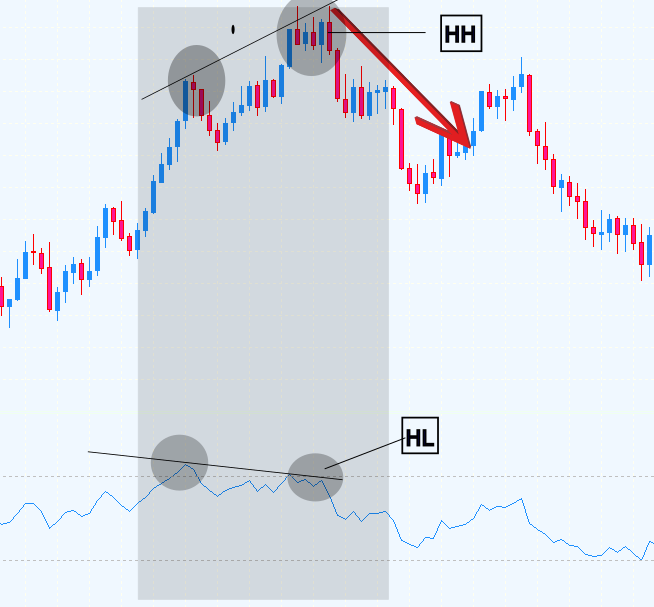
Fig 2. Bearish Divergence
2. Hidden RSI Divergence
Hidden RSI divergence is interpreted as a signal for trend continuation, rather than an impending reversal. It confirms that the current trend still has strength, even when the RSI and price temporarily diverge.
- Hidden Bullish RSI Divergence: In an uptrend, if the price forms a higher low while the RSI forms a lower low, it indicates that the correction is only temporary and that the uptrend is likely to continue.
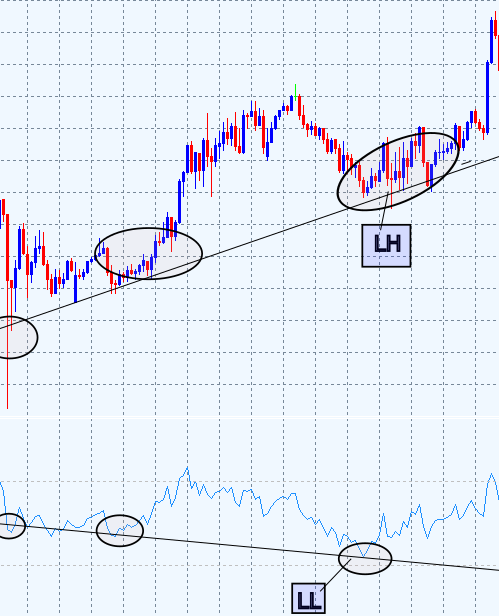
Fig 3. Hidden bullish divergence
- Hidden Bearish RSI Divergence: In a downtrend, when the price forms a lower high while the RSI forms a higher high, it confirms the strength of the downtrend and suggests that the downward movement is likely to persist.
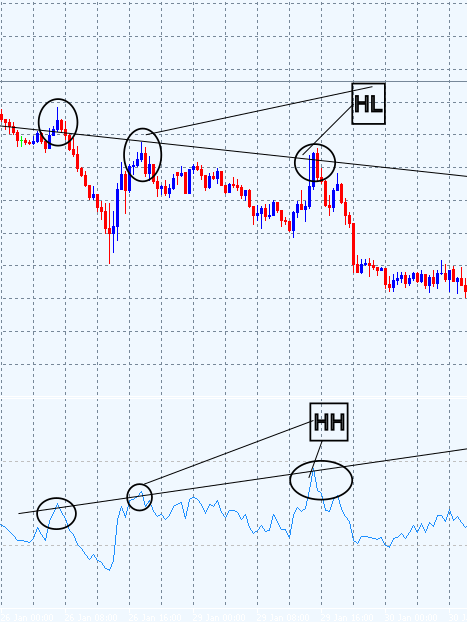
Fig 4. Hidden bearish divergence
Below is a summary table that encapsulates the key differences between the types of RSI divergence:
| RSI Divergence Type | Price Action | RSI Action | Signal Type | Expectation |
|---|---|---|---|---|
| Regular Bullish | Low Low(LL) | Higher Low(HL) | Reversal Up | Downtrend to Uptrend |
| Regular Bearish | Higher High(HH) | Lower Higher(LH) | Reversal Down | Uptrend to Downtrend |
| Hidden Bullish | High Low(HL) | Low Low(LL) | Continuation Up | Uptrend Continues |
| Hidden Bearish | Lower High (LH) | High High(HH) | Continuation Down | Downtrend Continues |
In summary, this EA continuously scans both price and RSI data over a defined lookback period to detect discrepancies between their movements, what we call RSI divergence.
Below is what it does:
1. Data Collection and Preparation
The EA gathers RSI values along with corresponding price data (lows, highs, closes, and time) from recent bars. This ensures that the analysis is always based on the latest, complete information.2. Identifying Swing Points
It then determines local swing highs and lows in both the price and RSI data. These swing points serve as the reference markers for our divergence analysis.3. Detecting Regular Divergence
- Regular Bullish Divergence: The EA looks for instances where the price makes a lower low while the RSI forms a higher low, signaling that a downtrend may be losing momentum and could reverse upward.
- Regular Bearish Divergence: It also checks for situations where the price makes a higher high while the RSI forms a lower high, indicating that an uptrend might be nearing its end as momentum wanes.
- Hidden Bullish Divergence: In an uptrend, if the price forms a higher low but the RSI records a lower low, the EA identifies this as a sign that the overall upward trend is still strong despite a temporary pullback.
- Hidden Bearish Divergence: Conversely, during a downtrend, if the price makes a lower high while the RSI shows a higher high, it confirms that the downtrend is likely to continue.
5. Visual and Log Signal Generation
Once a divergence is detected, be it regular or hidden, the EA visually marks the event on the chart (using arrows and labels) and logs the signal's details for further analysis or backtesting. Check out for more about how it does the processes above in the Code Breakdown section below.
MQL5 Code
//+--------------------------------------------------------------------+
//|                                                RSI Divergence.mql5 |
//|                                 Copyright 2025, Christian Benjamin |
//|                                               https://www.mql5.com |
//+--------------------------------------------------------------------+
#property copyright "2025, MetaQuotes Software Corp."
#property link      "https://www.mql5.com/en/users/lynnchris"
#property version   "1.0"
#property strict

//---- Input parameters
input int    InpRSIPeriod             = 14;    // RSI period
input int    InpSwingLeft             = 1;     // Bars to the left for swing detection (relaxed)
input int    InpSwingRight            = 1;     // Bars to the right for swing detection (relaxed)
input int    InpLookback              = 100;   // Number of bars to scan for divergence
input int    InpEvalBars              = 5;     // Bars after which to evaluate a signal
input int    InpMinBarsBetweenSignals = 1;     // Minimum bars between same-type signals (allows frequent re-entry)
input double InpArrowOffset           = 3.0;   // Arrow offset (in points) for display
input double InpMinSwingDiffPct       = 0.05;  // Lower minimum % difference to qualify as a swing
input double InpMinRSIDiff            = 1.0;   // Lower minimum difference in RSI between swing points

// Optional RSI threshold filter for bullish divergence (disabled by default)
input bool   InpUseRSIThreshold       = false; // If true, require earlier RSI swing to be oversold for bullish divergence
input double InpRSIOversold           = 30;    // RSI oversold level
input double InpRSIOverbought         = 70;    // RSI overbought level (if needed for bearish)

//---- Global variables
int      rsiHandle;         // Handle for the RSI indicator
double   rsiBuffer[];       // Buffer for RSI values
double   lowBuffer[];       // Buffer for low prices
double   highBuffer[];      // Buffer for high prices
double   closeBuffer[];     // Buffer for close prices
datetime timeBuffer[];       // Buffer for bar times
int      g_totalBars = 0;   // Number of bars in our copied arrays
datetime lastBarTime = 0;   // Time of last closed bar

//---- Structure to hold signal information
struct SignalInfo
  {
   string            type;         // e.g. "RegBearish Divergence", "HiddenBullish Divergence"
   int               barIndex;     // Bar index where the signal was generated
   datetime          signalTime;   // Time of the signal bar
   double            signalPrice;  // Price used for the signal (swing high for bearish, swing low for bullish)
  };

SignalInfo signals[];  // Global array to store signals

//+------------------------------------------------------------------+
//| Expert initialization function                                   |
//+------------------------------------------------------------------+
int OnInit()
  {
   rsiHandle = iRSI(_Symbol, _Period, InpRSIPeriod, PRICE_CLOSE);
   if(rsiHandle == INVALID_HANDLE)
     {
      Print("Error creating RSI handle");
      return(INIT_FAILED);
     }
   return(INIT_SUCCEEDED);
  }

//+------------------------------------------------------------------+
//| Expert deinitialization function                                 |
//+------------------------------------------------------------------+
void OnDeinit(const int reason)
  {
   if(rsiHandle != INVALID_HANDLE)
      IndicatorRelease(rsiHandle);
   EvaluateSignalsAndPrint();
  }

//+------------------------------------------------------------------+
//| Expert tick function                                             |
//+------------------------------------------------------------------+
void OnTick()
  {
// Process once per new closed candle (using bar1's time)
   datetime currentBarTime = iTime(_Symbol, _Period, 1);
   if(currentBarTime == lastBarTime)
      return;
   lastBarTime = currentBarTime;

//--- Copy RSI data
   ArrayResize(rsiBuffer, InpLookback);
   ArraySetAsSeries(rsiBuffer, true);
   if(CopyBuffer(rsiHandle, 0, 0, InpLookback, rsiBuffer) <= 0)
     {
      Print("Error copying RSI data");
      return;
     }

//--- Copy price and time data
   ArrayResize(lowBuffer, InpLookback);
   ArrayResize(highBuffer, InpLookback);
   ArrayResize(closeBuffer, InpLookback);
   ArraySetAsSeries(lowBuffer, true);
   ArraySetAsSeries(highBuffer, true);
   ArraySetAsSeries(closeBuffer, true);
   if(CopyLow(_Symbol, _Period, 0, InpLookback, lowBuffer) <= 0 ||
      CopyHigh(_Symbol, _Period, 0, InpLookback, highBuffer) <= 0 ||
      CopyClose(_Symbol, _Period, 0, InpLookback, closeBuffer) <= 0)
     {
      Print("Error copying price data");
      return;
     }

   ArrayResize(timeBuffer, InpLookback);
   ArraySetAsSeries(timeBuffer, true);
   if(CopyTime(_Symbol, _Period, 0, InpLookback, timeBuffer) <= 0)
     {
      Print("Error copying time data");
      return;
     }

   g_totalBars = InpLookback;

//--- Identify swing lows and swing highs
   int swingLows[];
   int swingHighs[];
   int startIndex = InpSwingLeft;
   int endIndex   = g_totalBars - InpSwingRight;
   for(int i = startIndex; i < endIndex; i++)
     {
      if(IsSignificantSwingLow(i, InpSwingLeft, InpSwingRight))
        {
         ArrayResize(swingLows, ArraySize(swingLows) + 1);
         swingLows[ArraySize(swingLows) - 1] = i;
        }
      if(IsSignificantSwingHigh(i, InpSwingLeft, InpSwingRight))
        {
         ArrayResize(swingHighs, ArraySize(swingHighs) + 1);
         swingHighs[ArraySize(swingHighs) - 1] = i;
        }
     }

//--- Bearish Divergence (using swing highs)
   if(ArraySize(swingHighs) >= 2)
     {
      ArraySort(swingHighs); // ascending order: index 0 is most recent
      int recent   = swingHighs[0];
      int previous = swingHighs[1];

      // Regular Bearish Divergence: Price makes a higher high while RSI makes a lower high
      if(highBuffer[recent] > highBuffer[previous] &&
         rsiBuffer[recent] < rsiBuffer[previous] &&
         (rsiBuffer[previous] - rsiBuffer[recent]) >= InpMinRSIDiff)
        {
         Print("Regular Bearish Divergence detected at bar ", recent);
         DisplaySignal("RegBearish Divergence", recent);
        }
      // Hidden Bearish Divergence: Price makes a lower high while RSI makes a higher high
      else
         if(highBuffer[recent] < highBuffer[previous] &&
            rsiBuffer[recent] > rsiBuffer[previous] &&
            (rsiBuffer[recent] - rsiBuffer[previous]) >= InpMinRSIDiff)
           {
            Print("Hidden Bearish Divergence detected at bar ", recent);
            DisplaySignal("HiddenBearish Divergence", recent);
           }
     }

//--- Bullish Divergence (using swing lows)
   if(ArraySize(swingLows) >= 2)
     {
      ArraySort(swingLows); // ascending order: index 0 is most recent
      int recent   = swingLows[0];
      int previous = swingLows[1];

      // Regular Bullish Divergence: Price makes a lower low while RSI makes a higher low
      if(lowBuffer[recent] < lowBuffer[previous] &&
         rsiBuffer[recent] > rsiBuffer[previous] &&
         (rsiBuffer[recent] - rsiBuffer[previous]) >= InpMinRSIDiff)
        {
         // Optionally require the earlier swing's RSI be oversold
         if(!InpUseRSIThreshold || rsiBuffer[previous] <= InpRSIOversold)
           {
            Print("Regular Bullish Divergence detected at bar ", recent);
            DisplaySignal("RegBullish Divergence", recent);
           }
        }
      // Hidden Bullish Divergence: Price makes a higher low while RSI makes a lower low
      else
         if(lowBuffer[recent] > lowBuffer[previous] &&
            rsiBuffer[recent] < rsiBuffer[previous] &&
            (rsiBuffer[previous] - rsiBuffer[recent]) >= InpMinRSIDiff)
           {
            Print("Hidden Bullish Divergence detected at bar ", recent);
            DisplaySignal("HiddenBullish Divergence", recent);
           }
     }
  }

//+------------------------------------------------------------------------+
//| IsSignificantSwingLow: Determines if the bar at 'index' is a swing low |
//+------------------------------------------------------------------------+
bool IsSignificantSwingLow(int index, int left, int right)
  {
   double currentLow = lowBuffer[index];
// Check left side for a local minimum condition
   for(int i = index - left; i < index; i++)
     {
      if(i < 0)
         continue;
      double pctDiff = MathAbs((lowBuffer[i] - currentLow) / currentLow) * 100.0;
      if(lowBuffer[i] < currentLow && pctDiff > InpMinSwingDiffPct)
         return false;
     }
// Check right side for a local minimum condition
   for(int i = index + 1; i <= index + right; i++)
     {
      if(i >= g_totalBars)
         break;
      double pctDiff = MathAbs((lowBuffer[i] - currentLow) / currentLow) * 100.0;
      if(lowBuffer[i] < currentLow && pctDiff > InpMinSwingDiffPct)
         return false;
     }
   return true;
  }

//+--------------------------------------------------------------------------+
//| IsSignificantSwingHigh: Determines if the bar at 'index' is a swing high |
//+--------------------------------------------------------------------------+
bool IsSignificantSwingHigh(int index, int left, int right)
  {
   double currentHigh = highBuffer[index];
// Check left side for a local maximum condition
   for(int i = index - left; i < index; i++)
     {
      if(i < 0)
         continue;
      double pctDiff = MathAbs((currentHigh - highBuffer[i]) / currentHigh) * 100.0;
      if(highBuffer[i] > currentHigh && pctDiff > InpMinSwingDiffPct)
         return false;
     }
// Check right side for a local maximum condition
   for(int i = index + 1; i <= index + right; i++)
     {
      if(i >= g_totalBars)
         break;
      double pctDiff = MathAbs((currentHigh - highBuffer[i]) / currentHigh) * 100.0;
      if(highBuffer[i] > currentHigh && pctDiff > InpMinSwingDiffPct)
         return false;
     }
   return true;
  }

//+------------------------------------------------------------------+
//| DisplaySignal: Draws an arrow on the chart and records the signal|
//+------------------------------------------------------------------+
void DisplaySignal(string signalText, int barIndex)
  {
// Prevent duplicate signals on the same bar (or too close)
   for(int i = 0; i < ArraySize(signals); i++)
     {
      if(StringFind(signals[i].type, signalText) != -1)
         if(MathAbs(signals[i].barIndex - barIndex) < InpMinBarsBetweenSignals)
            return;
     }

// Update a "LatestSignal" label for regular signals.
   if(StringFind(signalText, "Reg") != -1)
     {
      string labelName = "LatestSignal";
      if(ObjectFind(0, labelName) == -1)
        {
         if(!ObjectCreate(0, labelName, OBJ_LABEL, 0, 0, 0))
           {
            Print("Failed to create LatestSignal label");
            return;
           }
         ObjectSetInteger(0, labelName, OBJPROP_CORNER, 0);
         ObjectSetInteger(0, labelName, OBJPROP_XDISTANCE, 10);
         ObjectSetInteger(0, labelName, OBJPROP_YDISTANCE, 20);
         ObjectSetInteger(0, labelName, OBJPROP_COLOR, clrWhite);
        }
      ObjectSetString(0, labelName, OBJPROP_TEXT, signalText);
     }

// Create an arrow object for the signal.
   string arrowName = "Arrow_" + signalText + "_" + IntegerToString(barIndex);
   if(ObjectFind(0, arrowName) < 0)
     {
      int arrowCode = 0;
      double arrowPrice = 0.0;
      color arrowColor = clrWhite;
      double point = SymbolInfoDouble(_Symbol, SYMBOL_POINT);

      if(StringFind(signalText, "Bullish") != -1)
        {
         arrowCode  = 233; // Wingdings up arrow
         arrowColor = clrLime;
         arrowPrice = lowBuffer[barIndex] - (InpArrowOffset * point);
        }
      else
         if(StringFind(signalText, "Bearish") != -1)
           {
            arrowCode  = 234; // Wingdings down arrow
            arrowColor = clrRed;
            arrowPrice = highBuffer[barIndex] + (InpArrowOffset * point);
           }

      if(!ObjectCreate(0, arrowName, OBJ_ARROW, 0, timeBuffer[barIndex], arrowPrice))
        {
         Print("Failed to create arrow object ", arrowName);
         return;
        }
      ObjectSetInteger(0, arrowName, OBJPROP_COLOR, arrowColor);
      ObjectSetInteger(0, arrowName, OBJPROP_ARROWCODE, arrowCode);
     }

// Record the signal for evaluation.
   SignalInfo sig;
   sig.type = signalText;
   sig.barIndex = barIndex;
   sig.signalTime = timeBuffer[barIndex];
   if(StringFind(signalText, "Bullish") != -1)
      sig.signalPrice = lowBuffer[barIndex];
   else
      sig.signalPrice = highBuffer[barIndex];
   ArrayResize(signals, ArraySize(signals) + 1);
   signals[ArraySize(signals) - 1] = sig;

   UpdateSignalCountLabel();
  }

//+------------------------------------------------------------------+
//| UpdateSignalCountLabel: Updates a label showing signal counts    |
//+------------------------------------------------------------------+
void UpdateSignalCountLabel()
  {
   int regCount = 0, hidCount = 0;
   for(int i = 0; i < ArraySize(signals); i++)
     {
      if(StringFind(signals[i].type, "Reg") != -1)
         regCount++;
      else
         if(StringFind(signals[i].type, "Hidden") != -1)
            hidCount++;
     }
   string countText = "Regular Signals: " + IntegerToString(regCount) +
                      "\nHidden Signals: " + IntegerToString(hidCount);
   string countLabel = "SignalCount";
   if(ObjectFind(0, countLabel) == -1)
     {
      if(!ObjectCreate(0, countLabel, OBJ_LABEL, 0, 0, 0))
        {
         Print("Failed to create SignalCount label");
         return;
        }
      ObjectSetInteger(0, countLabel, OBJPROP_CORNER, 0);
      ObjectSetInteger(0, countLabel, OBJPROP_XDISTANCE, 10);
      ObjectSetInteger(0, countLabel, OBJPROP_YDISTANCE, 40);
      ObjectSetInteger(0, countLabel, OBJPROP_COLOR, clrYellow);
     }
   ObjectSetString(0, countLabel, OBJPROP_TEXT, countText);
  }

//+--------------------------------------------------------------------+
//| EvaluateSignalsAndPrint: After backtesting, prints signal accuracy |
//+--------------------------------------------------------------------+
void EvaluateSignalsAndPrint()
  {
   double closeAll[];
   int totalBars = CopyClose(_Symbol, _Period, 0, WHOLE_ARRAY, closeAll);
   if(totalBars <= 0)
     {
      Print("Error copying complete close data for evaluation");
      return;
     }
   ArraySetAsSeries(closeAll, true);

   int totalEvaluated = 0, regTotal = 0, hidTotal = 0;
   int regEval = 0, hidEval = 0;
   int regCorrect = 0, hidCorrect = 0;

   for(int i = 0; i < ArraySize(signals); i++)
     {
      int evalIndex = signals[i].barIndex - InpEvalBars;
      if(evalIndex < 0)
         continue;
      double evalClose = closeAll[evalIndex];

      if(StringFind(signals[i].type, "Bullish") != -1)
        {
         if(StringFind(signals[i].type, "Reg") != -1)
           {
            regTotal++;
            regEval++;
            if(evalClose > signals[i].signalPrice)
               regCorrect++;
           }
         else
            if(StringFind(signals[i].type, "Hidden") != -1)
              {
               hidTotal++;
               hidEval++;
               if(evalClose > signals[i].signalPrice)
                  hidCorrect++;
              }
         totalEvaluated++;
        }
      else
         if(StringFind(signals[i].type, "Bearish") != -1)
           {
            if(StringFind(signals[i].type, "Reg") != -1)
              {
               regTotal++;
               regEval++;
               if(evalClose < signals[i].signalPrice)
                  regCorrect++;
              }
            else
               if(StringFind(signals[i].type, "Hidden") != -1)
                 {
                  hidTotal++;
                  hidEval++;
                  if(evalClose < signals[i].signalPrice)
                     hidCorrect++;
                 }
            totalEvaluated++;
           }
     }

   double overallAccuracy = (totalEvaluated > 0) ? (double)(regCorrect + hidCorrect) / totalEvaluated * 100.0 : 0.0;
   double regAccuracy = (regEval > 0) ? (double)regCorrect / regEval * 100.0 : 0.0;
   double hidAccuracy = (hidEval > 0) ? (double)hidCorrect / hidEval * 100.0 : 0.0;

   Print("----- Backtest Signal Evaluation -----");
   Print("Total Signals Generated: ", ArraySize(signals));
   Print("Signals Evaluated: ", totalEvaluated);
   Print("Overall Accuracy: ", DoubleToString(overallAccuracy, 2), "%");
   Print("Regular Signals: ", regTotal, " | Evaluated: ", regEval, " | Accuracy: ", DoubleToString(regAccuracy, 2), "%");
   Print("Hidden Signals:  ", hidTotal, " | Evaluated: ", hidEval, " | Accuracy: ", DoubleToString(hidAccuracy, 2), "%");
  }
//+------------------------------------------------------------------+
Code Breakdown
1. Header Information and Input Parameters
At the very top of our script, we have a well-defined header that provides key information about the code.
File and Author Information
The header specifies the file name (RSI Divergence.mql5), the copyright notice, and a link to the author’s profile. This ensures proper attribution and gives users a reference point if they need to check for updates or additional documentation
Versioning and Compilation Directives
The #property directives set important properties such as the version number and the use of strict compilation rules (#property strict). This helps in maintaining consistency and reducing potential errors during development and deployment. Moving on, the input parameters section is essential for customization. These parameters allow you, or any user, to fine-tune the behavior of the divergence detection logic without modifying the core code. Below are a few highlights:
RSI and Swing Detection Parameters
- InpRSIPeriod: Sets the period for the RSI indicator.
- InpSwingLeft and InpSwingRight: Define how many bars on each side are considered when detecting swing points. Adjusting these values makes the swing detection either more relaxed or more strict.
Divergence and Signal Evaluation Settings
- InpLookback: Determines how many bars in the past the script will scan for divergences.
- InpEvalBars: Specifies the number of bars to wait before evaluating if a signal was successful.
- InpMinBarsBetweenSignals: Helps in avoiding duplicate signals by enforcing a minimum bar separation between similar signals.
Display Customizations
- InpArrowOffset: Sets the distance (in points) that arrows are offset from the swing point, enhancing visual clarity on the chart.
Optional RSI Threshold Filter
- InpUseRSIThreshold, along with InpRSIOversold and InpRSIOverbought, provides an extra layer of filtering. This ensures that, for bullish divergence, the earlier RSI swing is in the oversold region—if the user chooses to enable this filter.
//+------------------------------------------------------------------+
//|                                           RSI Divergence.mql5    |
//|                               Copyright 2025, Christian Benjamin |
//|                                             https://www.mql5.com |
//+------------------------------------------------------------------+
#property copyright "2025, MetaQuotes Software Corp."
#property link      "https://www.mql5.com/en/users/lynnchris"
#property version   "1.0"
#property strict

//---- Input parameters
input int    InpRSIPeriod             = 14;    // RSI period
input int    InpSwingLeft             = 1;     // Bars to the left for swing detection (relaxed)
input int    InpSwingRight            = 1;     // Bars to the right for swing detection (relaxed)
input int    InpLookback              = 100;   // Number of bars to scan for divergence
input int    InpEvalBars              = 5;     // Bars after which to evaluate a signal
input int    InpMinBarsBetweenSignals = 1;     // Minimum bars between same-type signals (allows frequent re-entry)
input double InpArrowOffset           = 3.0;   // Arrow offset (in points) for display
input double InpMinSwingDiffPct       = 0.05;  // Lower minimum % difference to qualify as a swing
input double InpMinRSIDiff            = 1.0;   // Lower minimum difference in RSI between swing points

// Optional RSI threshold filter for bullish divergence (disabled by default)
input bool   InpUseRSIThreshold       = false; // If true, require earlier RSI swing to be oversold for bullish divergence
input double InpRSIOversold           = 30;    // RSI oversold level
input double InpRSIOverbought         = 70;    // RSI overbought level (if needed for bearish)
2. Indicator Initialization
In this part, we initialize our RSI indicator. The OnInit() function creates a handle for the RSI indicator using parameters such as symbol, timeframe, and the RSI period specified by the user. This step is crucial because every subsequent operation depends on having a valid RSI handle to retrieve indicator data.
- The iRSI function is called with the necessary parameters.
- Error handling is implemented to catch any failure in creating the handle.
- The initialization ensures that our indicator is ready for data acquisition and analysis.
int OnInit()
{
   // Create the RSI indicator handle with the specified period
   rsiHandle = iRSI(_Symbol, _Period, InpRSIPeriod, PRICE_CLOSE);
   if(rsiHandle == INVALID_HANDLE)
   {
      Print("Error creating RSI handle");
      return(INIT_FAILED);
   }
   return(INIT_SUCCEEDED);
}
3. Data Acquisition on Each New Candle
In the OnTick() function, we check if a new candle has closed before processing. This ensures that our analysis is always working with completed data. We then copy arrays of RSI values, lows, highs, closes, and time data over a configurable lookback period. Setting the arrays as series makes sure that the data is ordered with the most recent bar at index 0.
- The code waits for the next closed candle to avoid processing incomplete data.
- RSI and price data are retrieved using functions like CopyBuffer and CopyLow/High/Close/Time.
- Using ArraySetAsSeries preserves the correct order for time series analysis.
void OnTick()
{
   // Process only once per new closed candle by comparing bar times
   datetime currentBarTime = iTime(_Symbol, _Period, 1);
   if(currentBarTime == lastBarTime)
      return;
   lastBarTime = currentBarTime;

   // Copy RSI data for a given lookback period
   ArrayResize(rsiBuffer, InpLookback);
   ArraySetAsSeries(rsiBuffer, true);
   if(CopyBuffer(rsiHandle, 0, 0, InpLookback, rsiBuffer) <= 0)
   {
      Print("Error copying RSI data");
      return;
   }

   // Copy price data (lows, highs, closes) and time data for analysis
   ArrayResize(lowBuffer, InpLookback);
   ArrayResize(highBuffer, InpLookback);
   ArrayResize(closeBuffer, InpLookback);
   ArraySetAsSeries(lowBuffer, true);
   ArraySetAsSeries(highBuffer, true);
   ArraySetAsSeries(closeBuffer, true);
   if(CopyLow(_Symbol, _Period, 0, InpLookback, lowBuffer) <= 0 ||
      CopyHigh(_Symbol, _Period, 0, InpLookback, highBuffer) <= 0 ||
      CopyClose(_Symbol, _Period, 0, InpLookback, closeBuffer) <= 0)
   {
      Print("Error copying price data");
      return;
   }

   ArrayResize(timeBuffer, InpLookback);
   ArraySetAsSeries(timeBuffer, true);
   if(CopyTime(_Symbol, _Period, 0, InpLookback, timeBuffer) <= 0)
   {
      Print("Error copying time data");
      return;
   }

   g_totalBars = InpLookback;

   // (Further processing follows here...)
}
4. Swing Detection (Identifying Swing Lows and Swing Highs)
Before we can detect divergences, we must first pinpoint significant swing points. Two helper functions, IsSignificantSwingLow and IsSignificantSwingHigh, are used to identify local minimums and maximums. They do this by comparing a bar’s low or high with its neighboring bars within a given window and checking that the percentage difference meets a set threshold.- The functions check both left and right of the current bar.
- They calculate the percentage difference to ensure that only significant swings are marked.
- This filtering reduces noise, ensuring that our divergence analysis focuses on meaningful market moves.
bool IsSignificantSwingLow(int index, int left, int right)
{
   double currentLow = lowBuffer[index];
   // Check left side for local minimum condition
   for(int i = index - left; i < index; i++)
   {
      if(i < 0) continue;
      double pctDiff = MathAbs((lowBuffer[i] - currentLow) / currentLow) * 100.0;
      if(lowBuffer[i] < currentLow && pctDiff > InpMinSwingDiffPct)
         return false;
   }
   // Check right side for local minimum condition
   for(int i = index + 1; i <= index + right; i++)
   {
      if(i >= g_totalBars) break;
      double pctDiff = MathAbs((lowBuffer[i] - currentLow) / currentLow) * 100.0;
      if(lowBuffer[i] < currentLow && pctDiff > InpMinSwingDiffPct)
         return false;
   }
   return true;
}

bool IsSignificantSwingHigh(int index, int left, int right)
{
   double currentHigh = highBuffer[index];
   // Check left side for local maximum condition
   for(int i = index - left; i < index; i++)
   {
      if(i < 0) continue;
      double pctDiff = MathAbs((currentHigh - highBuffer[i]) / currentHigh) * 100.0;
      if(highBuffer[i] > currentHigh && pctDiff > InpMinSwingDiffPct)
         return false;
   }
   // Check right side for local maximum condition
   for(int i = index + 1; i <= index + right; i++)
   {
      if(i >= g_totalBars) break;
      double pctDiff = MathAbs((currentHigh - highBuffer[i]) / currentHigh) * 100.0;
      if(highBuffer[i] > currentHigh && pctDiff > InpMinSwingDiffPct)
         return false;
   }
   return true;
}
5. Divergence Detection: Bearish and Bullish Divergences
Once swing points are identified, the algorithm compares recent swings to detect divergences. For bearish divergence, the code looks at two swing highs and checks if the price is making a higher high while the RSI shows a lower high (or vice versa for hidden bearish divergence). For bullish divergence, it similarly compares two swing lows. An optional RSI threshold can further validate bullish signals by ensuring the earlier RSI reading is in the oversold territory.
- Two recent swing points (either highs or lows) are used for divergence analysis.
- The conditions for regular and hidden divergences are clearly separated.
- Optional parameters (like the RSI oversold condition) provide additional filtering for signal strength.
// --- Bearish Divergence (using swing highs)
if(ArraySize(swingHighs) >= 2)
{
   ArraySort(swingHighs); // Ensure ascending order: index 0 is most recent
   int recent   = swingHighs[0];
   int previous = swingHighs[1];

   // Regular Bearish Divergence: Price makes a higher high while RSI makes a lower high
   if(highBuffer[recent] > highBuffer[previous] &&
      rsiBuffer[recent] < rsiBuffer[previous] &&
      (rsiBuffer[previous] - rsiBuffer[recent]) >= InpMinRSIDiff)
   {
      Print("Regular Bearish Divergence detected at bar ", recent);
      DisplaySignal("RegBearish Divergence", recent);
   }
   // Hidden Bearish Divergence: Price makes a lower high while RSI makes a higher high
   else if(highBuffer[recent] < highBuffer[previous] &&
           rsiBuffer[recent] > rsiBuffer[previous] &&
           (rsiBuffer[recent] - rsiBuffer[previous]) >= InpMinRSIDiff)
   {
      Print("Hidden Bearish Divergence detected at bar ", recent);
      DisplaySignal("HiddenBearish Divergence", recent);
   }
}

// --- Bullish Divergence (using swing lows)
if(ArraySize(swingLows) >= 2)
{
   ArraySort(swingLows); // Ensure ascending order: index 0 is most recent
   int recent   = swingLows[0];
   int previous = swingLows[1];

   // Regular Bullish Divergence: Price makes a lower low while RSI makes a higher low
   if(lowBuffer[recent] < lowBuffer[previous] &&
      rsiBuffer[recent] > rsiBuffer[previous] &&
      (rsiBuffer[recent] - rsiBuffer[previous]) >= InpMinRSIDiff)
   {
      // Optionally require the earlier RSI swing to be oversold
      if(!InpUseRSIThreshold || rsiBuffer[previous] <= InpRSIOversold)
      {
         Print("Regular Bullish Divergence detected at bar ", recent);
         DisplaySignal("RegBullish Divergence", recent);
      }
   }
   // Hidden Bullish Divergence: Price makes a higher low while RSI makes a lower low
   else if(lowBuffer[recent] > lowBuffer[previous] &&
           rsiBuffer[recent] < rsiBuffer[previous] &&
           (rsiBuffer[previous] - rsiBuffer[recent]) >= InpMinRSIDiff)
   {
      Print("Hidden Bullish Divergence detected at bar ", recent);
      DisplaySignal("HiddenBullish Divergence", recent);
   }
}
6. Signal Display and Recording
When a divergence is detected, it’s important to mark the signal visually and record its details for later evaluation. The DisplaySignal() function not only creates an arrow on the chart (using different arrow codes and colors for bullish and bearish signals) but also updates a label for the latest signal and stores the signal’s metadata in a global array. This systematic recording enables later backtesting of the strategy.
- Duplicate signals are prevented by checking if a signal for a similar bar already exists.
- Visual cues like arrows and labels enhance the readability of the chart.
- Every signal is stored with details such as type, bar index, time, and price, facilitating later performance evaluation.
void DisplaySignal(string signalText, int barIndex)
{
   // Prevent duplicate signals on the same or nearby bars
   for(int i = 0; i < ArraySize(signals); i++)
   {
      if(StringFind(signals[i].type, signalText) != -1)
         if(MathAbs(signals[i].barIndex - barIndex) < InpMinBarsBetweenSignals)
            return;
   }

   // Update a label for the latest regular signal
   if(StringFind(signalText, "Reg") != -1)
   {
      string labelName = "LatestSignal";
      if(ObjectFind(0, labelName) == -1)
      {
         if(!ObjectCreate(0, labelName, OBJ_LABEL, 0, 0, 0))
         {
            Print("Failed to create LatestSignal label");
            return;
         }
         ObjectSetInteger(0, labelName, OBJPROP_CORNER, 0);
         ObjectSetInteger(0, labelName, OBJPROP_XDISTANCE, 10);
         ObjectSetInteger(0, labelName, OBJPROP_YDISTANCE, 20);
         ObjectSetInteger(0, labelName, OBJPROP_COLOR, clrWhite);
      }
      ObjectSetString(0, labelName, OBJPROP_TEXT, signalText);
   }

   // Create an arrow object to mark the signal on the chart
   string arrowName = "Arrow_" + signalText + "_" + IntegerToString(barIndex);
   if(ObjectFind(0, arrowName) < 0)
   {
      int arrowCode = 0;
      double arrowPrice = 0.0;
      color arrowColor = clrWhite;
      double point = SymbolInfoDouble(_Symbol, SYMBOL_POINT);

      if(StringFind(signalText, "Bullish") != -1)
      {
         arrowCode  = 233; // Wingdings up arrow
         arrowColor = clrLime;
         arrowPrice = lowBuffer[barIndex] - (InpArrowOffset * point);
      }
      else if(StringFind(signalText, "Bearish") != -1)
      {
         arrowCode  = 234; // Wingdings down arrow
         arrowColor = clrRed;
         arrowPrice = highBuffer[barIndex] + (InpArrowOffset * point);
      }

      if(!ObjectCreate(0, arrowName, OBJ_ARROW, 0, timeBuffer[barIndex], arrowPrice))
      {
         Print("Failed to create arrow object ", arrowName);
         return;
      }
      ObjectSetInteger(0, arrowName, OBJPROP_COLOR, arrowColor);
      ObjectSetInteger(0, arrowName, OBJPROP_ARROWCODE, arrowCode);
   }

   // Record the signal details for later backtesting evaluation
   SignalInfo sig;
   sig.type = signalText;
   sig.barIndex = barIndex;
   sig.signalTime = timeBuffer[barIndex];
   if(StringFind(signalText, "Bullish") != -1)
      sig.signalPrice = lowBuffer[barIndex];
   else
      sig.signalPrice = highBuffer[barIndex];
   ArrayResize(signals, ArraySize(signals) + 1);
   signals[ArraySize(signals) - 1] = sig;

   UpdateSignalCountLabel();
}
Backtest Evaluation on Deinitialization
Finally, the EvaluateSignalsAndPrint() function is called when the expert is deinitialized. This function retrospectively evaluates all recorded signals by comparing the price movement a few bars after the signal against the signal’s recorded price. It calculates the accuracy for both regular and hidden signals, providing valuable feedback on the performance of our divergence strategy.
- The function retrieves complete historical close data.
- Each signal is evaluated after a fixed number of bars (as set by InpEvalBars).
- Accuracy metrics are computed for overall signals as well as separately for regular and hidden signals, aiding in performance validation.
void EvaluateSignalsAndPrint()
{
   double closeAll[];
   int totalBars = CopyClose(_Symbol, _Period, 0, WHOLE_ARRAY, closeAll);
   if(totalBars <= 0)
   {
      Print("Error copying complete close data for evaluation");
      return;
   }
   ArraySetAsSeries(closeAll, true);

   int totalEvaluated = 0, regTotal = 0, hidTotal = 0;
   int regEval = 0, hidEval = 0;
   int regCorrect = 0, hidCorrect = 0;

   for(int i = 0; i < ArraySize(signals); i++)
   {
      int evalIndex = signals[i].barIndex - InpEvalBars;
      if(evalIndex < 0)
         continue;
      double evalClose = closeAll[evalIndex];

      if(StringFind(signals[i].type, "Bullish") != -1)
      {
         if(StringFind(signals[i].type, "Reg") != -1)
         {
            regTotal++;
            regEval++;
            if(evalClose > signals[i].signalPrice)
               regCorrect++;
         }
         else if(StringFind(signals[i].type, "Hidden") != -1)
         {
            hidTotal++;
            hidEval++;
            if(evalClose > signals[i].signalPrice)
               hidCorrect++;
         }
         totalEvaluated++;
      }
      else if(StringFind(signals[i].type, "Bearish") != -1)
      {
         if(StringFind(signals[i].type, "Reg") != -1)
         {
            regTotal++;
            regEval++;
            if(evalClose < signals[i].signalPrice)
               regCorrect++;
         }
         else if(StringFind(signals[i].type, "Hidden") != -1)
         {
            hidTotal++;
            hidEval++;
            if(evalClose < signals[i].signalPrice)
               hidCorrect++;
         }
         totalEvaluated++;
      }
   }

   double overallAccuracy = (totalEvaluated > 0) ? (double)(regCorrect + hidCorrect) / totalEvaluated * 100.0 : 0.0;
   double regAccuracy = (regEval > 0) ? (double)regCorrect / regEval * 100.0 : 0.0;
   double hidAccuracy = (hidEval > 0) ? (double)hidCorrect / hidEval * 100.0 : 0.0;

   Print("----- Backtest Signal Evaluation -----");
   Print("Total Signals Generated: ", ArraySize(signals));
   Print("Signals Evaluated: ", totalEvaluated);
   Print("Overall Accuracy: ", DoubleToString(overallAccuracy, 2), "%");
   Print("Regular Signals: ", regTotal, " | Evaluated: ", regEval, " | Accuracy: ", DoubleToString(regAccuracy, 2), "%");
   Print("Hidden Signals:  ", hidTotal, " | Evaluated: ", hidEval, " | Accuracy: ", DoubleToString(hidAccuracy, 2), "%");
}
Testing and Results
After successfully compiling your EA using MetaEditor, drag your EA onto the chart for testing. Make sure you're using a demo account to avoid risking real money. You can also add the RSI indicator to your chart for easy signal confirmation while testing your EA. To do this, navigate to the Indicators tab, select the RSI indicator under the Panels folder, and set your preferred parameters, making sure they match those in your EA. Check out the GIF below, which illustrates how to add the RSI indicator window on an MetaTrader 5 chart. You can also see the confirmed signal, a regular bullish divergence on a one-minute timeframe.
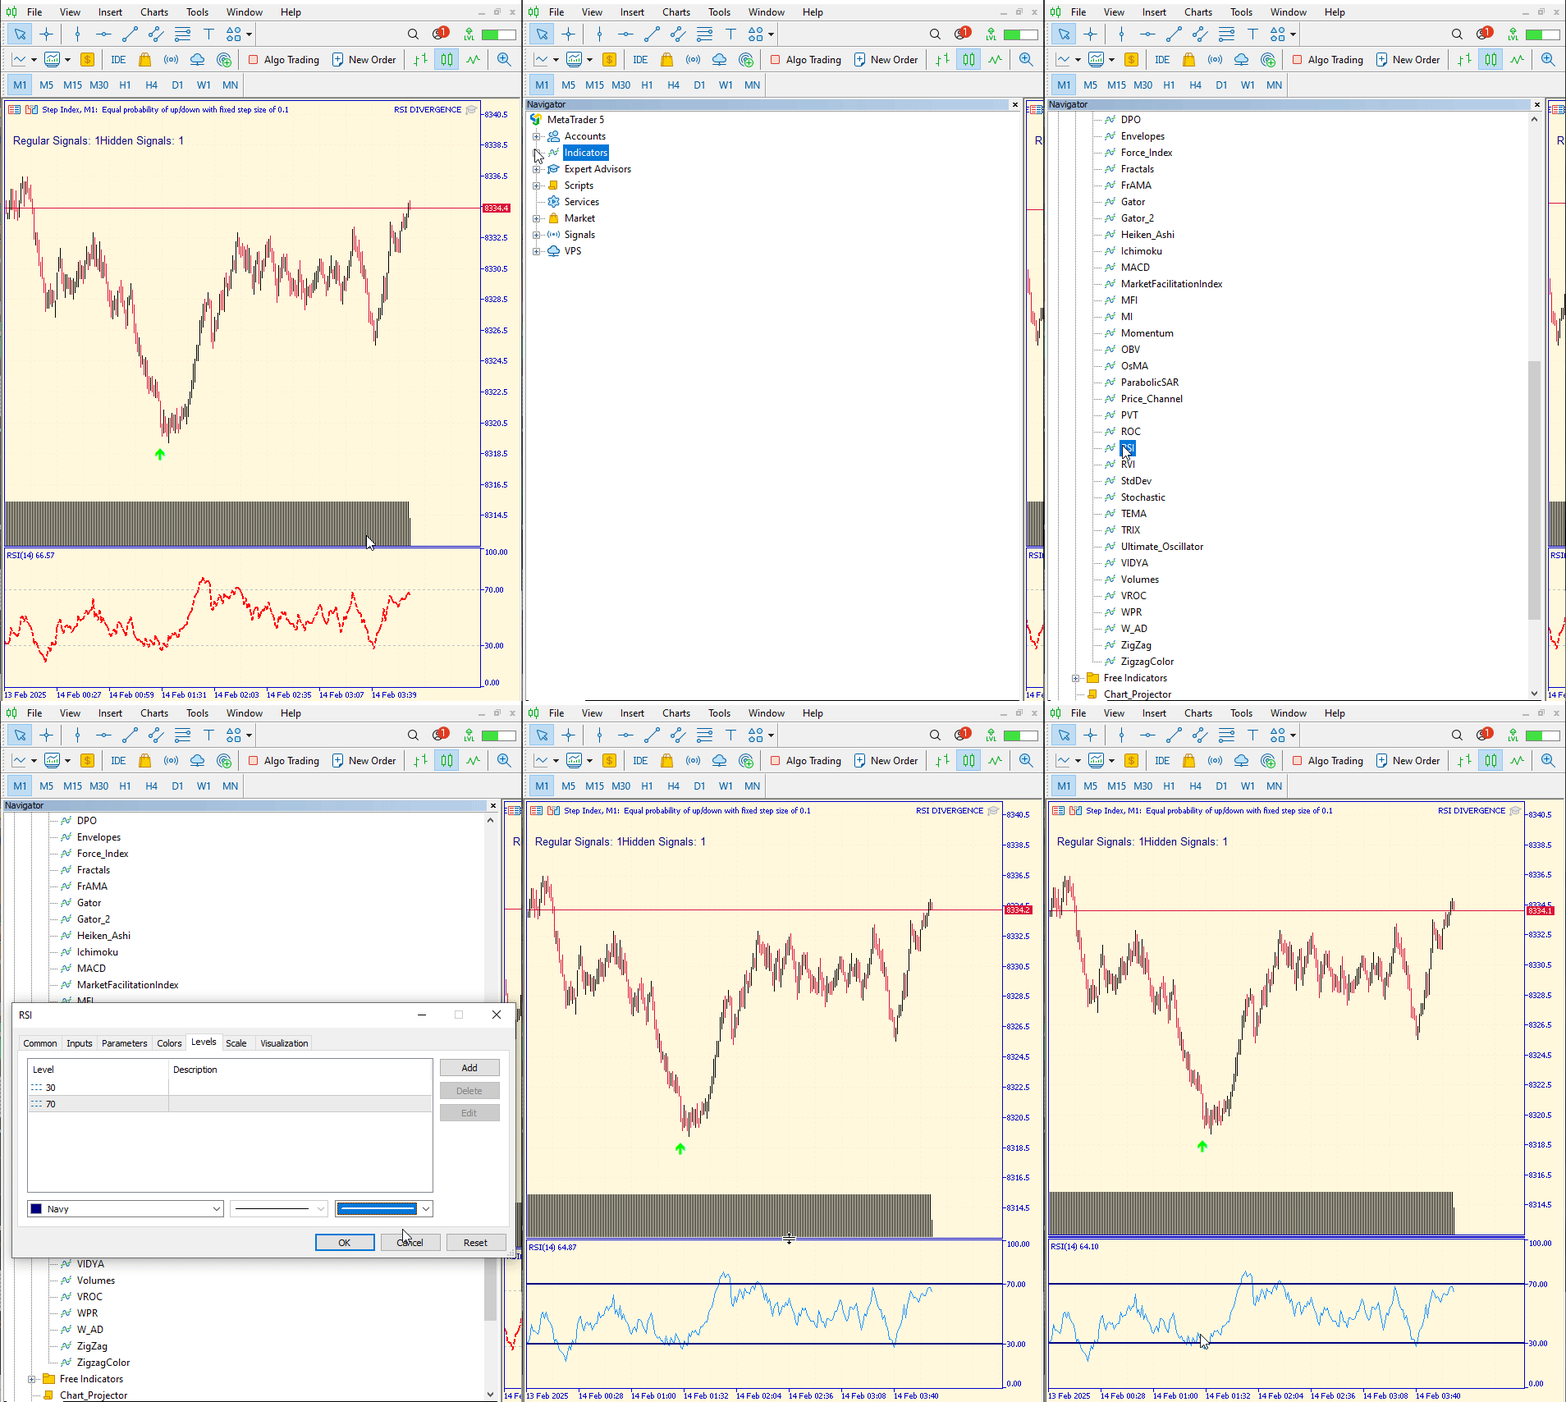
Fig 5. Setting Indicator and Test Result 1
Below is another test we conducted on Boom 500, confirmed by both the price action and the RSI indicator, showing a sell signal.
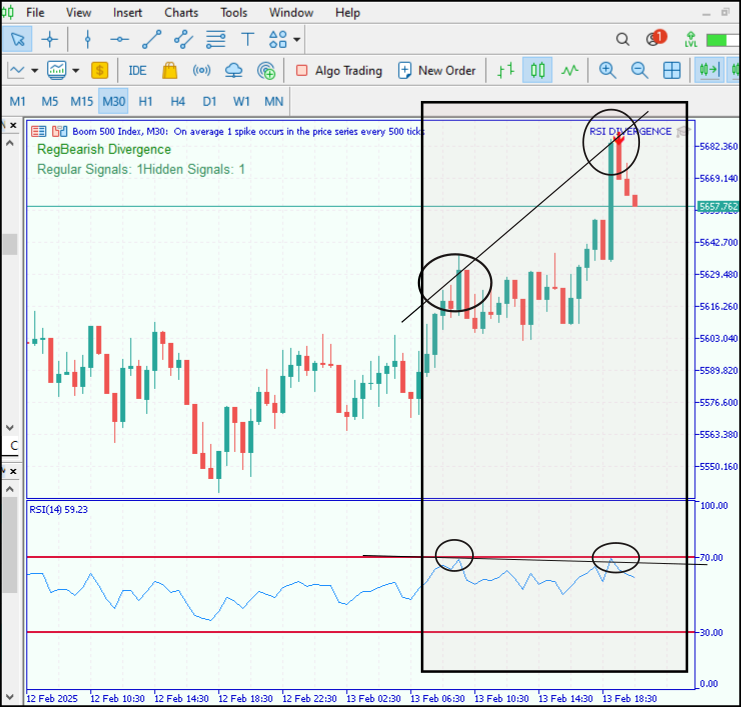
Fig 6. Test Result 2
Another test was conducted using backtesting on the GIF below, which shows several positive shifts. If you look closely, you'll notice both hidden continuation signals and regular signals. However, a few signals need to be filtered out due to a lack of confirmation, despite their positive impact.
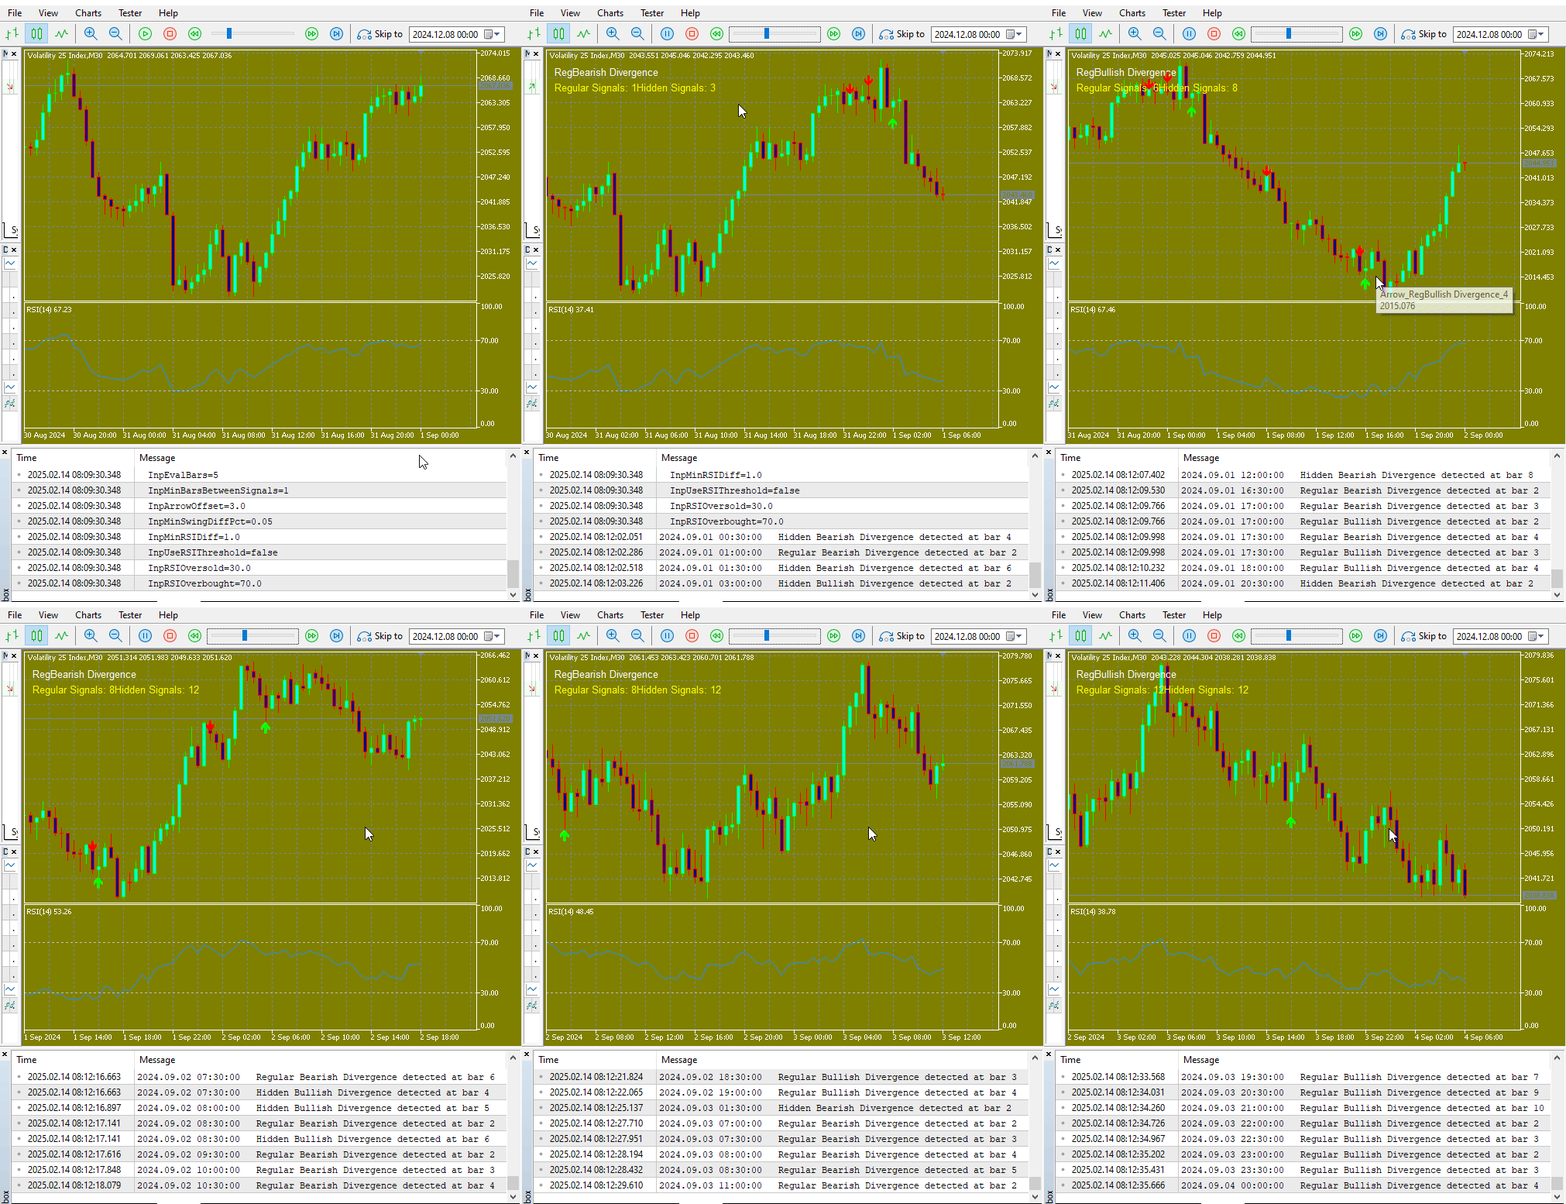
Fig 7. Test Result 3
Conclusion
This tool has proven to be extremely aligned with price action, which is the core aim of our series to create as many price action analysis tools as possible. I have truly appreciated how effectively the RSI indicator interacts with price action by extracting positive signals from divergences. The tests we conducted have shown promising results and a positive trend.
However, I believe it is time to introduce another enhancement that uses external libraries for precise and accurate swing identification, thereby improving signal accuracy. My advice is to test the tool thoroughly and adjust its parameters to suit your trading style. Remember that each generated signal should be cross-checked before entry, as the tool is designed to help you monitor the market and confirm your overall strategy.
| Date | Tool Name | Description | Version | Updates | Notes |
|---|---|---|---|---|---|
| 01/10/24 | Chart Projector | Script to overlay the previous day's price action with ghost effect. | 1.0 | Initial Release | First tool in Lynnchris Tool Chest |
| 18/11/24 | Analytical Comment | It provides previous day's information in a tabular format, as well as anticipates the future direction of the market. | 1.0 | Initial Release | Second tool in the Lynnchris Tool Chest |
| 27/11/24 | Analytics Master | Regular Update of market metrics after every two hours | 1.01 | Second Release | Third tool in the Lynnchris Tool Chest |
| 02/12/24 | Analytics Forecaster | Regular Update of market metrics after every two hours with telegram integration | 1.1 | Third Edition | Tool number 4 |
| 09/12/24 | Volatility Navigator | The EA analyzes market conditions using the Bollinger Bands, RSI and ATR indicators | 1.0 | Initial Release | Tool Number 5 |
| 19/12/24 | Mean Reversion Signal Reaper | Analyzes market using mean reversion strategy and provides signal | 1.0 | Initial Release | Tool number 6 |
| 9/01/25 | Signal Pulse | Multiple timeframe analyzer | 1.0 | Initial Release | Tool number 7 |
| 17/01/25 | Metrics Board | Panel with button for analysis | 1.0 | Initial Release | Tool number 8 |
| 21/01/25 | External Flow | Analytics through external libraries | 1.0 | Initial Release | Tool number 9 |
| 27/01/25 | VWAP | Volume Weighted Average Price | 1.3 | Initial Release | Tool number 10 |
| 02/02/25 | Heikin Ashi | Trend Smoothening and reversal signal identification | 1.0 | Initial Release | Tool number 11 |
| 04/02/25 | FibVWAP | Signal generation through python analysis | 1.0 | Initial Release | Tool number 12 |
| 14/02/25 | RSI DIVERGENCE | Price action versus RSI divergences | 1.0 | Initial Release | Tool number 13 |
 Automating Trading Strategies in MQL5 (Part 7): Building a Grid Trading EA with Dynamic Lot Scaling
 Creating a Trading Administrator Panel in MQL5 (Part IX): Code Organization (II): Modularization
 Animal Migration Optimization (AMO) algorithm
 Developing a Replay System (Part 59): A New Future
- Free trading apps
- Over 8,000 signals for copying
- Economic news for exploring financial markets
You agree to website policy and terms of use